Location via proxy:   [ UP ]  
[Report a bug]   [Manage cookies]                
SlideShare a Scribd company logo
1
4Q11 and 2011 Earnings Release
                  March, 14th, 2012


                                      2
Highlights in the Period


• Profarma celebrated the 5th anniversary of its IPO in the year of its own 50th anniversary. Based on its results-oriented culture
and practical initiatives designed day by day, the Company seeks to continue consolidating its prominent position in the
distribution industry in Brazil;


• In 2011, Profarma took a major stride in its growth strategy by acquiring Prodiet Farmacêutica. In the first quarter after the
acquisition (4Q11), Prodiet recorded gross operating revenues of R$ 84.2 million and EBITDA margin of 4.6%, which helped
Profarma improve its profitability and fuel its long-term sustainable growth;


• Concerning the Company’s organic growth, it is worth noting the health and beauty segment, whose sales rose for the eighth
straight quarter. There was a year-over-year increase of 63.9%;


• It is also worth noting the generics category, whose sales climbed by 19.9% year-over-year;


• Consolidated operating expenses fell by 0.4 percentage point in relation to 2010 and totaled 7.3% of net operating revenues;


• The positive consolidated operating cash flow amounted to R$ 29.9 million in 2011, or 1.1% of net operating revenues;


• Sales through electronic orders reached an all-time high and accounted for 69.7% of total sales in 2011.


                                                                                                                                      3
Gross Revenues Evolution
                (R$ million)


                                         3,317.0
                               3,132.8


        928.5
832.3


4Q10    4Q11                    2010      2011


                                                   4
Gross Revenues Breakdown

(R$ Million)                    4Q11    4Q10    Chg. %     2011      2010    Chg. %

Branded                         536.6   554.6    -3.3%   2,083.0   2,083.4    0.0%

Generic                          82.1    59.6   37.6%     263.1     219.5    19.9%

OTC                             129.1   151.4   -14.7%    545.8     590.8     -7.6%

Health and Beauty Products       66.4    43.9   51.2%     233.2     142.3    63.9%

Hospitals and Vaccines          114.3    22.7   404.2%    191.9      96.6    98.7%

Total                           928.5   832.3    11.6%   3,317.0   3,132.8    5.9%


                                                                                      5
Gross Profit and Revenues from Services to Suppliers
                       (R$ million and % Net Revenues)


                    10.6%                            10.7%
  10.1%                                                                   10.2%


                                                     100.3                123.9


                                                     181.1                163.7

   28.4               45.0

   41.7               38.6

   4Q10              4Q11                            2010                 2011
Gross Profit   Revenues from Services to Suppliers           Gross Profit Margin(%)


                                                                                      6
Operating Expenses - SGA
        (R$ million and % Net Revenues)


                                     7.7%
                                            7.3%
7.4%
       7.0%
                                    202.0   204.5


51.5   55.7


4Q10   4Q11                         2010    2011


                                                    7
Ebitda and Ebitda Margin
        (R$ million and % Net Revenues)


       3.2%                          3.0%
2.7%                                        2.7%
                                    79.9
                                            75.9


       25.1
18.6


4Q10   4Q11                         2010    2011


                                                   8
Net Financial Expenses
        (R$ million and % Net Revenues)


       1.1%                          1.1%   1.1%
0.9%

                                            31.2
                                     28.6


       8.4
6.1


4Q10   4Q11                         2010    2011


                                                   9
Net Profit
         (R$ million and % Net Revenues)

1.5%
       1.1%                           1.3%
                                             1.0%

                                      34.4

                                             28.9


10.5
        8.7


4Q10   4Q11                          2010    2011


                                                    10
Summary of Cash Flow

(R$ Million)                                                 4Q11      4Q10     Chg. %    2011     2010     Chg. %

 Cash Flow Generated / (Used) in Operating Activities         15.1     (21.3)      -      29.9     44.4     -32.7%
  Internal Cash Generation                                    17.7     22.2     -20.6%    66.4     67.9     -2.2%
  Operating Assets Variation                                  (2.6)    (43.5)   94.0%     (36.5)   (23.5)   -55.5%
      Trade Accounts Receivable                              (106.1)   (16.4)   -546.6%   (75.3)   (40.6)   -85.3%
      Inventories                                            (71.2)    (64.7)   -10.0%    (31.6)   (1.2) -2,546.2%
      Suppliers                                              194.7     68.5     184.2%    67.2     45.1     48.8%
      Other Items                                            (20.0)    (30.9)   35.2%      3.3     (26.8)     -

 Cash Flow (Used) in Investing Activities                    (10.4)    (3.3)    -215.0%   (15.9)   (8.1)    -96.3%

 Cash Flow Generated / (Used) by Financing Activities         (2.5)    (15.5)   83.9%     (2.7)    (43.8)   93.9%

Net Increase / (Decrease) in Cash                             2.2      (40.1)      -      11.2     (7.5)      -


                                                                                                                     11
4Q10   4Q11

        Cash Cycle - Days *                    49.0   48.0

    Accounts Receivable       (1)              43.6   46.0

    Inventories (2)                            52.0   48.9

    Accounts Payable    (3)                    46.6   46.8

 * Average
(1) Average of Gross Revenues in the Quarter
(2) Average of COGS in the Quarter
(3) Average of COGS in the Quarter


                                                             12
Indebtedness:
          Net Debt and Net Debt / Ebitda*
                          (R$ million)

                   1.4x                  1.6x


                                         118.9
                 108.7


                 2010                    2011

* Ebitda = accumulated last 12 months


                                                 13
Capex
                                 (R$ million and % Net Revenues)


        0.5%                   0.5%                           0.3%   0.3%

                                                                     9.3*
                                                              8.3


         3.5                    3.7


       4Q10                    4Q11                          2010    2011
* Prodiet investiments are not included.


                                                                            14
Service Level                                Logistics E.P.M.
        (Units served / Units Requested)                      (Errors per Million)


                                                                                       184.0
                              90.1%                170.0
           89.3%                           89.3%                               150.0

88.1%                                                      114.0


4Q10       4Q11               2010         2011    4Q10    4Q11                2010    2011


                                                                                               15
Profarma vs Ibovespa - % 4Q11

115


110
                                                           108
                                                           108

105


100


 95


 90


 85
 30-Sep-11   30-Oct-11                   29-Nov-11   29-Dec-11

                         Ibovespa    Profarma

                                                                 16


                                                                  16
Analyst Coverage

Company          Analyst                                Telephone           E-mail

                 Javier Martinez de Olcoz Cerdan        (1 212) 761-4542    javier.martinez.olcoz@morganstanley.com
Morgan Stanley
                 Clarissa Berman                        (55 11) 3048-6214   clarissa.berman@morganstanley.com


Merrill Lynch    Mauricio Fernandes                     (55 11) 2188-4236   Mauricio.fernandes@baml.com


Credit Suisse    Marcel Moraes                          (55 11) 3841-6302   marcel.moraes@credit-suisse.com


                 Marcio Osako                           (55 11) 3073-3040   marcio.osako@itausecurities.com
Itaú BBA
                 Juliana Rozenbaum                      (55 11) 3073-3035   juliana.rozenbaum@itausecurities.com


Banco Fator      Iago Whately                           (55 11) 3049-9480   iwhately@bancofator.com.br


Raymond James    Guilherme Assis                        (55 11) 3513-8706   guilherme.assis@raymondjames.com


BTG Pactual      João Carlos dos Santos                 (55 11) 3383-2384   joaocarlos.santos@btgpactual.com


                 Andre Parize                           (55 11) 5171-5870   andre.parize@votorantimcorretora.com.br
Votorantim
                 Marco Richieri                         (55 11) 5171-5873   marco.richieri@votorantimcorretora.com.br


                                                                                                                        17
Contatos RI
                                  IR Contacts
                     Max Fischer | Diretor Financeiro e de RI
                          Max Fischer | CFO and IRO
                          Beatriz Diez | | IR Manager
                           Beatriz Diez Gerente de RI                                18

Telefone.: 55 (21) 4009-0276 | E-mail: ri@profarma.com.br | www.profarma.com.br/ri
 Phone.: 55 (21) 4009-0276 | E-mail: ri@profarma.com.br | www.profarma.com.br/ri

More Related Content

Profarma 4 q11

  • 1. 1
  • 2. 4Q11 and 2011 Earnings Release March, 14th, 2012 2
  • 3. Highlights in the Period • Profarma celebrated the 5th anniversary of its IPO in the year of its own 50th anniversary. Based on its results-oriented culture and practical initiatives designed day by day, the Company seeks to continue consolidating its prominent position in the distribution industry in Brazil; • In 2011, Profarma took a major stride in its growth strategy by acquiring Prodiet Farmacêutica. In the first quarter after the acquisition (4Q11), Prodiet recorded gross operating revenues of R$ 84.2 million and EBITDA margin of 4.6%, which helped Profarma improve its profitability and fuel its long-term sustainable growth; • Concerning the Company’s organic growth, it is worth noting the health and beauty segment, whose sales rose for the eighth straight quarter. There was a year-over-year increase of 63.9%; • It is also worth noting the generics category, whose sales climbed by 19.9% year-over-year; • Consolidated operating expenses fell by 0.4 percentage point in relation to 2010 and totaled 7.3% of net operating revenues; • The positive consolidated operating cash flow amounted to R$ 29.9 million in 2011, or 1.1% of net operating revenues; • Sales through electronic orders reached an all-time high and accounted for 69.7% of total sales in 2011. 3
  • 4. Gross Revenues Evolution (R$ million) 3,317.0 3,132.8 928.5 832.3 4Q10 4Q11 2010 2011 4
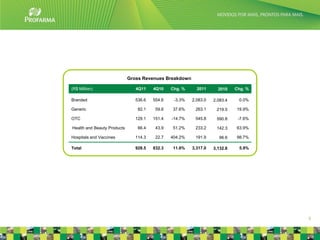
  • 5. Gross Revenues Breakdown (R$ Million) 4Q11 4Q10 Chg. % 2011 2010 Chg. % Branded 536.6 554.6 -3.3% 2,083.0 2,083.4 0.0% Generic 82.1 59.6 37.6% 263.1 219.5 19.9% OTC 129.1 151.4 -14.7% 545.8 590.8 -7.6% Health and Beauty Products 66.4 43.9 51.2% 233.2 142.3 63.9% Hospitals and Vaccines 114.3 22.7 404.2% 191.9 96.6 98.7% Total 928.5 832.3 11.6% 3,317.0 3,132.8 5.9% 5
  • 6. Gross Profit and Revenues from Services to Suppliers (R$ million and % Net Revenues) 10.6% 10.7% 10.1% 10.2% 100.3 123.9 181.1 163.7 28.4 45.0 41.7 38.6 4Q10 4Q11 2010 2011 Gross Profit Revenues from Services to Suppliers Gross Profit Margin(%) 6
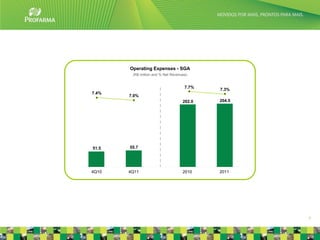
  • 7. Operating Expenses - SGA (R$ million and % Net Revenues) 7.7% 7.3% 7.4% 7.0% 202.0 204.5 51.5 55.7 4Q10 4Q11 2010 2011 7
  • 8. Ebitda and Ebitda Margin (R$ million and % Net Revenues) 3.2% 3.0% 2.7% 2.7% 79.9 75.9 25.1 18.6 4Q10 4Q11 2010 2011 8
  • 9. Net Financial Expenses (R$ million and % Net Revenues) 1.1% 1.1% 1.1% 0.9% 31.2 28.6 8.4 6.1 4Q10 4Q11 2010 2011 9
  • 10. Net Profit (R$ million and % Net Revenues) 1.5% 1.1% 1.3% 1.0% 34.4 28.9 10.5 8.7 4Q10 4Q11 2010 2011 10
  • 11. Summary of Cash Flow (R$ Million) 4Q11 4Q10 Chg. % 2011 2010 Chg. % Cash Flow Generated / (Used) in Operating Activities 15.1 (21.3) - 29.9 44.4 -32.7% Internal Cash Generation 17.7 22.2 -20.6% 66.4 67.9 -2.2% Operating Assets Variation (2.6) (43.5) 94.0% (36.5) (23.5) -55.5% Trade Accounts Receivable (106.1) (16.4) -546.6% (75.3) (40.6) -85.3% Inventories (71.2) (64.7) -10.0% (31.6) (1.2) -2,546.2% Suppliers 194.7 68.5 184.2% 67.2 45.1 48.8% Other Items (20.0) (30.9) 35.2% 3.3 (26.8) - Cash Flow (Used) in Investing Activities (10.4) (3.3) -215.0% (15.9) (8.1) -96.3% Cash Flow Generated / (Used) by Financing Activities (2.5) (15.5) 83.9% (2.7) (43.8) 93.9% Net Increase / (Decrease) in Cash 2.2 (40.1) - 11.2 (7.5) - 11
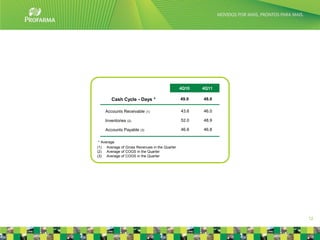
  • 12. 4Q10 4Q11 Cash Cycle - Days * 49.0 48.0 Accounts Receivable (1) 43.6 46.0 Inventories (2) 52.0 48.9 Accounts Payable (3) 46.6 46.8 * Average (1) Average of Gross Revenues in the Quarter (2) Average of COGS in the Quarter (3) Average of COGS in the Quarter 12
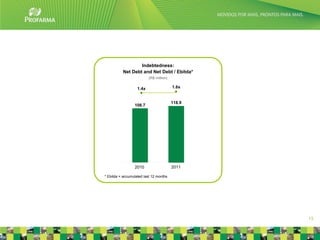
  • 13. Indebtedness: Net Debt and Net Debt / Ebitda* (R$ million) 1.4x 1.6x 118.9 108.7 2010 2011 * Ebitda = accumulated last 12 months 13
  • 14. Capex (R$ million and % Net Revenues) 0.5% 0.5% 0.3% 0.3% 9.3* 8.3 3.5 3.7 4Q10 4Q11 2010 2011 * Prodiet investiments are not included. 14
  • 15. Service Level Logistics E.P.M. (Units served / Units Requested) (Errors per Million) 184.0 90.1% 170.0 89.3% 89.3% 150.0 88.1% 114.0 4Q10 4Q11 2010 2011 4Q10 4Q11 2010 2011 15
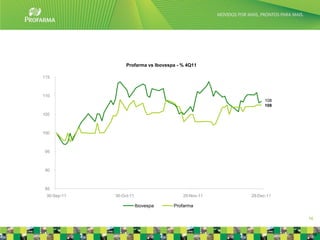
  • 16. Profarma vs Ibovespa - % 4Q11 115 110 108 108 105 100 95 90 85 30-Sep-11 30-Oct-11 29-Nov-11 29-Dec-11 Ibovespa Profarma 16 16
  • 17. Analyst Coverage Company Analyst Telephone E-mail Javier Martinez de Olcoz Cerdan (1 212) 761-4542 javier.martinez.olcoz@morganstanley.com Morgan Stanley Clarissa Berman (55 11) 3048-6214 clarissa.berman@morganstanley.com Merrill Lynch Mauricio Fernandes (55 11) 2188-4236 Mauricio.fernandes@baml.com Credit Suisse Marcel Moraes (55 11) 3841-6302 marcel.moraes@credit-suisse.com Marcio Osako (55 11) 3073-3040 marcio.osako@itausecurities.com Itaú BBA Juliana Rozenbaum (55 11) 3073-3035 juliana.rozenbaum@itausecurities.com Banco Fator Iago Whately (55 11) 3049-9480 iwhately@bancofator.com.br Raymond James Guilherme Assis (55 11) 3513-8706 guilherme.assis@raymondjames.com BTG Pactual João Carlos dos Santos (55 11) 3383-2384 joaocarlos.santos@btgpactual.com Andre Parize (55 11) 5171-5870 andre.parize@votorantimcorretora.com.br Votorantim Marco Richieri (55 11) 5171-5873 marco.richieri@votorantimcorretora.com.br 17
  • 18. Contatos RI IR Contacts Max Fischer | Diretor Financeiro e de RI Max Fischer | CFO and IRO Beatriz Diez | | IR Manager Beatriz Diez Gerente de RI 18 Telefone.: 55 (21) 4009-0276 | E-mail: ri@profarma.com.br | www.profarma.com.br/ri Phone.: 55 (21) 4009-0276 | E-mail: ri@profarma.com.br | www.profarma.com.br/ri