Profitability and efficiency analyses of organic temperate vegetable production in the Philippines

This research analyzed the profitability and efficiency of organic temperate vegetable production through the supply chain approach. Survey, key informant interviews, participant observation and archival research were used to gather data. Thirty eight (38) producers and 11 traders in the Cordillera Administrative Region (CAR), Region III and Region IVA served as respondents. Descriptive statistics, cost and return analysis and efficiency analysis were used to analyze research results. The emergence of new breeds of players makes the marketing channel of organic vegetables in the CAR complex compared to a simpler, more modern and integrated chain in the regions outside of the CAR. The six key players in the marketing of organic vegetables are the cooperative, assembler-wholesaler-retailer, assembler-wholesaler, assembler- retailer, retailer and institutional buyers. Returns to total expenses were highest for native cucumber, cauliflower, Japanese spinach, broccoli and lettuce ranging from 100 percent to 235 percent. Native cucumber, cauliflower, Japanese spinach, broccoli, French beans, and lettuce give higher profits to farmers ranging from 49.00 pesos to 71.00 pesos per kilogram. The production of cabbage, native cucumber, cauliflower, Japanese spinach, broccoli, French beans, and lettuce requires low capital, labor and land use intensity indicating high efficiency. Value chain and marketing margin analyses show cost and margin differentials across players and across geographic locations indicating variations in the distribution of benefits among key actors. With the premium price that organic products command and the low capitalization, land and labor utilization needed, organic temperate vegetable production is profitable and efficient which determine its sustainability in the long run.


Profitability and efficiency analyses of organic temperate vegetable production in the Philippines
- 1. J. Bio. & Env. Sci. 2023 93 | Cabrea et al. RE RE RE RESEARCH SEARCH SEARCH SEARCH PAPER PAPER PAPER PAPER OPEN ACCESS OPEN ACCESS OPEN ACCESS OPEN ACCESS Profitability and efficiency analyses of organic temperate vegetable production in the Philippines Necitas M. Cabrera* , Diego A. Waguey Don Mariano Marcos Memorial State University, Agoo, La Union, Philippines Article published on April 19, 2023 Key words: Organic temperate vegetables, Profitability, Efficiency, Value chain, Marketing margins Abstract This research analyzed the profitability and efficiency of organic temperate vegetable production through the supply chain approach. Survey, key informant interviews, participant observation and archival research were used to gather data. Thirty eight (38) producers and 11 traders in the Cordillera Administrative Region (CAR), Region III and Region IVA served as respondents. Descriptive statistics, cost and return analysis and efficiency analysis were used to analyze research results. The emergence of new breeds of players makes the marketing channel of organic vegetables in the CAR complex compared to a simpler, more modern and integrated chain in the regions outside of the CAR. The six key players in the marketing of organic vegetables are the cooperative, assembler-wholesaler-retailer, assembler-wholesaler, assembler- retailer, retailer and institutional buyers. Returns to total expenses were highest for native cucumber, cauliflower, Japanese spinach, broccoli and lettuce ranging from 100 percent to 235 percent. Native cucumber, cauliflower, Japanese spinach, broccoli, French beans, and lettuce give higher profits to farmers ranging from 49.00 pesos to 71.00 pesos per kilogram. The production of cabbage, native cucumber, cauliflower, Japanese spinach, broccoli, French beans, and lettuce requires low capital, labor and land use intensity indicating high efficiency. Value chain and marketing margin analyses show cost and margin differentials across players and across geographic locations indicating variations in the distribution of benefits among key actors. With the premium price that organic products command and the low capitalization, land and labor utilization needed, organic temperate vegetable production is profitable and efficient which determine its sustainability in the long run. *Corresponding Author: Necitas M. Cabrera nbcabrera@dmmmsu.edu.ph Journal of Biodiversity and Environmental Sciences (JBES) ISSN: 2220-6663 (Print) 2222-3045 (Online) Vol. 22, No. 4, p. 93-103, 2023 http://www.innspub.net
- 2. J. Bio. & Env. Sci. 2023 94 | Cabrea et al. Introduction The Philippines’ effort to shift from conventional to bio-organic farming took a serious turn with the signing in 2010 of Republic Act 10068 otherwise known as the Organic Agriculture Act of 2010 which aims to strengthen the State’s policy to promote, propagate, develop further and implement the practice of organic agriculture. Through organic agriculture, community-based organic agriculture systems are established and organic agriculture system as a viable alternative is adopted. Then President Benigno C. Aquino himself acknowledged that organic farming is the way to go in food security that would address hunger, sustain health and environment and develop the country’s niche in the world market for organic agri-industries. He recognized that focusing national attention on the importance of organic agriculture would enhance global competitiveness and environmental integrity, increase food security and safety and alleviate poverty. According to the International Federation of Organic Agriculture Movements (IFOAM), the Philippines ranks number 5 among the largest number of organic producers with 165,958 producers and number 8 among the largest number of hectarage of organic land with 234,642 hectares, in the world with a production volume of 525,863 metric tons (IFOAM, 2014). Rice, banana, corn, coconut, sugarcane, and temperate vegetables were among the first products to be produced using the natural and organic way. Being a relatively new product and a relatively new industry, the supply chain of organic temperate vegetables has never been analysed to critically pinpoint where its strengths and weaknesses lie. It is widely recognized in the agricultural sector that if farmers are to be competitive in both domestic and international markets, their supply chains need to be more efficient and effective. Improving the competitiveness of a supply chain relies upon improving the efficiency of all its elements from production, processing, handling, distribution and marketing. Previous studies on supply chain of specific vegetables, like lettuce have highlighted poor marketing efficiency and erratic prices as circumstances that aggravated the lot of farmers who need to borrow capital for production (Fang-asan, 2008). In the Philippines where farming is generally small-hold and farmers are mired in a vicious cycle of poverty, farmers need to make profit in order to remain in production. Organic vegetable farming in the Philippines is important to the country’s food security. Organic vegetables are not only nutritious and free from harmful chemicals, but they are also more resilient to pests and diseases. This makes it ideal for small-scale farmers who cannot afford to use expensive chemicals on their crops. The future of organic vegetable farming in the Philippines looks promising with more and more people recognizing the benefits of eating organic food. With proper support from the government and private sector, small-scale farmers will be able to continue producing healthy, chemical- free vegetables for Filipino consumers. While the health benefits of organic farming to the environment, to farmers and to Filipino consumers, cannot be overemphasized, it is critical that organic farming is profitable enough to encourage farmers to engage in production or to stay in business. This research intended to determine the profitability and efficiency of organic temperate vegetable production and marketing, the marketing channels and the value chain and marketing margins of each player in the chain which may encourage farmers to engage in production improve their social condition and make the industry sustainable in the long run. The analysis was focused on eleven (11) commodities, namely: beans (Phaseolus vulgaris, snap bean and French bean varieties), broccoli (Brassica oleracea var. italica), cabbage (Brassica oleracea var. capitata), carrots (Daucus carota subsp. Sativus), cauliflower (Brassica oleracea var. botrytis), cucumber (Cucumis sativus, native and Japanese
- 3. J. Bio. & Env. Sci. 2023 95 | Cabrea et al. cucumber varieties), lettuce (Lactuca sativa, fancy varieties), pechay (Brassica rapa subsp. oleifera and Brassica rapa subsp. chinesis), potato (Solanum tuberosum), spinach (Spinacia oleracea New Zealand and Japanese spinach varieties) and tomato (Solanum lycopersicum big and cherry tomato varieties). Materials and methods Project Sites and Respondents The study covered the vegetable producing Regions of the Cordillera Administrative Region (CAR), Region III or Central Luzon and Region IV-A or CALABARZON. The lists of certified organic vegetable producers were obtained from the Organic Certification Center of the Philippines (OCCP) and the Negros Island Certification Services (NICERT). The lists were updated as of 2013 which also included those certified in 2011 and 2012 and those in the process of renewing their certification status. Those which have ceased operation at the time of the study were disregarded. Certified, school-based demo- farms in the lists were not also part of the study. In the CAR, only two organic vegetable producers are certified. Only one organic vegetable producer in Region III is certified and in the CALABARZON area, eleven (11) farms were in the list. Except for CALABARZON, a complete enumeration of the certified organic vegetable producers was obtained. A total of 38 organic producers (CAR=31, Region III=1, Region IVA=6) and 11 traders were involved in the study. Data Collection and Analysis Survey method was used as the primary data gathering technique. Both primary and secondary data were collected and utilized. Primary data were gathered through survey, personal interviews, key informant interviews, telephone inquiries/mobile short messaging systems (SMS)/email communications, participant observation and ocular inspection. Two (2) survey instruments were developed to obtain information from the organic vegetable producers and traders. Secondary data were requested from both government and non-government institutions that included the Department of Agriculture, Agricultural Training Institute, Bureau of Agricultural Statistics and Spread Organic Agriculture in the Philippines (SOAP) To supplement data gathered from the above sources, archival research and benchmarking were done. Existing literature available on line were accessed. These materials were bases of data documenting the activities of major players of the supply chain like supermarkets in the absence of primary data as some interviewees invoked data privacy on the identity of their regular buyers/customers. Unpublished materials like flyers, pamphlets and other IEC materials on conventional production deemed related to the present study were also considered as sources of benchmark data and were used to compare data obtained in the study. Data based on a third party account of the researcher were also injected into the discussion, when needed. These included developments in the industry within the period the research was conducted until the making of the research report. Descriptive statistics like frequency counts, percentages and means/averages were used to define and assess organic vegetable production and marketing systems.. Cost and return analysis was used to determine profitability. Specific cost items like depreciation, labor and transportation were estimated using ratio and proportion. Efficiency was computed using input-output ratio. To measure the extent of input utilization in organic vegetable production, the ratios between production factors and output were computed per unit area of 50m2 and 2000m2, respectively for CAR and outside of CAR. The following ratios were used: a) Capital-Output Ratio (COR) is the ratio between total cost of production and the value of total output which implies how intensive capital was used; b) Labor-Output Ratio (LOR) is the ratio between total farm labor (in man-days) and total value of output which implies how intensive labor was used; and c) Land-Output Ratio (SOR) is the ratio between the total area cultivated (in square meters) and total value of output which implies how productive land was used.
- 4. J. Bio. & Env. Sci. 2023 96 | Cabrea et al. Results and discussion Key Players in the Chain In the CAR, marketing associations and cooperatives composed of organic producers are at the forefront of the Industry. Some producers perform dual functions along the chain since they also take active roles in the marketing of organic produce. Outside the CAR, corporations are the major players in the industry. These corporations ventured or diversified into organic farming for economic, social and health reasons. There are generally six (6) key players in the chain: input suppliers, vegetable producers, assembler/consolidator/ integrator-wholesaler-retailers, retailers, institutional buyers and consumers. Institutional buyers are composed of hotels, restaurants and cancer clinics/hospitals. Input Supply Farm supply stores sell production inputs like seeds, fertilizers and pesticides but these are unaffordable, limited in supply or of poor quality. Seeds sold are not guaranteed certified organically produced seeds. Farmers are encouraged to produce their own inputs. Very few farmers could afford to buy hybrid or certified seed varieties. Fertilizers are produced using traditional composting method, vermicomposting and the use of “Mokusako” and “Bokashi” Japanese technologies. The intensive use of effective microorganisms to facilitate the process was noted. Pests, insects and diseases are managed and controlled using botanical pesticides concocted by the farmers and integrated pest management practices like crop rotation. Otherwise, pests and diseases are controlled manually. Production In the CAR, production of organic temperate vegetables is described as a system wherein different kinds and/or varieties of vegetables are raised in complement with or intercropped with the other to maximize the production area. Outside the CAR, vegetable production is more an integrated system with the inclusion of fruit trees, root crops, rice, poultry, livestock and fishery in the production area. Organic vegetable production in the CAR is characterized as small-hold with farmers cultivating an average of 256 square meters of various crops at one given time. In Regions III and IV-A, area devoted to organic vegetable production is more than one- fourth of a hectare (2688.10 square meters), on the average. This resulted to an average annual production volume of more than 39MT in the CAR, 23 percent of which is lettuce. During months when production supply is high, particularly March and April, a high degree of pull-out or spoilage is incurred by farmers. This occurs since the farmers simultaneously harvest the crops they have planted during the colder months of the year. In Region III and IVA, annual production volume was estimated to be more than 380MT, more than 53 percent of which is also lettuce For a 50 square meter production area in the CAR (Table 1), returns to total expenses were highest for native cucumber, cauliflower, Japanese spinach, broccoli and lettuce ranging from 100 percent to 235 percent. Net profit per kilogram was highest for native cucumber, cauliflower, French beans, broccoli and Japanese spinach ranging from 49.00 pesos to 71.00 pesos. In terms of input-utilization ratios which measure the efficiency of organic vegetable production, lower capitalization is needed to produce these vegetables: native cucumber, cauliflower, Japanese spinach, broccoli, lettuce, French beans and cabbage. It requires only less than 0.50 centavos to produce one peso worth of output for these vegetables. The production of native cucumber and cauliflower requires the least labor among all the crops as shown by very low labor-output ratios. Since land-output ratios are less than one (1) for all crops, the production of organic vegetables in the Cordilleras is productive in terms of intensity of land utilization.
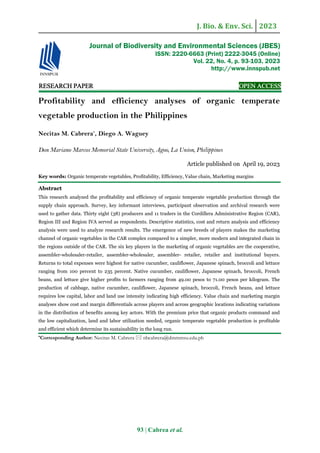
- 5. J. Bio. & Env. Sci. 2023 97 | Cabrea et al. Table 1. Profitability and efficiency analyses of organic temperate vegetable production (50m2)-CAR. Baguio/ Snap Beans French Beans Broccoli Cabbage Carrots Cauliflowe r Japanese Cucumber Native Cucumber Lettuce Pechay (flowering ) Pechay (others) Potato Spinach (New Zealand) Spinach (Japanese ) Tomato (large) Tomato (Cherry) I. Gross Profit Yield (kilogram) Price per kilogram 3539.40 69.4 51.00 8580.75 67.3 127.50 8160.00 80 102.00 8908.00 131 68.00 7639.80 74.9 102.00 15932.40 156.2 102.00 8427.75 66.1 127.50 8884.20 87.1 102.00 3893.00 45.8 85.00 4263.60 62.7 68.00 2427.60 47.6 51.00 5854.80 86.1 68.00 5856.50 68.9 85.00 4768.50 56.1 85.00 12223.00 143.8 85.00 11271.00 110.5 102.00 II. Expenses Labor a/ Cost of seeds b/ Packaging material c/ Farm rental d/ Depreciation e/ Transportation f/ Contingency g/ Total Expenses 1682.00 140.00 278.00 127.00 207.00 130.00 223.00 2787.00 2407.00 800.00 269.00 134.00 291.00 94.00 357.00 4352.00 2668.00 84.00 320.00 195.00 319.00 100.00 317.00 4003.00 2708.00 84.00 524.00 205.00 334.00 352.00 367.00 4574.00 2973.00 563.00 300.00 196.00 382.00 122.00 395.00 4931.00 3635.00 63.00 625.00 204.00 686.00 170.00 450.00 5833.00 3110.00 600.00 264.00 185.00 658.00 172.00 414.00 5403.00 1370.00 225.00 348.00 92.00 181.00 219.00 216.00 2651.00 1291.00 15.00 183.00 80.00 157.00 58.00 155.00 1939.00 2386.00 5.00 251.00 123.00 234.00 78.00 272.00 3349.00 894.00 5.00 190.00 74.00 93.00 90.00 118.00 1464.00 2211.00 204.00 345.00 185.00 242.00 55.00 281.00 3520.00 3464.00 18.00 276.00 205.00 299.00 120.00 388.00 4771.00 1284.00 18.00 225.00 68.00 212.00 56.00 158.00 2021.00 4712.00 30.00 575.00 185.00 520.00 263.00 559.00 6844.00 4921.00 220.00 442.00 308.00 715.00 247.00 579.00 7335.00 Net Profit (Php) 752.40 4228.75 4157.00 4334.00 2708.80 10099.40 3024.75 6233.20 1954.00 914.60 963.60 2334.80 1085.50 2747.50 5379.00 3936.00 Return to Total Expenses (%) 27.00 97.20 100.38 94.80 54.90 173.10 56.00 235.10 100.80 27.30 65.80 66.30 22.80 135.90 78.60 53.70 Average Production Cost (Php/kg) 40.20 64.70 50.00 34.90 65.80 37.30 81.70 30.40 42.30 53.40 30.80 40.90 69.20 36.00 47.60 66.40 Net Profit per Kilogram (Php) 10.80 62.80 52.00 33.10 36.20 64.70 45.80 71.60 42.70 14.60 20.20 27.10 15.80 49.00 37.40 35.60 Break-even Yield (kg) 54.6 34.1 39.2 67.3 48.3 57.2 42.4 26.0 22.8 49.3 28.7 51.8 56.1 23.8 80.5 71.9 Capital-Output Ratio 0.72 0.47 0.45 0.47 0.59 0.34 0.59 0.27 0.46 0.72 0.55 0.55 0.75 0.39 0.51 0.60 Labor-Output Ratio 0.0019 0.0011 0.0013 0.0012 0.0016 0.0009 0.0015 0.0006 0.0013 0.0022 0.0015 0.0015 0.0024 0.0011 0.0015 0.0017 Land-Output Ratio 0.0141 0.0058 0.0061 0.0056 0.0065 0.0031 0.0059 0.0056 0.0128 0.0117 0.0206 0.0085 0.0085 0.0105 0.0041 0.0044 a- 250 pesos per day b- Volume of seed per square meter x area planted x price of seed per gram c- Total production in kilogram x 4 pesos d- 15 pesos per square meter per year e- Straight line method, 10 present salvage value f- Fare or gasoline computed in proportion to total volume of vegetables delivered g- 10 present of cash cost, excluding farm rental and depreciation; used for fuel & oil, electricity, other supplies like molasses, etc. In Regions III and IV-A, a 2000 square meter organic production area (Table 2) proved highly profitable based on the computed returns to total expenses. For every peso invested in the production of one kilogram of cauliflower, lettuce (romaine and xanadu varieties), broccoli, cabbage and French beans, percentage returns to total expenses range from 537 to 1175. Less than 20 centavos is needed to produce a peso worth of output for these crops indicating low utilization of capital: Japanese cucumber, French beans, cabbage, broccoli, lettuce (romaine and xanadu) and cauliflower. Labor utilization and land utilization ratios are also low indicating. Those organic vegetable productions in these regions are not labor and land use intensive. Table 2. Profitability & efficiency analyses of organic temperate vegetable production (2000m2)-Regions III & IV Beans (Snap) Beans (French) Broccoli Cabbage Carrots Cauliflower Cucumber (Japanese) Cucumber (American) Lettuce (Romaine) Lettuce (Lollo Rossa) Pechay (Native) Pechay (Pakchoi) Spinach (Japanese) Spinach (New Zealand) Tomato (Small) Tomato (Large) I. Gross Profit Yield (kilogram) Price per kilogram 162000.0 2700 60.00 780000.0 2600 300.00 80000. 3200 250.00 780000 5200 150.00 580000 2900 200.00 1550000.0 6200 250.00 312000.00 2600 120.00 272000.00 3400 80.00 680000.0 3400 200.00 315000. 1800 175.00 200000 2500 80.00 152000.0 1900 80.00 264000.00 2200 120.00 324000.0 2700 120.00 880000. 4400 200.00 570000.0 5700 100.00 II. Expenses Labor a/ Cost of seeds b/ Packaging material c/ Farm rental d/ Depreciation e/ Transportation f/ Contingency g/ Total Expenses 59368.00 3200.00 5400.00 328.00 15472.00 576.00 6854.00 91198.00 59368.00 32000.00 5200.00 328.00 15472.00 384.00 9695.00 122447.0 46914.0 2971.0 6400.0 329.0 13814.0 286.0 5657.0 76371.0 49893.0 0 2973.00 10400.0 0 493.00 38680. 0 36550.0 2100.00 5800.0 650.00 193400. 400.00 4485.00 243385. 51050.00 2250.00 12400.00 325.00 48350.00 600.00 6630.00 121605.00 42689.00 7800.00 5200.00 244.00 6449.00 440.00 5613.00 68435.00 42947.00 7800.00 6800.00 329.00 8596.00 249.00 5780.00 72501.00 44660.00 553.00 6800.00 247.00 1451.00 441.00 5245.00 59397.00 51308.0 1430.00 3600.0 219.00 5784.00 1370.00 6270.0 69981.0 34575.0 175.00 5000.00 115.00 1693.00 173.00 3992.00 45723.0 34775.00 175.00 3800.00 115.00 3385.00 190.00 3894.00 46334.00 71300.00 633.00 4400.00 111.00 7522.00 189.00 7652.00 91807.00 71689.00 633.00 5400.00 167.00 10744.00 1222.00 7894.00 97749.00 53700.00 450.00 8800.00 650.00 193400.0 700.00 6365.00 264065.0 38950.00 150.00 11400.00 350.00 96700.00 400.00 5090.00 153040.0 Net Profit (Php) 70802.00 657553.0 723629. 670941. 0 336615. 1428395.0 243565.00 199499.00 620603.0 245019. 154277. 105666.0 172193.00 226251.0 615935.0 416960.0 Return to Total Expenses (%) 77.6 537.0 947.5 615.2 138.3 1174.6 355.9 275.2 1044.8 350.1 337.4 228.1 187.6 231.5 233.3 272.5 Average Production Cost (Php/kg) 33.80 47.10 23.90 21.00 83.90 19.60 26.30 21.30 17.50 38.90 18.30 24.40 41.70 36.20 60.00 26.80 Net Profit per Kilogram (Php) 26.20 252.90 226.10 129.00 116.10 230.40 93.70 58.70 182.50 136.10 61.70 55.60 78.30 83.80 140.00 73.20 Break-even Yield (kg) 1520.0 408.2 305.5 727.1 1216.9 486.4 570.3 906.3 297.0 399.9 571.5 579.2 765.1 814.6 1320.3 1530.4 Capital h/-Output Ratio 0.52 0.14 0.09 0.13 0.41 0.07 0.20 0.35 0.08 0.22 0.21 0.28 0.32 0.28 0.29 0.26 Labor-Output Ratio 0.0013 0.0003 0.0002 0.0002 0.0002 0.0001 0.0005 0.0006 0.0002 0.0006 0.0006 0.0008 0.0010 0.0008 0.0002 0.0002 Land-Output Ratio 0.0123 0.0026 0.0025 0.0026 0.0034 0.0013 0.0064 0.0074 0.0029 0.0063 0.0100 0.0132 0.0076 0.0062 0.0023 0.0035 a- 306 pesos per day for labourer and 40,0000 pesos monthly for farm manager in Region III 250 pesos per day for labourer and 10200 pesos monthly for farm manager in Region IVA b- Volume of seed per square meter x area planted x price of seed per gram c- Total production in kilogram x 4 pesos in Region III and 2 pesos in Region IVA d- 0.65 pesos and 1.00 peso per square meter per year in Region III and IVA, respectively e- Straight line method, 10 present salvage value f- Fare or gasoline computed in proportion to total volume of vegetables delivered g- 10 present of cash cost, excluding farm rental and depreciation; used for fuel & oil, electricity, other supplies like molasses, etc. h- Total cost less contingency Marketing The marketing of organic vegetables in the CAR (Fig. 1) involves a complex chain of intermediaries as a result of the emergence of new breeds of traders from the traditional chain who oftentimes perform overlapping functions. The La Top (La Trinidad Organic Practitioners) Multi-Purpose Cooperative is at the forefront in the marketing of organic products
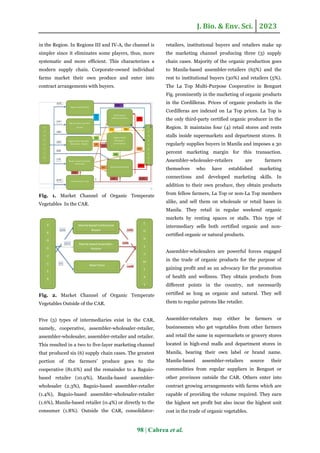
- 6. J. Bio. & Env. Sci. 2023 98 | Cabrea et al. in the Region. In Regions III and IV-A, the channel is simpler since it eliminates some players, thus, more systematic and more efficient. This characterizes a modern supply chain. Corporate-owned individual farms market their own produce and enter into contract arrangements with buyers. Fig. 1. Market Channel of Organic Temperate Vegetables In the CAR. Fig. 2. Market Channel of Organic Temperate Vegetables Outside of the CAR. Five (5) types of intermediaries exist in the CAR, namely, cooperative, assembler-wholesaler-retailer, assembler-wholesaler, assembler-retailer and retailer. This resulted in a two to five-layer marketing channel that produced six (6) supply chain cases. The greatest portion of the farmers’ produce goes to the cooperative (81.6%) and the remainder to a Baguio- based retailer (10.9%), Manila-based assembler- wholesaler (2.3%), Baguio-based assembler-retailer (1.4%), Baguio-based assembler-wholesaler-retailer (1.6%), Manila-based retailer (0.4%) or directly to the consumer (1.8%). Outside the CAR, consolidator- retailers, institutional buyers and retailers make up the marketing channel producing three (3) supply chain cases. Majority of the organic production goes to Manila-based assembler-retailers (65%) and the rest to institutional buyers (30%) and retailers (5%). The La Top Multi-Purpose Cooperative in Benguet Fig. prominently in the marketing of organic products in the Cordilleras. Prices of organic products in the Cordilleras are indexed on La Top prices. La Top is the only third-party certified organic producer in the Region. It maintains four (4) retail stores and rents stalls inside supermarkets and department stores. It regularly supplies buyers in Manila and imposes a 30 percent marketing margin for this transaction. Assembler-wholesaler-retailers are farmers themselves who have established marketing connections and developed marketing skills. In addition to their own produce, they obtain products from fellow farmers, La Top or non-La Top members alike, and sell them on wholesale or retail bases in Manila. They retail in regular weekend organic markets by renting spaces or stalls. This type of intermediary sells both certified organic and non- certified organic or natural products. Assembler-wholesalers are powerful forces engaged in the trade of organic products for the purpose of gaining profit and as an advocacy for the promotion of health and wellness. They obtain products from different points in the country, not necessarily certified as long as organic and natural. They sell them to regular patrons like retailer. Assembler-retailers may either be farmers or businessmen who get vegetables from other farmers and retail the same in supermarkets or grocery stores located in high-end malls and department stores in Manila, bearing their own label or brand name. Manila-based assembler-retailers source their commodities from regular suppliers in Benguet or other provinces outside the CAR. Others enter into contract growing arrangements with farms which are capable of providing the volume required. They earn the highest net profit but also incur the highest unit cost in the trade of organic vegetables.
- 7. J. Bio. & Env. Sci. 2023 99 | Cabrea et al. Retailers are businessmen who rent spaces in buildings or commercial areas where regular buyers go. They sell both certified and non-certified natural or organic products, in fresh or processed form. Baguio-based retailers incur the lowest unit cost for products sold while gaining maximum profit. It is the most efficient channel in the trade of organic vegetables in the CAR. Manila-based retailers are one-stop shops for organic and natural products, both local and imported, in fresh and processed forms. They also function as health and wellness stores or cafes offering only organic food in their menus. Institutional buyers are composed of hotels, restaurants and cancer clinics. Restaurants have entrees in their menu using only purely organic products as ingredients. Clinics, which cater to cancer patients or offer alternative medicine, order from suppliers in their behalf in specified kilogram packs mostly of herbs and vegetables which are known to have anti-oxidant properties. In the absence of cold chain facilities for the marketing of organic vegetables in the CAR, traders make use of cargo buses to transport their goods. This practice proved to be unfavourable and inefficient since it resulted to damages on the commodities. Profitability and Efficiency Based on Table 3, among the intermediaries selling organic temperate vegetables in the CAR, the cooperative has the lowest net profit per kilogram in the retail sale of vegetables (1.60 pesos) while the Baguio-based assembler retailer has the highest net profit (133.40 pesos) and also the highest unit cost (160.10 pesos). The retail store based in Baguio, on the other hand, incurs the lowest cost (1.50 pesos) in the trade of organic vegetables. Table 3. Profitability of organic temperate vegetable marketing in the CAR, by intermediary, per kilogram, 2012. Commodity Type of Intermediary Ave. Net Profit perkg. Ave. Unit Cost perkg. Net Profit- Cost Ratio Cooperative Baguio-based Retailer Baguio-based Assembler – wholesaler – Retailer Baguio-based Assembler – Retailer Manila-based Assembler- Wholesaler Manila-based Retailer Net Profit Unit Cost Net Profit Unit Cost Net Profit Unit Cost Net Profit Unit Cost Net Profit Unit Cost Net Profit Unit Cost W R W R W R W R Beans (Baguio/snap) 19.80 1.80 7.30 7.20 8.20 0.80 86.40 103.60 10.00 8.00 21.30 23.90 .89 Beans (French) 45.00 0.03 22.50 22.50 20.40 2.10 44.40 69.90 15.60 28.10 102.30 122.70 10.20 7.80 29.00 26.20 1.11 Broccoli 38.00 2.00 16.00 16.00 16.30 1.70 35.40 55.50 12.60 22.50 81.80 98.20 1.90 15.10 35.20 27.80 24.10 22.70 1.06 Cabbage 25.20 1.20 10.80 10.80 10.90 1.10 23.80 37.00 8.20 15.00 182.70 219.30 .30 2.70 3.30 2.70 29.40 31.50 0.94 Carrots 37.30 1.10 16.70 16.90 16.30 1.70 35.60 55.50 12.40 22.50 164.60 197.40 1.10 8.90 8.90 7.10 30.90 31.80 0.97 Cauliflower 39.80 3.80 14.20 14.20 16.30 1.70 35.50 55.50 12.50 22.50 164.60 197.40 6.30 50.70 35.20 27.80 35.20 39.30 0.90 Cucumber (Japanese) 164.60 197.40 164.70 197.40 0.83 Cucumber (other varieties) 37.10 1.10 16.90 16.90 16.30 1.70 35.50 55.50 12.50 22.50 11.10 8.90 14.00 8.30 1.68 Lettuce 31.30 1.30 13.70 13.70 13.60 1.40 29.40 46.30 10.60 18.70 173.70 208.40 5.20 3.80 34.30 35.10 0.98 Pechay (flowering) 24.70 0.70 11.30 11.30 13.60 1.40 68.20 81.80 3.60 2.40 17.20 19.40 0.89 Pechay (other varieties) 19.50 1.50 7.50 7.50 13.60 1.40 17.80 27.80 6.20 11.20 68.20 81.80 8.60 6.40 17.10 15.50 1.11 Potato 24.20 0.20 11.80 11.80 10.90 1.10 23.70 37.00 8.30 15.00 182.70 219.30 3.60 2.40 33.50 37.50 0.94 Spinach (Japanese) 31.00 1.00 14.00 14.00 13.60 1.40 173.70 208.40 4.80 38.20 29.10 22.90 37.00 45.70 0.78 Spinach (New Zealand) 32.50 2.50 12.50 12.50 13.60 1.40 20.60 46.30 10.40 18.70 173.70 208.40 4.80 38.20 19.50 15.50 32.50 36.80 0.88 Tomato (small /cherry) 37.90 1.90 16.10 16.10 16.30 1.70 35.50 55.50 12.50 22.50 50.00 60.00 26.90 21.00 21.50 17.30 1.24 Tomato (large) 34.30 4.30 10.70 10.70 164.60 197.40 31.90 25.10 50.20 58.30 0.86 Average 31.80 1.60 13.50 13.50 14.30 1.50 30.70 49.30 11.10 19.90- 133.40 160.10 3.20 25.60 16.20 12.60 37.00 40.40 Net Profit-Cost Ratio 2.36 0.12 9.53 2.77 2.48 0.83 0.125 1.29 The highest net profit (164.70 pesos) and highest unit cost (197.40 pesos) are computed for Japanese cucumber, across all intermediaries. The lowest net profit (14.00 pesos) and unit cost (8.30 pesos) per kilogram are obtained for the sale of native cucumber variety. Next to Japanese cucumber, large tomato (50.20 pesos), Japanese spinach (37.00 pesos), cauliflower (35.20 pesos) and lettuce (34.30 pesos) have high net profits. Large tomato (58.30 pesos), Japanese spinach (45.70 pesos), cauliflower (39.30 pesos, and New Zealand spinach (36.80 pesos), next to Japanese cucumber, entail high unit costs. As to efficiency, among the intermediaries, the retailer (9.53%) based in Baguio is the most efficient while the cooperative, as retailer (0.12%), and the Manila-based assembler-wholesaler (0.125%) are the least efficient based on low profit-cost ratios obtained. By commodity, the five (5) which have the highest profit-
- 8. J. Bio. & Env. Sci. 2023 100 | Cabrea et al. cost ratios are native cucumber (1.68%), cherry/small tomato (1.24%), French beans (1.11%), chingkang/ pakchoi pechay (1.11%) and broccoli (1.06%). Value chain and marketing margins Three marketing channels were analysed for value chain and marketing margins (Table 4a, 4b & 4c). The first channel is through the cooperative selling through its retail stores and to Manila-based institutional buyers. The cooperative earns higher from the latter realizing an average net profit of 56% of its margins. Highest margins are obtained for cauliflower (25.60 pesos) and lowest for chingkang/pakchoi pechay (12.00 pesos). The second channel involves the sale to Manila-based retailers where the cooperative realizes an average net margin of 66% slightly higher than what the retailer earns which averages 57%. Based on cost-margin ratios, the cooperative earns highest for large tomato and lowest for Baguio beans. The retailer earns more or less the same for all the vegetables under study. Highest margins are also obtained for cauliflower (75.00 pesos) and lowest for potato (27.80). The last channel involves the direct trade of vegetables by the farmer to Baguio-based assembler- wholesaler-retailer where the farmer gets 100 percent of the selling price. The trader earns more for wholesale than for retail since he incurs higher cost for the latter having to pay stall rental, licenses, permits and other marketing cost. Highest margins are obtained for French beans (54.30 pesos) and lowest for chingkang/pakchoi pechay (21.60 pesos). Table 4a. Selling price, costs andmarketing margins of organictemperatevegetablesintheCAR, 2012,Php/kg(Channel1*). Commodity Actors Farmer Cooperative (Retail) Cooperative (Wholesale) Selling Price Margins Cost Net Margins Selling Price Margins Cost Net Margins Total Net Margins Baguio beans Amount 51.00 60.00 9.00 7.20 1.80 78.00 18.00 7.30 10.70 12.50 Cost/Margin (%) 80.00 40.56 French beans Amount 127.50 150.00 22.50 22.50 0.00 195.00 45.00 22.50 22.50 22.50 Cost/Margin (%) 100.00 50.00 Broccoli Amount 102.00 120.00 18.00 16.00 2.00 156.00 36.00 16.00 20.00 22.00 Cost/Margin (%) 88.89 44.44 Cabbage Amount 68.00 80.00 12.00 10.80 1.20 104.00 24.00 10.80 13.20 14.40 Cost/Margin (%) 90.00 45.00 Carrots Amount 102.00 120.00 18.00 16.90 1.10 156.00 36.00 16.70 19.30 20.40 Cost/Margin (%) 93.89 46.39 Cauliflower Amount 102.00 120.00 18.00 14.20 3.80 156.00 36.00 14.20 21.80 25.60 Cost/Margin (%) 78.89 39.44 Cucumber-native Amount 102.00 120.00 18.00 16.90 1.10 156.00 36.00 16.90 19.10 20.20 Cost/Margin (%) 93.89 46.94 Lettuce Amount 85.00 100.00 15.00 13.70 1.30 130.00 30.00 13.70 16.30 17.60 Cost/Margin (%) 91.33 45.67 Flowering pechay Amount 68.00 80.00 12.00 11.30 0.70 104.00 24.00 11.30 12.70 13.40 Cost/Margin (%) 94.17 47.08 Chingkang/ Pakchoi Pechay Amount 51.00 60.00 9.00 7.50 1.50 78.00 18.00 7.50 10.50 12.00 Cost/Margin (%) 83.33 41.67 Potato Amount 68.00 80.00 12.00 11.80 0.20 104.00 24.00 11.80 12.20 12.40 Cost/Margin (%) 98.33 49.17 Japanese Spinach Amount 85.00 100.00 15.00 14.00 1.00 130.00 30.00 14.00 16.00 17.00 Cost/Margin (%) 93.33 46.67 New Zealand Spinach Amount 85.00 100.00 15.00 12.50 2.50 130.00 30.00 12.50 17.50 20.00 Cost/Margin (%) 83.33 41.67 Cherry Tomato Amount 102.00 120.00 18.00 16.10 1.90 156.00 36.00 16.10 19.90 21.80 Cost/Margin (%) 89.44 44.72 Large Tomato Amount 85.00 100.00 15.00 10.70 4.30 130.00 30.00 10.70 19.30 23.60 Cost/Margin (%) 71.33 35.67 *Traded by the Cooperative through its retail stores and to Manila-based institutional buyers Table4b.Sellingprice,costsandmarketingmarginsoforganictemperatevegetablesintheCAR,2012,Php/kg(Channel2*). Commodity Actors Farmer Cooperative (wholesale) Manila-based Retailer Selling Price Margins Cost Net Margins Selling Price Margins Cost Net Margins Total Net Margins Baguio beans Amount 51.00 78.00 27.00 7.30 19.70 96.00 18.00 8.00 10.00 29.70 Cost/Margin (%) 66.44 44.44 French beans Amount 127.50 195.00 67.50 22.50 45.00 213.00 18.00 7.80 10.20 55.20 Cost/Margin (%) 33.33 43.33 Broccoli Amount 102.00 156.00 54.00 16.00 38.00 219.00 63.00 27.80 35.20 73.20 Cost/Margin (%) 51.91 44.13 Cabbage Amount 68.00 104.00 36.00 10.80 25.20 110.00 6.00 2.70 3.30 28.50 Cost/Margin (%) 30.00 45.00 Carrots Amount 102.00 156.00 54.00 16.70 37.30 172.00 16.00 7.10 8.90 46.20
- 9. J. Bio. & Env. Sci. 2023 101 | Cabrea et al. Commodity Actors Farmer Cooperative (wholesale) Manila-based Retailer Selling Price Margins Cost Net Margins Selling Price Margins Cost Net Margins Total Net Margins Cost/Margin (%) 30.92 44.38 Cauliflower Amount 102.00 156.00 54.00 14.20 39.80 219.00 63.00 27.80 35.20 75.00 Cost/Margin (%) 26.30 44.13 Cucumber- native Amount 102.00 156.00 54.00 16.90 37.10 176.00 20.00 8.90 11.10 48.20 Cost/Margin (%) 31.30 44.50 Lettuce Amount 85.00 130.00 45.00 13.70 31.30 139.00 9.00 3.80 5.20 36.50 Cost/Margin (%) 30.44 42.00 Flowering pechay Amount 68.00 104.00 36.00 11.30 24.70 110.00 6.00 2.40 3.60 28.30 Cost/Margin (%) 31.39 40.00 Chingkang/ Pakchoi Pechay Amount 51.00 78.00 27.00 7.50 19.50 93.00 15.00 6.40 8.60 28.10 Cost/Margin (%) 27.78 42.67 Potato Amount 68.00 104.00 36.00 11.80 24.20 110.00 6.00 2.40 3.60 27.80 Cost/Margin (%) 32.78 40.00 Japanese Spinach Amount 85.00 130.00 45.00 14.00 31.00 182.00 52.00 22.90 29.10 60.10 Cost/Margin (%) 31.11 44.04 New Zealand Spinach Amount 85.00 130.00 45.00 12.50 32.50 165.00 35.00 15.50 19.50 52.00 Cost/Margin (%) 27.78 44.29 Cherry Tomato Amount 102.00 156.00 54.00 16.10 37.90 204.00 48.00 21.10 26.90 64.80 Cost/Margin (%) 29.81 43.96 Large Tomato Amount 85.00 130.00 45.00 10.70 34.30 187.00 57.00 25.10 31.90 66.20 Cost/Margin (%) 23.78 44.04 *Traded by the Cooperative to Manila-based retailers Table 4c. Sellingprice, costsandmarketing margins of organic temperatevegetablesin the CAR,2012, Php/kg (Channel 3*). Commodity Actors Farmer Baguio-based wholesaler Baguio-based retailer Selling Price Margin s Cost Net Margins Selling Price Margins Cost Net Margins Total Net Margins French beans Amount 150.00 210.00 60.00 15.60 44.40 248.00 38.00 28.10 9.90 54.30 Cost/Margin (%) 26.00 73.95 Broccoli Amount 120.00 168.00 48.00 12.60 35.40 198.00 30.00 22.50 7.50 42.90 Cost/Margin (%) 26.25 75.00 Cabbage Amount 80.00 112.00 32.00 8.20 23.80 132.00 20.00 15.00 5.00 28.80 Cost/Margin (%) 25.62 75.00 Carrots Amount 120.00 168.00 48.00 12.40 35.60 198.00 30.00 22.50 7.50 43.10 Cost/Margin (%) 25.83 75.00 Cauliflower Amount 120.00 168.00 48.00 12.50 35.50 198.00 30.00 22.50 7.50 43.00 Cost/Margin (%) 26.04 75.00 Cucumber-native Amount 120.00 168.00 48.00 12.50 35.50 198.00 30.00 22.50 7.50 43.00 Cost/Margin (%) 26.04 75.00 Lettuce Amount 100.00 140.00 40.00 10.60 29.40 165.00 25.00 18.70 6.30 35.70 Cost/Margin (%) 26.50 74.80 Chingkang/ Pakchoi Pechay Amount 60.00 84.00 24.00 6.20 17.80 99.00 15.00 11.20 3.80 21.60 Cost/Margin (%) 25.83 74.67 Potato Amount 80.00 112.00 32.00 8.30 23.70 132.00 20.00 15.00 5.00 28.70 Cost/Margin (%) 25.94 75.00 New Zealand Spinach Amount 100.00 140.00 40.00 10.40 29.60 165.00 25.00 18.70 6.30 35.90 Cost/Margin (%) 26.00 74.80 Cherry Tomato Amount 120.00 168.00 48.00 12.50 35.50 198.00 30.00 22.50 7.50 43.00 Cost/Margin (%) 26.04 75.00 *Traded by Cooperative member-farmers to Baguio-based assembler-wholesaler-retailer. Conclusion The organic vegetable industry continues to register positive growth in terms of production area and number of practitioners as a result of the implementation of the Organic Agriculture Act of 2010. Though marketing associations and cooperatives continue to play a major role in the industry, big corporations engaged in production and marketing play a vital part in driving the chain. Organic temperate vegetable production is profitable and efficient. In the CAR, returns to total expenses and net profits are high for native cucumber, cauliflower, Japanese spinach, broccoli, French beans and lettuce. Capital, labor and land utilization ratios are low for the aforesaid vegetables in addition to cabbage. In Regions III and IV-A, returns to total expenses and net profits are high for cauliflower, lettuce (romaine/xanadu and lollo rossa varieties), broccoli, cabbage and French beans. Capitalization, labor and land utilization are also low for these vegetables indicating efficiency of production. Because, organic temperate vegetable production is profitable and efficient, more will be encouraged to go into or expand organic production. This is feasible given that production is yet to be optimized in terms of production area and the available unutilized area. The emergence of new breeds of players makes the marketing channel of organic vegetables in the Cordilleras complex compared with a simpler and
- 10. J. Bio. & Env. Sci. 2023 102 | Cabrea et al. more modern and integrated chain in the Regions outside of the CAR. In the CAR, Baguio-based retailers are the most efficient channel because they incur the least cost. While assembler-retailers who obtain concessions in supermarkets inside malls and department stores to sell their own brand of organic products imposed the highest price and earned the highest net profit, they also incur the highest cost. Across intermediaries, Japanese cucumber, large tomato, Japanese spinach, cauliflower and lettuce have the highest net profits while those which have highest net profit-cost ratios are native cucumber, cherry/small tomato, French beans,chingkang/ pakchoi pechay and broccoli. The three marketing channels considered for value chain and marketing margin analyses show cost and margin differentials across players and across locations indicating variations in the distribution of benefits among key actors. The cooperative has higher gross and net margins for products sold to Manila buyers than those retailed in Baguio while incurring the same cost for both. Manila-based retailers have lower gross margins compared to wholesalers in Baguio however; costs are more less the same. Traders who perform both wholesale and retail functions realize higher net margins for retail although they incur higher costs and impose higher margins. Marketing efficiency, product quality and marketing margins are compromised because of the absence of favourable transport facilities. Cold chain facilities need to be established. The production of organic temperate vegetables in the Philippines has its strengths and weaknesses (Appendix A). Though best practices had been noted, there is a need to improve the efficiency of some elements of production, processing, handling, distribution and marketing to make farmers’ income better and make the industry competitive and sustainable. Acknowledgement The author wholeheartedly acknowledges the financial support of the Department of Agriculture- Bureau of Agricultural Research (DA-BAR) and the much appreciated support of the Don Mariano Marcos Memorial State University in the completion of this research. Special acknowledgement and recognition for the invaluable contribution of Dr. Diego A. Waguey (+), co-author of this research. Gratitude is also extended to all the respondents, key informants and the many kind souls who provided significant assistance in the conduct of this research. References Argan MT. 2008. The factors related to organic food consumption and healthy lifestyles: A study of Turkish consumers. SEER: Journal for Labour and Social Affairs in Eastern Europe 10, 121-135. https://www.jstor.org/ stable/43293256 Retrieved 1 February 2014 Canono J. 2000. Philippine Organic Products: Organics Market Brief. A Global Agriculture Information Network Report No. RP 0015, USDA-FAS. Clemente JM. 2011. Organic farming is the way to go, says Aquino on food security. Inquirer Central Luzon. Digal LN. 2004. The Case of the Philippines: Regoverning Markets, Securing Small Producer Participation in Restructured National and Regional Agri-food Systems. http://www.regoverningmarkets .org/en/resources/china/china_country_report_200 4/ Retrieved 24 June 2014 Fang-asanm L. 2008. Lettuce supply chains and marketingmarginsinBenguet,Philippines.Banwa6,32-42. IFOAM. 2014. Brief Overview of Organic Farming. http://www.intracen.org/Organics/ Country-Profile- Philippines.html Johnson GI. 2008. The Vegetable Industry in Tropical Asia: The Philippines, An Overview of Production and Trade http://www.avrdc.org. Retrieved 11 September 2012. Macabasco DR. 2008. Agri-Food Trade Service: The Philippine Vegetable Industry. http://www. ats.agr.gc.ca/ase/4557-eng.htm. Retrieved 25 November 2014
- 11. J. Bio. & Env. Sci. 2023 103 | Cabrea et al. Nemes N. 2009. Comparative Analysis of Organic and Non-organic Farming Systems: A Critical Assessment of Farm Profitability. Food and Agriculture Organization of the United Nations. Organization for Economic Cooperation and Development. 2011. Greening Household Behaviour: The Role of Public Policy https://www. oecd.org/env/consumption-innovation/47234579.pdf Retrieved 4 April 2014 Pearl. 2004. Global Market for Organic Products. State of the Sector Report on Philippine Organic and Natural Products. Pearl. 2006. Global Market for Organic Products. State of the Sector Report on Philippine Organic and Natural Products. Polomo JM. 2015. Japanese technology boosts organic farming in Benguet. Rappler https://r3.rappler.com/ science-nature/environment-japanese-technology - organic-farming-benguet. Retrieved 5 May 2015. Porciuncula FL, Galang LM, Parayno RS. 2014. Going organic: Understanding the organic vegetable production environment in Central Luzon, Philippines. International Journal of Scientific and Technology Research 3, 81-91. Salazar RC. 2014. Going organic in the Philippines. social and institutional features. Agroecology and Sustainable Food Systems 38, 199-229. Salin V. 2000. Information technology and cattle- beef supply chains. American Journal of Agricultural Economics 82(5), 1105-1111. Sarmiento GR. 2007. Organic Agriculture in the Philippines, A Country Report. Regional Conference on Organic Agriculture in Asia. Bangkok, Thailand. Talaveramg. 2008. Understanding supply chain management and its applicability in the Philippines. Philippine Management Review 15. Van Roekel JW, Willems S. Boselie DM. 2002. Agri-supply Chain Management to Stimulate Cross Border Trade in Developing Countries and Emerging Economies. World Bank Paper Cross-Border Agri Supply Chain Management. http://siteresources. worldbank.org/INTARD/825826-1111044795683 /20424530/ Agri Supply Chain Mang_finalversion.pdf Retrieved 4 April 2015 Appendix A. Practices and challenges of organic temperate vegetable production Areas of concern Practices/Challenges Input supply Technologies for the production of sustainable, certified inputs still need to be developed, improved and standardized and make farmer’s access to these technologies and resources greater. This is to reduce cost, increase production and improve income. Production Improving crop resiliency and adoption of mitigation measures to address climate change which affects production could be done through intensified and integrated capability building mechanisms for organic farmers The cooperative need to implement a planting calendar for its members to follow in order to address high rate of spoilage and pull-out as a result of overproduction during particular months. There is an imminent need for the Cooperative to go into value-adding activities like vegetable processing to minimize the high rate of spoilage or pull-out during months when there is oversupply. Marketing Prices of organic products in the CAR are not affected by supply and demand forces as these are dictated by the Cooperative which are stable for a period of one year. Outside of the CAR, the contract growing arrangement between producers and traders make prices stable as long as the contract is in full force. The practice of assemblers/ consolidator/integrators to obtain products from different sources results to a co-mingling of certified and non-certified organic products in the market. Retailers of organic products in Metro Manila have emerged into one-stop shops that sell all kinds and forms of organic and natural products and double as cafes/restaurants serving healthy food items The efficiency and profitability of the marketing function (retail) of the cooperative could be improved by instituting value adding activities and by establishing a temperature control system in its retail stores to extend shelf-life.