


Progressive 2Q04 QSR
- 1. THE PROGRESSIVE CORPORATION 2004 SECOND QUARTER REPORT
- 2. The Progressive Corporation and Subsidiaries 2004 Quarterly Report Financial Highlights (unaudited) Six months ended June 30, Years ended December 31, (billions - except per share amounts) 2004 2003 2003 2002 2001 2000 Net premiums written $6.6 $5.9 $11.9 $9.5 $7.3 $6.2 Growth over prior period 12% 29% 26% 30% 17% 1% Net premiums earned $6.3 $5.4 $11.3 $8.9 $7.2 $6.3 Growth over prior period 18% 31% 28% 24% 13% 12% Total revenues $6.6 $5.6 $11.9 $9.3 $7.5 $6.8 Net income $.8 $.6 $1.26 $.67 $.41 $.05 Underwriting margin 15.7% 12.2% 12.7% 7.6% 4.8% (4.4)% Net income per share - diluted $3.85 $2.61 $5.69 $2.99 $1.83 $.21 (billions - except shares outstanding and per share amounts) At Period-End Common Shares outstanding 217.3 217.4 216.4 218.0 220.3 220.6 (millions) Book value per share $26.33 $20.15 $23.25 $17.28 $14.76 $13.01 Consolidated shareholders' equity $5.7 $4.4 $5.0 $3.8 $3.3 $2.9 Market capitalization $18.5 $15.9 $18.1 $10.8 $11.0 $7.6 Return on average shareholders’ equity 29.0% 26.3% 29.1% 19.3% 13.5% 1.7% 1 Stock Price Appreciation (Depreciation) Progressive 2.1% 47.4% 68.7% (.1)% 44.1% 42.3% S&P 500 3.4% 11.7% 28.6% (22.0)% (11.8)% (9.1)% 1 Represents average annual compounded rate of increase (decrease); assumes dividend reinvestment. 1
- 3. The Progressive Corporation and Subsidiaries Letter to Shareholders Excellent profitability, solid but slowing growth, and tremendous progress on service initiatives characterize a very satisfying 2nd quarter. For the quarter, our combined ratio was 85.4 with net premiums written growth of 11%. Our year-to-date combined ratio of 84.3 is substantially better than our estimates of the dramatically improving industry average (for the 1st quarter, the industry reported combined ratio was 94.2). Our results, along with the rest of the industry, have benefited from the continuing low frequency of reported claims. Frequency rates are lower than comparable 2003 quarterly and annual periods on all our coverages. An expected outcome is that rate inflation is very low. As a result, consumers are experiencing rates that are stable or possibly lower at renewal. This translates into fewer consumers actively shopping for a better rate. Under these market conditions of less shopping combined with increased marketing intensity from profitable competition, we expect that our growth in new business will slow. Contributing to profitability and rate stability are relatively modest trends in severity of losses. Our observed bodily injury severity trend for personal auto is within a 2-5% annualized range and our physical damage severity trend is closer to flat. As market conditions change, and the so-called insurance cycle goes from “hard” to “soft,” one thing remains constant – the best service at the lowest price is a winning formula. I have every expectation that we can outperform the market on growth, as well as profitability, in each phase of the cycle if we continue to improve and solidify our delivery of faster, fairer, better customer experiences at lower costs. We have made some meaningful progress in the first half of 2004 that we believe has kept us on course toward our goal of becoming Consumers’ #1 Choice for Auto Insurance. Our intensity on claims management continues to produce meaningful improvements in the quality of claims handling. We are in control with staffing and training and will use this expected somewhat slower period of hiring to solidify our gains and expand our training in preparation for faster growth that we believe we will see in the future. Our initiative to change physical damage claims handling with our concierge level of claims service has had a very good first six months. The key operating specifications we established for expansion of the concept are now consistently being met. We are ready for the next phase of expansion and are currently looking to establish four more service centers in Florida. In addition, we are actively scouting locations in four other states. Our customer service group has completed a restructuring into three aligned groups: agency customers, direct customers and independent agents and brokers. This restructuring will better serve the unique needs of each group and allow even more opportunity for targeted improvements and efficiencies. In addition, we are moving forward with creating a brand communication strategy for our independent agencies and their customers. On a note of interest, I’m excited to report that Progressive is now the #1 writer of auto insurance in Rhode Island and Vermont. (We are working hard to achieve the same results in other states). Also, we are in discussions with New Jersey about the regulatory environment that would be required for Progressive to show interest in doing business there. At this time, we have no sense whether or not the changes necessary to interest us in writing in that state will be embraced. 2
- 4. Our overarching objectives going into the second half of 2004 are to maintain momentum by continuing to seek new business growth when it is smart to do so, increasing policy retention, intensifying the energy around our key strategies, focusing on training at all levels to take full advantage of new tools and processes, and constantly positioning ourselves for the next set of market conditions that will favor faster growth. While pleased with our results and accomplishments so far this year, I’m confident that we have only partially executed some of our most exciting strategies and that the best is still ahead of us. Glenn M. Renwick President and Chief Executive Officer 3
- 5. The Progressive Corporation and Subsidiaries Consolidated Statements of Income (unaudited) Three Months Six Months % % Periods Ended June 30, 2004 2003 Change 2004 2003 Change (millions – except per share amounts) Revenues: Net premiums earned $3,234.0 $2,774.9 17 $6,327.5 $5,373.2 18 Investment income 124.7 112.5 11 239.6 228.5 5 Net realized gains (losses) on securities (3.4) 23.1 NM 56.1 20.0 181 Service revenues 11.9 10.5 13 24.5 19.3 27 Other income (expense) .2 -- NM -- -- -- Total revenues 3,367.4 2,921.0 15 6,647.7 5,641.0 18 Expenses: Losses and loss adjustment expenses 2,090.7 1,920.3 9 4,052.8 3,653.8 11 Policy acquisition costs 348.3 306.6 14 682.3 594.3 15 Other underwriting expenses 324.2 236.5 37 600.4 468.7 28 Investment expenses 2.9 2.3 26 6.2 5.6 11 Service expenses 6.6 6.8 (3) 12.1 12.7 (5) Interest expense 19.7 23.7 (17) 40.2 47.8 (16) Total expenses 2,792.4 2,496.2 12 5,394.0 4,782.9 13 Income before income taxes 575.0 424.8 35 1,253.7 858.1 46 Provision for income taxes 188.7 138.5 36 407.4 280.3 45 Net income $386.3 $286.3 35 $846.3 $577.8 46 COMPUTATION OF EARNINGS PER SHARE Basic: Average shares outstanding 216.3 217.6 (1) 216.4 217.8 (1) Per share $1.79 $1.32 36 $3.91 $2.65 47 Diluted: Average shares outstanding 216.3 217.6 (1) 216.4 217.8 (1) Net effect of dilutive stock-based compensation 3.5 3.9 (10) 3.5 3.7 (5) Total equivalent shares 219.8 221.5 (1) 219.9 221.5 (1) Per share $1.76 $1.29 36 $3.85 $2.61 48 $.025 $.025 -- $.050 $.050 -- Dividends per Share NM = Not Meaningful See notes to consolidated financial statements. 4
- 6. The Progressive Corporation and Subsidiaries Consolidated Balance Sheets (unaudited) June 30, December 31, 2004 2003 2003 (millions) (audited) Assets Investments: Available-for-sale: Fixed maturities, at market (amortized cost: $9,651.3, $7,760.8 and $8,899.0) $9,679.4 $8,108.7 $9,133.4 Equity securities, at market Preferred stocks (cost: $846.6, $773.7 and $751.3) 846.7 813.4 778.8 Common equities (cost: $1,601.8, $1,591.3 and $1,590.6) 2,026.8 1,719.4 1,972.1 Short-term investments, at amortized cost (market: $1,114.8, $1,123.6 and $648.0) 1,114.8 1,123.6 648.0 Total investments 13,667.7 11,765.1 12,532.3 Cash 22.0 17.9 12.1 Accrued investment income 101.6 82.4 97.4 Premiums receivable, net of allowance for doubtful accounts of $63.8, $55.7 and $66.8 2,322.6 2,045.0 2,079.6 Reinsurance recoverables, including $41.0, $36.1 and $41.4 on paid losses 286.0 241.9 271.3 Prepaid reinsurance premiums 129.3 116.6 114.7 Deferred acquisition costs 449.8 418.7 412.3 Income taxes -- 26.2 81.6 Property and equipment, net of accumulated depreciation of $513.1, $433.8 and $476.4 647.9 525.4 584.7 Other assets 89.8 62.1 95.5 Total assets $17,716.7 $15,301.3 $16,281.5 Liabilities and Shareholders' Equity Unearned premiums $4,220.7 $3,853.1 $ 3,894.7 Loss and loss adjustment expense reserves 4,925.0 4,152.1 4,576.3 Accounts payable, accrued expenses and other liabilities 1,507.4 1,426.1 1,290.1 Income taxes 52.4 -- -- Debt 1,290.0 1,489.4 1,489.8 Total liabilities 11,995.5 10,920.7 11,250.9 Shareholders' equity: Common Shares, $1.00 par value (authorized 600.0, issued 230.1, including treasury shares of 12.8, 12.7 and 13.7) 217.3 217.4 216.4 Paid-in capital 777.3 674.5 688.3 Unamortized restricted stock (58.4) (33.1) (28.9) Accumulated other comprehensive income (loss): Net unrealized appreciation on investment securities 294.6 335.2 418.2 Net unrealized gains on forecasted transactions 10.2 11.2 10.7 Foreign currency translation adjustment (3.9) (4.8) (3.9) Retained earnings 4,484.1 3,180.2 3,729.8 Total shareholders' equity 5,721.2 4,380.6 5,030.6 Total liabilities and shareholders' equity $17,716.7 $15,301.3 $16,281.5 See notes to consolidated financial statements. 5
- 7. The Progressive Corporation and Subsidiaries Consolidated Statements of Cash Flows (unaudited) Six Months Ended June 30, 2004 2003 (millions) Cash Flows From Operating Activities Net income $846.3 $577.8 Adjustments to reconcile net income to net cash provided by operating activities: Depreciation 46.6 41.7 Amortization of fixed maturities 84.2 39.2 Amortization of restricted stock 11.6 3.1 Net realized (gains) losses on securities (56.1) (20.0) Changes in: Unearned premiums 326.0 548.8 Loss and loss adjustment expense reserves 348.7 339.1 Accounts payable, accrued expenses and other liabilities 173.1 90.0 Prepaid reinsurance premiums (14.6) (19.9) Reinsurance recoverables (14.7) (26.2) Premiums receivable (243.0) (302.2) Deferred acquisition costs (37.5) (55.2) Income taxes 200.6 100.0 Tax benefit from exercise/vesting of stock-based compensation 29.0 28.6 Other, net 6.8 (24.0) Net cash provided by operating activities 1,707.0 1,320.8 Cash Flows From Investing Activities Purchases: Available-for-sale: fixed maturities (3,430.5) (5,183.4) equity securities (464.4) (554.4) Sales: Available-for-sale: fixed maturities 2,283.2 4,518.8 equity securities 317.0 191.1 Maturities, paydowns, calls and other: Available-for-sale: fixed maturities 357.8 340.7 equity securities 50.0 8.8 Net purchases of short-term investments (466.8) (555.8) Net unsettled security transactions 32.0 146.0 Purchases of property and equipment (115.0) (64.1) Net cash used in investing activities (1,436.7) (1,152.3) Cash Flows From Financing Activities Proceeds from exercise of stock options 36.4 36.3 Payment of debt (200.0) -- Dividends paid to shareholders (10.8) (10.9) Acquisition of treasury shares (86.0) (192.9) Net cash used in financing activities (260.4) (167.5) Increase in cash 9.9 1.0 Cash, January 1 12.1 16.9 Cash, June 30 $22.0 $17.9 See notes to consolidated financial statements. 6
- 8. The Progressive Corporation and Subsidiaries Notes to Consolidated Financial Statements (unaudited) Note 1 Basis of Presentation -- These financial statements and the notes thereto should be read in conjunction with the Company’s audited financial statements and accompanying notes included in its Annual Report on Form 10-K for the year ended December 31, 2003. The consolidated financial statements reflect all normal recurring adjustments which were, in the opinion of management, necessary for a fair statement of the results for the interim periods presented. The results of operations for the period ended June 30, 2004, are not necessarily indicative of the results expected for the full year. Note 2 Stock-Based Compensation -- The Company follows the provisions of Statement of Financial Accounting Standards (SFAS) 123, “Accounting for Stock-Based Compensation,” to account for its stock compensation activity in the financial statements. Prior to January 1, 2003, the Company followed the provisions of Accounting Principles Board (APB) Opinion No. 25, “Accounting for Stock Issued to Employees,” to account for its stock option activity. The change to the fair value method of accounting was applied prospectively to all non-qualified stock option awards granted, modified, or settled after January 1, 2003. No stock options were granted after December 31, 2002. As a result, there is no compensation cost for stock options included in net income for 2003 or 2004; however, compensation expense would have been recognized if the fair value method had been used for all awards since the original effective date of SFAS 123 (January 1, 1995). Prior to 2003, the Company granted all options currently outstanding at an exercise price equal to the market price of the Company’s Common Shares at the date of grant and therefore, under APB 25, no compensation expense was recorded. In 2003, the Company began issuing restricted stock awards. Compensation expense for restricted stock awards is recognized over their respective vesting periods. The current year expense is not representative of the effect on net income for future years since each subsequent year will reflect expense for additional awards. See Item 5-Other Information in Part II of the Company’s Form 10-Q for the quarterly period ended March 31, 2004, for details regarding the restricted stock awards granted by the Company during the first quarter of 2004. The following table is presented in accordance with SFAS 148, “Accounting for Stock-Based Compensation – Transition and Disclosure,” and shows the effects on net income and earnings per share had the fair value method been applied to all outstanding and unvested stock option awards for the periods presented. The Company used the Black-Scholes pricing model to calculate the fair value of the options awarded as of the date of grant. 7
- 9. (millions, except per share amounts) Six months ended June 30, 2004 2003 Net income, as reported $846.3 $577.8 Deduct: Total stock-based employee compensation expense determined under the fair value based method for all awards, net of related tax effects (2.9) (7.7) Net income, pro forma $843.4 $570.1 Earnings per share Basic – as reported $3.91 $2.65 Basic – pro forma $3.90 $2.62 Diluted – as reported $3.85 $2.61 Diluted – pro forma $3.85 $2.58 Note 3 Supplemental Cash Flow Information -- The Company paid income taxes of $239.0 million and $154.0 million during the six months ended June 30, 2004 and 2003, respectively. Total interest paid was $49.2 million and $49.9 million during the six months ended June 30, 2004 and 2003, respectively. Note 4 Debt -- Debt at June 30 consisted of: (millions) 2004 2003 Market Market Cost Value Cost Value 6.60% Notes due 2004 $-- $-- $199.9 $205.3 7.30% Notes due 2006 99.9 107.7 99.8 113.2 6.375% Senior Notes due 2012 347.6 376.7 347.4 397.2 7% Notes due 2013 148.8 167.4 148.8 178.5 6 5/8% Senior Notes due 2029 294.1 302.2 294.0 317.5 6.25% Senior Notes due 2032 393.6 390.4 393.5 448.4 Other Debt 6.0 6.0 6.0 6.0 $1,290.0 $1,350.4 $1,489.4 $1,666.1 Note 5 Comprehensive Income -- Total comprehensive income was $212.1 million and $487.2 million for the quarters ended June 30, 2004 and 2003, respectively, and $722.2 million and $750.1 million for the six months ended June 30, 2004 and 2003, respectively. Note 6 Dividends -- On June 30, 2004, the Company paid a quarterly dividend of $.025 per Common Share to shareholders of record as of the close of business on June 11, 2004. The Board of Directors declared the dividend on April 16, 2004. Note 7 Segment Information -- The Company’s Personal Lines business units write insurance for private passenger automobiles and recreation vehicles. The Commercial Auto business unit writes primary liability, physical damage and other auto-related insurance for automobiles and trucks owned by small businesses. The Company’s other businesses principally include directors’ and officers’ liability insurance and processing business for Commercial Auto Insurance Procedures (CAIP), which are state-supervised plans serving the involuntary market. The “other businesses” also manage the run-off from discontinued product lines. All revenues are generated from external customers. 8
- 10. Periods ended June 30, (millions) Three Months Six Months 2004 2003 2004 2003 Pretax Pretax Pretax Pretax Profit Profit Profit Profit Revenues (Loss) Revenues (Loss) Revenues (Loss) Revenues (Loss) Personal Lines - Agency $1,945.9 $273.2 $1,705.1 $179.0 $3,817.3 $567.7 $3,305.6 $388.8 Personal Lines - Direct 909.6 128.6 755.7 78.2 1,775.5 267.3 1,462.8 172.0 Total Personal Lines1 2,855.5 401.8 2,460.8 257.2 5,592.8 835.0 4,768.4 560.8 Commercial Auto Business 370.4 71.0 295.6 51.3 717.2 158.8 568.3 94.9 Other businesses2 20.2 3.5 29.0 6.7 42.0 10.6 55.8 7.3 Investments3 121.3 118.4 135.6 133.3 295.7 289.5 248.5 242.9 Interest expense -- (19.7) -- (23.7) -- (40.2) -- (47.8) $3,367.4 $575.0 $2,921.0 $424.8 $6,647.7 $1,253.7 $5,641.0 $858.1 1Personal automobile insurance accounted for 93% of the total Personal Lines segment net premiums earned in all periods presented. 2Includes both other indemnity businesses as well as the Company’s service business operations. For the three months ended June 30, 2004, both revenues and pretax profit include $.2 million of additional interest received during the second quarter on an income tax refund the Company received in February 2004. 3Revenues represent recurring investment income and net realized gains (losses) on securities; pretax profit is net of investment expenses. Note 8 Litigation -- The Company is named as defendant in various lawsuits arising out of its insurance operations. All legal actions relating to claims made under insurance policies are considered by the Company in establishing its loss and loss adjustment expense reserves. In addition, the Company is named as defendant in a number of class action or individual lawsuits, the outcomes of which are uncertain at this time. These cases include those alleging damages as a result of the Company’s total loss evaluation methodology, use of after-market parts, use of consumer reports (such as credit reports) in underwriting and related notice requirements under the federal Fair Credit Reporting Act, charging betterment in first party physical damage claims, the adjusting of personal injury protection and medical payment claims, the use of preferred provider rates for payment of personal injury protection claims, the use of automated database vendors to assist in evaluating certain first party bodily injury claims, offering alternative commission programs or the alleged diminution of value to vehicles which are involved in accidents, and cases challenging other aspects of the Company’s claims and marketing practices and business operations, including worker classification issues. The Company plans to contest the outstanding suits vigorously, but may pursue settlement negotiations in appropriate cases. In accordance with generally accepted accounting principles (GAAP), the Company has established accruals for lawsuits as to which the Company has determined that it is probable that a loss has been incurred and the Company can reasonably estimate its potential exposure. Pursuant to GAAP, the Company has not established reserves for those lawsuits where the loss is not probable and/or the Company is currently unable to estimate the potential exposure. If any one or more of these lawsuits results in a judgment against or settlement by the Company in an amount that is significantly in excess of the reserve established for such lawsuit (if any), the resulting liability could have a material impact on the Company’s financial condition, cash flows and results of operations. For further discussion on the Company’s pending litigation, see Item 3-Legal Proceedings in the Company’s Annual Report on Form 10-K for the year ended December 31, 2003. Note 9 Reclassifications -- Certain amounts in the financial statements for prior periods were classified to conform to the 2004 presentation. 9
- 11. Management's Discussion and Analysis of Financial Condition and Results of Operations. OVERVIEW The Progressive Corporation and subsidiaries (the “Company”) continued the success achieved in 2003 through the second quarter of 2004, with an 11% increase in net premiums written, an underwriting profit margin of 14.6% and net income of $386.3 million for the quarter. All areas of the Company continued to function well, especially product pricing and claims resolution, as highlighted in the Company’s 2003 Annual Report to Shareholders. On the other hand, market conditions continue to change and most of the Company’s competitors now have rates that appear to be consistent with their profit objectives. As a result, consumers are not being dislocated by rate or underwriting shocks, thereby negatively impacting the number of new applications the Company is receiving. The Company, along with the rest of the industry, continued to benefit from the low level of automobile accident frequency during the quarter. At June 30, 2004, the Company had 8.8 million policies in force on a companywide basis, 14% more than at the same time last year. This growth was primarily supported by strong renewals. The Company’s measure of the average policy life expectancy for its personal auto business was slightly higher in the second quarter 2004, as compared to the first quarter 2004, but lower than the second quarter last year. The Company is continuing to refine its measurement and methodology with regards to retention. Given its continued strong underwriting margins, the Company remains in a position where it can focus on retaining customers and introduce new product improvements faster. The Company experienced favorable reserve development of 1.1 points for the second quarter and .2 points for the first six months of 2004. The Company continued to experience a decline in accident frequency in every coverage on a quarter over prior year quarter basis. In addition, the Company has continued to maintain solid claims hiring and training and, as a result, has not had to restrict growth in any state due to a lack of claims capacity. Based on these ongoing trends, the Company will continue to assess market conditions on a state-by-state basis and will consider, and has taken, some rate reductions in selected states to maintain attractive combinations of profit and growth. In the short term, the Company’s strategy is to maintain rate stability, with some margin reduction by absorbing future cost trends. The Company remains focused on building sustainable competitive advantages while providing longer-term price stability for customers. The Company made no substantial changes in the allocation of its investment portfolio during the quarter. Overall, the total portfolio had a negative return for the second quarter, driven by a negative return in the fixed-income securities (primarily due to the recent rise in interest rates) partially offset by positive total returns in the common stock portfolio. Year-to-date, both the fixed-income and common stock portfolios generated positive total returns. The Company continued to keep its credit quality high and exposure to interest rate risk low. At June 30, 2004, the fixed-income portfolio duration was 3.0 years with a weighted average credit quality of AA. FINANCIAL CONDITION Capital Resources and Liquidity Progressive's insurance operations create liquidity by collecting and investing premiums written from new and renewal business in advance of paying claims. For the six months ended June 30, 2004, operations generated positive cash flows of $1.7 billion. During the first quarter 2004, the Company retired all $200 million of its 6.60% Notes at their maturity using part of the proceeds from the $400 million of its 6.25% Senior Notes issued in November 2002; the remainder of the proceeds from that offering are available for general corporate purposes. 10
- 12. During the second quarter 2004, the Company entered into an uncommitted line of credit with National City Bank in the principal amount of $100 million. The Company entered into the line of credit as part of a contingency plan to help the Company maintain liquidity in the unlikely event that it experiences conditions or circumstances that affect the Company’s ability to transfer or receive funds. The Company had no borrowings under this arrangement at June 30, 2004. The Company has substantial capital resources and believes it has sufficient borrowing capacity and other capital resources to support current and anticipated growth and scheduled principal and interest payments. The Company’s existing debt covenants do not include any rating or credit triggers. Commitments and Contingencies The Company is currently constructing a call center in Tampa, Florida and an office building in Mayfield Village, Ohio. These projects are expected to be completed during the second half of 2004. In addition, construction was completed in the second quarter 2004 on a call center in Colorado Springs, Colorado. The total cost for these three projects is estimated to be $128 million. These projects are being funded through operating cash flows. In addition, during the first quarter 2004, the Company opened one additional claims service center, bringing the total number of sites offering this concierge level of service to 20; no sites were added during the second quarter. The Company plans to add additional sites at the appropriate times and locations based on internal analysis of the operating performance and cost parameters of the existing sites. The Company is currently looking to establish four additional claims service centers in Florida and is actively searching for similar sites in four other states. Off-Balance-Sheet Arrangements Except for the open investment funding commitment and operating leases and service agreements discussed in the notes to the financial statements in the Company’s Annual Report on Form 10-K for the year ended December 31, 2003, the Company does not have any off-balance-sheet arrangements. Contractual Obligations During the second quarter 2004, the Company’s contractual obligations have not changed materially from those discussed in the Company’s Annual Report on Form 10-K for the year ended December 31, 2003. RESULTS OF OPERATIONS Underwriting Operations Growth Companywide net premiums written, which represent the premiums generated from policies written during the period less any reinsurance, increased 11% and 12% during the second quarter and first six months of 2004, respectively, over the same periods last year. Net premiums earned, which are a function of the premiums written in the current and prior periods, increased 17% and 18% during the second quarter and first six months of 2004, respectively, over the same periods last year. Insurance premiums written in 2004 and forward are being earned into income using a daily earnings convention, as compared to a mid-month convention used previously; there was no impact on amounts reported in prior periods. The change to a daily earnings method will improve the precision of the Company’s premium recognition on a monthly basis. The Company analyzes its growth by reviewing rate levels, new customers and the retention characteristics of its books of business. During the second quarter 2004, the Company implemented 28 auto rate revisions in various states, bringing the total to 54 for the year. The overall impact of these revisions was a slight reduction in rates for the year. The Company will continue to assess market conditions on a state-by-state basis and will consider rate reductions in states in which it will be able to maintain an attractive combination of profit and growth while still maintaining service quality and will seek selective rate increases where necessary to maintain rate adequacy. 11
- 13. Another important element affecting growth is customer retention. One measure of improvement in customer retention is policy life expectancy (PLE), which is the estimate of the average length of time that a policy will remain in force before cancellation or non-renewal. The Company measures PLE on a product and tier basis and continues to refine its measurement and methodology. In general, the Company’s current measure of PLE in its personal auto business is slightly more positive than in the prior quarter, but lags the PLE for the second quarter 2003. Profitability For the second quarter and first six months of 2004, the Company generated net income of $386.3 million and $846.3 million, respectively, compared to $286.3 million and $577.8 million for the same periods last year. Net income per share was $1.76 and $3.85 for the second quarter and first six months of 2004, compared to $1.29 and $2.61 for the same periods last year. The GAAP combined ratio (CR) was 85.4 for the second quarter 2004, compared to 88.8 for the second quarter 2003, driven by lower losses and loss adjustment expenses, partially offset by higher expenses. The year-to-date CR was 84.3, compared to 87.8 last year. Included in net income are net realized losses on securities of $3.4 million, or $.01 per share, for the second quarter 2004, and net realized gains of $56.1 million, or $.17 per share, for the first six months of 2004. Second quarter and first half 2003 results included net realized gains on securities of $23.1 million, or $.07 per share, and $20.0 million, or $.06 per share, respectively. Investment income, on a pretax basis net of investment and interest expenses, was $102.1 million and $193.2 million for the second quarter and first six months of 2004, respectively, compared to $86.5 million and $175.1 million for the same periods last year. In addition to the increase in interest and dividends generated in 2004 (reflecting an increase in average invested assets partially offset by lower yields), the Company incurred less interest expense for the second quarter and first six months, primarily attributable to the retirement of all $200 million of its 6.60% Notes during the first quarter 2004. During the first quarter 2004, the Company reduced its tax liability $7.1 million, or $.02 per share, for tax years 1993-1998, which years were settled concurrently with the receipt of a $58 million tax refund from the IRS during the first quarter. Overall, the Company’s income taxes shifted to a net liability as of June 30, 2004, as compared to the same period last year, primarily driven by the receipt of the above-mentioned tax refund; in addition to the tax refund, the shift from year-end was primarily due to the increase in the net provision for income taxes. 12
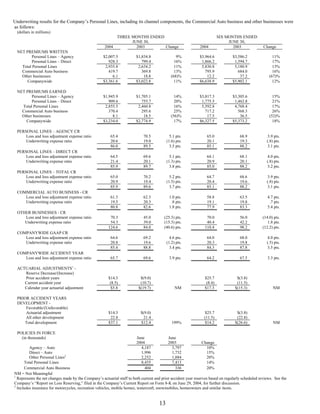
- 14. Underwriting results for the Company’s Personal Lines, including its channel components, the Commercial Auto business and other businesses were as follows: (dollars in millions) THREE MONTHS ENDED SIX MONTHS ENDED JUNE 30, JUNE 30, 2004 2003 Change 2004 2003 Change NET PREMIUMS WRITTEN Personal Lines – Agency $2,007.5 $1,834.8 9% $3,964.6 $3,586.2 11% Personal Lines – Direct 928.3 799.4 16% 1,866.2 1,594.7 17% Total Personal Lines 2,935.8 2,634.2 11% 5,830.8 5,180.9 13% Commercial Auto business 419.7 369.8 13% 795.9 684.0 16% Other businesses 6.1 18.8 (68)% 12.2 37.2 (67)% Companywide $3,361.6 $3,022.8 11% $6,638.9 $5,902.1 12% NET PREMIUMS EARNED Personal Lines – Agency $1,945.9 $1,705.1 14% $3,817.3 $3,305.6 15% Personal Lines – Direct 909.6 755.7 20% 1,775.5 1,462.8 21% Total Personal Lines 2,855.5 2,460.8 16% 5,592.8 4,768.4 17% Commercial Auto business 370.4 295.6 25% 717.2 568.3 26% Other businesses 8.1 18.5 (56)% 17.5 36.5 (52)% Companywide $3,234.0 $2,774.9 17% $6,327.5 $5,373.2 18% PERSONAL LINES – AGENCY CR Loss and loss adjustment expense ratio 65.4 70.5 5.1 pts. 65.0 68.9 3.9 pts. Underwriting expense ratio 20.6 19.0 (1.6) pts. 20.1 19.3 (.8) pts. 86.0 89.5 3.5 pts. 85.1 88.2 3.1 pts. PERSONAL LINES – DIRECT CR Loss and loss adjustment expense ratio 64.5 69.6 5.1 pts. 64.1 68.1 4.0 pts. Underwriting expense ratio 21.4 20.1 (1.3) pts. 20.9 20.1 (.8) pts. 85.9 89.7 3.8 pts. 85.0 88.2 3.2 pts. PERSONAL LINES – TOTAL CR Loss and loss adjustment expense ratio 65.0 70.2 5.2 pts. 64.7 68.6 3.9 pts. Underwriting expense ratio 20.9 19.4 (1.5) pts. 20.4 19.6 (.8) pts. 85.9 89.6 3.7 pts. 85.1 88.2 3.1 pts. COMMERCIAL AUTO BUSINESS - CR Loss and loss adjustment expense ratio 61.3 62.3 1.0 pts. 58.8 63.5 4.7 pts. Underwriting expense ratio 19.5 20.3 .8 pts. 19.1 19.8 .7 pts. 80.8 82.6 1.8 pts. 77.9 83.3 5.4 pts. OTHER BUSINESSES - CR Loss and loss adjustment expense ratio 70.3 45.0 (25.3) pts. 70.0 56.0 (14.0) pts. Underwriting expense ratio 54.3 39.0 (15.3) pts. 40.4 42.2 1.8 pts. 124.6 84.0 (40.6) pts. 110.4 98.2 (12.2) pts. COMPANYWIDE GAAP CR Loss and loss adjustment expense ratio 64.6 69.2 4.6 pts. 64.0 68.0 4.0 pts. Underwriting expense ratio 20.8 19.6 (1.2) pts. 20.3 19.8 (.5) pts. 85.4 88.8 3.4 pts. 84.3 87.8 3.5 pts. COMPANYWIDE ACCIDENT YEAR Loss and loss adjustment expense ratio 65.7 69.6 3.9 pts. 64.2 67.5 3.3 pts. ACTUARIAL ADJUSTMENTS1 - Reserve Decrease/(Increase) Prior accident years $14.3 $(9.0) $25.7 $(3.8) Current accident year (8.5) (10.7) (8.4) (11.5) Calendar year actuarial adjustment $5.8 $(19.7) NM $17.3 $(15.3) NM PRIOR ACCIDENT YEARS DEVELOPMENT - Favorable/(Unfavorable) Actuarial adjustment $14.3 $(9.0) $25.7 $(3.8) All other development 22.8 21.4 (11.5) (22.8) Total development $37.1 $12.4 199% $14.2 $(26.6) NM POLICIES IN FORCE (in thousands) June June 2004 2003 Change Agency – Auto 4,187 3,797 10% Direct – Auto 1,996 1,732 15% Other Personal Lines2 2,252 1,884 20% Total Personal Lines 8,435 7,413 14% Commercial Auto Business 404 336 20% NM = Not Meaningful 1 Represents the net changes made by the Company’s actuarial staff to both current and prior accident year reserves based on regularly scheduled reviews. See the Company’s “Report on Loss Reserving,” filed in the Company’s Current Report on Form 8-K on June 29, 2004, for further discussion. 2 Includes insurance for motorcycles, recreation vehicles, mobile homes, watercraft, snowmobiles, homeowners and similar items. 13
- 15. Loss and Loss Adjustment Expense Reserves Claims costs, the Company’s most significant expense, represent payments made, and estimated future payments to be made, to or on behalf of its policyholders, including adjusting expenses needed to settle claims. These costs include an estimate for costs related to assignments, based on current business, under state-mandated automobile insurance programs. Claims costs are influenced by loss severity and frequency and inflation, among other factors. Accordingly, anticipated changes in these factors are taken into account when the Company establishes premium rates and loss reserves. During the second quarter and first six months of 2004, the Company continued to report favorable loss ratios, as compared to the prior year, although the ratios were slightly higher in the second quarter than in the first quarter. On a quarter over prior year quarter basis, the Company experienced a decline in frequency in every coverage that was greater than anticipated in its prior pricing actions. In contrast to frequency trend, the Company saw severity rise slightly during the second quarter 2004, as expected. The Company’s increase in severity was lower than that reported by the Property Casualty Insurers Association of America (comparing information through the first quarter 2004). For bodily injury, the Company experienced an increase in severity for the second quarter in a row, following a year in which the severity declined each quarter. Personal injury protection severity continues to increase as it had for most of 2003. For the second quarter 2004, property coverages’ severity was comparable with the prior periods. The Company plans to continue to be diligent about recognizing trend when setting rates. During the second quarter 2004, the Company experienced favorable loss reserve development. For the second quarter, about one-third of the total favorable development of $37.1 million resulted from favorable actuarial adjustments, with the remainder due to a continued recognition of lower severity for prior accident years than originally estimated. On a year-to-date basis, the Company has favorable total development, driven by favorable actuarial adjustments, partially offset by unfavorable “all other development” (e.g., claims settling for more or less than reserved, emergence of unreported claims at rates different than reserved and changes in reserve estimates by claims representatives). Year-to-date, the unfavorable all other development, which primarily related to personal auto and occurred during the first quarter 2004, was a function of several items, including: $12.5 million related to two class action lawsuit settlements; almost $5 million of personal injury protection development in three states; $10 million for property damage and $10 million for lower limit bodily injury coverage with a higher than expected emergence of late reported features being the majority of the development. The Company continues to increase the analysis intensity in its loss reserves to increase accuracy and to understand its business in greater detail. See the Company’s “Report on Loss Reserving,” filed in the Company’s Current Report on Form 8-K on June 29, 2004, for further discussion of the Company’s reserving practices. Underwriting Expenses Policy acquisition costs and other underwriting expenses were 20.8% and 19.6% of premiums earned for the second quarters 2004 and 2003, respectively, and 20.3% and 19.8% for the first six months of 2004 and 2003, respectively. The increase was primarily driven by an increase in the Company’s advertising expenditures, as well as the accrual for the settlement of several pending class action lawsuits. The increase in the “other underwriting expenses” was primarily attributable to the aforementioned items, as well as costs incurred to support the Company’s growing infrastructure. 14
- 16. Personal Lines The Company’s Personal Lines business units write insurance for private passenger automobiles and recreation vehicles, and represent 88% of the Company’s total year-to-date net premiums written. Personal Lines net premiums written grew 11% and 13% in the second quarter and first six months of 2004, respectively, and net premiums earned grew 16% and 17%, compared to the same periods last year. Policies in force grew 14%, while the Personal Lines new business applications increased only modestly in the second quarter and first six months of 2004, as compared to the same periods last year. The Personal Lines business is generated either by an agency or other intermediary or written directly by the Company. The Agency channel includes business written by our network of 30,000 independent insurance agencies, insurance brokers in several states and through strategic alliance business relationships (other insurance companies, financial institutions, employers and national brokerage agencies). The Direct business includes business written through 1-800-PROGRESSIVE, online at progressive.com and on behalf of affiliates. The Agency Channel Growth over prior year Quarter Year-to-Date Net premiums written 9% 11% Net premiums earned 14% 15% Auto policies in force NM 10% NM = Not Meaningful The Agency auto business saw a slight decrease (about 1%) in new applications in both the second quarter and first six months of 2004, as compared to the same periods last year, partially driven by the fact that fewer customers were in the marketplace shopping for insurance since it appears as if competitors have achieved more rate adequacy. Conversions (i.e., converting a quote to a sale) were also down slightly for the year. The Agency expense ratio increased for the second quarter and first six months of 2004, as compared to the same periods last year, partially attributable to class action litigation accruals during the second quarter. The Agency auto acquisition costs increased due to the Company’s continued migration to a single commission level for all independent agencies. The Direct Channel Growth over prior year Quarter Year-to-Date Net premiums written 16% 17% Net premiums earned 20% 21% Auto policies in force NM 15% NM = Not Meaningful In the Direct channel, new applications are increasing (about 5%), as the Company is experiencing an increase in the conversion rate on fewer overall quotes. Total quotes are decreasing despite the Company’s increase in advertising spending (discussed below) reflecting the fact that the Company’s competitors are increasing advertising at a greater pace, thus reducing the Company’s share of the total voice, and that fewer customers are shopping. The use of the Internet, both for complete or partial quoting, continues to grow and is the most significant driver of new business activity in the Direct channel. The Direct expense ratio increased for the second quarter and first six months of 2004, as compared to the same periods last year, primarily driven by an increase in advertising expenses. Advertising costs increased nearly 54% for both periods. The Company is advertising on a national basis and supplements that coverage by local market media campaigns in over 100 designated market areas. 15
- 17. Commercial Auto Growth over prior year Quarter Year-to-Date Net premiums written 13% 16% Net premiums earned 25% 26% Auto policies in force NM 20% NM = Not Meaningful The Company’s Commercial Auto business unit writes primary liability, physical damage and other auto- related insurance for automobiles and trucks owned by small businesses, with the majority of its customers insuring three or fewer vehicles. The Commercial Auto business represents 12% of the Company’s total year- to-date net premiums written. Although the Commercial Auto business differs from Personal Lines auto in its customer base and products written, both businesses require the same fundamental skills, including disciplined underwriting and pricing, as well as excellent claims service. The Company’s Commercial Auto business is primarily distributed through independent agencies. As with Personal Lines, the Company is also beginning to see growth slow in its Commercial Auto business as less people are shopping due to rate stability and the increase in acceptance of business by its competitors. Approximately 51% of the Company’s year-to-date Commercial Auto net premiums written were generated in the light local commercial auto market, which includes autos, vans and pick-up trucks used by contractors, landscapers and other artisans, and a variety of other small businesses. The remainder of the business was written in the specialty commercial auto market, which includes dump trucks, logging trucks and other short- haul commercial vehicles. Since the commercial auto policies have higher limits than personal auto, the Company continues to monitor this segment closely. Other Businesses The Company’s other businesses, which represents less than 1% of year-to-date net premiums written, primarily include writing directors’ and officers’ liability insurance and processing business for Commercial Auto Insurance Procedures (CAIP), which are state-supervised plans serving the involuntary market. The other businesses are also managing the wind-down of the Company’s lender’s collateral protection program, which the Company decided to cease writing as of September 30, 2003, and other run-off businesses. The ongoing indemnity products in the Company’s other businesses are profitable, with a slight decrease in net premiums written in the second quarter and first half of 2004, compared to the same periods last year. 16
- 18. Investments Portfolio Allocation The composition of the investment portfolio at June 30 was: Gross Gross % of Unrealized Unrealized Total Duration (millions) Market Cost Rating1 Gains Losses Portfolio (Years) Value 2004 Fixed Maturities $9,651.3 $124.0 $(95.9) $9,679.4 70.8% 3.3 AA+ Preferred stocks 846.6 15.5 (15.4) 846.7 6.2 3.0 BBB+ Short-term investments2 1,114.8 -- -- 1,114.8 8.2 <1 AA- Total Fixed Income 11,612.7 139.5 (111.3) 11,640.9 85.2 3.0 AA Common equities 1,601.8 430.8 (5.8) 2,026.8 14.8 NM NM Total Portfolio3 $13,214.5 $570.3 $(117.1) $13,667.7 100.0% 3.0 AA 2003 Fixed Maturities $7,760.8 $359.7 $(11.8) $8,108.7 68.9% 3.4 AA Preferred stocks 773.7 45.4 (5.7) 813.4 6.9 2.6 A- Short-term investments2 1,123.6 -- -- 1,123.6 9.6 <1 AA+ Total Fixed Income 9,658.1 405.1 (17.5) 10,045.7 85.4 3.1 AA Common equities 1,591.3 174.2 (46.1) 1,719.4 14.6 NM NM Total Portfolio3 $11,249.4 $579.3 $(63.6) $11,765.1 100.0% 3.1 AA NM = Not Meaningful 1 Credit quality ratings are assigned by nationally recognized securities rating organizations. To calculate the weighted average credit quality ratings, the Company weights individual securities based on market value and assigns a numeric score to each credit rating based on a scale from 0-5. 2 Short-term investments include Eurodollar deposits, commercial paper and other securities purchased with a maturity within one year. 3 The Company had net unsettled security acquisitions of $107.1 million and $258.2 million at June 30, 2004 and 2003, respectively. June 30, 2004 and 2003, totals include $1.4 billion and $1.3 billion, respectively, of securities in the portfolio of a consolidated, non-insurance subsidiary of the holding company; composition is similar to the consolidated portfolio. As of June 30, 2004, the Company’s portfolio had $453.2 million of net unrealized gains, compared to $515.7 million of net unrealized gains at June 30, 2003. The Company’s fixed income portfolio experienced a decline in net unrealized gains of $359.4 million, to $28.2 million at June 30, 2004 from $387.6 million at June 30, 2003, due in large part to an increase in interest rates, primarily during the third quarter of 2003 and the second quarter of 2004. The Company’s common equity portfolio experienced an increase in net unrealized gains of $296.9 million, to $425.0 million at June 30, 2004 from $128.1 million at June 30, 2003, as corporate earnings improved along with economic conditions. Fixed-Income Securities The fixed-income portfolio, which includes fixed-maturity securities, preferred stocks and short-term investments, had a duration of 3.0 years at June 30, 2004, and 3.1 years at June 30, 2003. After adjustments to exclude net unsettled securities transactions, the allocation of fixed-income securities at June 30, 2004, was 85.1% of the total portfolio. 17
- 19. The fixed-maturity securities, including short-term investments, as reported in the balance sheets, were comprised of the following: (millions) June 30, 2004 June 30, 2003 Investment-Grade Fixed Maturities: Short/Intermediate Term $10,199.2 94.5% $8,553.9 92.6% Long Term 466.4 4.3 494.8 5.4 Non-Investment-Grade Fixed Maturities 128.6 1.2 183.6 2.0 Total Fixed Maturities $10,794.2 100.0% $9,232.3 100.0% The non-investment-grade fixed-maturity securities offer the Company higher returns and added diversification, but may involve greater risks related to creditworthiness and liquidity of the secondary trading market. Included in the fixed-income portfolio are $3.3 billion of asset-backed securities. These asset-backed securities are comprised of residential mortgage-backed ($.9 billion), commercial mortgage-backed ($1.2 billion) and other asset-backed ($1.2 billion) securities, with a total duration of 2.4 years and weighted average credit quality of AAA-. The largest components of other asset-backed securities are automobile receivable loans ($.7 billion) and home equity loans ($.3 billion). Substantially all asset-backed securities are liquid with available market quotes and contain no residual interests (i.e., the most subordinated class in a pool of securitized assets). Common Equities Common equities, as reported in the balance sheets, were comprised of the following: (millions) June 30, 2004 June 30, 2003 Common Stocks $1,988.7 98.1% $1,673.7 97.3% Other Risk Investments 38.1 1.9 45.7 2.7 Total Common Equities $2,026.8 100.0% $1,719.4 100.0% Common equities comprise 14.9% of the total portfolio, excluding the net unsettled securities transactions, at June 30, 2004. Common stocks are the majority of the common equity portfolio and are managed externally to track the Russell 1000 Index within +/- 50 basis points. To maintain high correlation with the Russell 1000, the Company holds approximately 700 of the common stocks comprising the index. Individual holdings are measured based on their contribution to the correlation with the index. The Company’s common equity allocation and management strategy are intended to provide diversification for the total portfolio and focuses on changes in value of the equity portfolio relative to the change in value of the index on an annual basis as noted in the following table: Market Value at Market Value at Total Return1 June 30, 2004 December 31, 2003 Common Stock2 $1,988.7 million $1,929.7 million 3.2% Russell 1000 Index3 $609.31 $594.56 3.3% 1 Includes gross dividends reinvested and price appreciation/depreciation. 2 The market value at June 30, 2004, includes appreciation/depreciation in the value of the underlying securities, as well as dividend income received and net cash infusions/withdrawals made during the quarter needed to maintain the Company’s 85%/15% fixed income to equity allocation. 3 This broad-based index, which is used for comparative benchmarking, incepted December 31, 1986, with a base valuation of $130. Amounts shown represent changes in valuation based on growth and declines of the index members. 18
- 20. Other risk investments include private equity investments and limited partnership interests in private equity and mezzanine investment funds which have no off-balance-sheet exposure or contingent obligations, except for the $6.9 million of open funding commitments at June 30, 2004. Trading Securities Trading securities are entered into for the purpose of near-term profit generation. At June 30, 2004 and 2003, the Company did not have any trading securities, with the exception of the derivatives classified as trading as discussed below. The Company had no trading security gains or losses during the first six months of 2004, compared to $.1 million of gains for the first six months of 2003. Gains from trading securities are immaterial to the financial condition, cash flows and results of operations of the Company. Derivative Instruments From time to time, the Company invests in derivative instruments, which are primarily used to manage the risks of the available-for-sale portfolio. This is accomplished by modifying the basis, duration, interest rate or foreign currency characteristics of the portfolio, hedge securities or hedge cash flows. The Company had no risk management derivatives at June 30, 2004 or 2003. The Company recognized no gains or losses during the second quarter and first six months of 2004 or 2003 on risk management derivatives. Derivative instruments may also be used for trading purposes or classified as trading derivatives due to characteristics of the transaction. At June 30, 2004, the Company had three such derivatives with a net market value of $5.5 million, compared to one derivative with a net market value of $(.2) million at June 30, 2003. These derivatives, which are classified as trading, generated a combined net gain of $.9 million for the second quarter and a net loss of $.2 million for the first six months of 2004, compared to a net loss of $.2 million for both periods last year. The Company replicated corporate cash bond positions by selling credit default protection on three issuers and matching the derivatives notional value and maturity with Treasury securities with an equivalent principal value and maturity. At June 30, 2004 and 2003, the net market value of the positions, including the Treasuries, was $134.8 million and $55.2 million, respectively, with a net loss of $3.4 million for the second quarter and $3.0 million for the first six months of 2004, compared to a net loss of $.1 million for both the second quarter and six months of 2003. The results of the derivative and Treasury positions are immaterial to the financial condition, cash flows and results of operations and are reported as part of the available-for-sale portfolio, with the net gains (losses) reported as a component of net realized gains (losses) on securities. Investment Income Recurring investment income (interest and dividends) increased 11% for the second quarter and 5% for the first six months of 2004, compared to the same periods last year, reflecting an increase in the average assets invested, offset somewhat by a reduction in yields due to investing new cash in securities with yields lower than that of the investment portfolio's average book yield. The Company is reporting total return to more accurately reflect the management philosophy of the portfolio and evaluation of the investment results. The fully taxable equivalent (FTE) total return includes recurring investment income, net realized gains (losses) on securities and changes in unrealized appreciation/depreciation on investment securities. The Company reported the following investment results for the periods ended June 30: Three Months Six Months 2004 2003 2004 2003 Pretax recurring investment book yield 3.9% 4.2% 3.9% 4.4% Weighted average FTE book yield 4.5% 4.8% 4.5% 5.0% FTE total return: Fixed-income securities (1.4)% 2.6% .8% 4.1% Common stocks 1.4% 15.1% 3.2% 11.6% Total portfolio (.9)% 4.3% 1.2% 5.2% 19
- 21. Realized Gains/Losses The components of net realized gains (losses) for the periods ended June 30 were: (millions) Three Months Six Months 2004 2003 2004 2003 Gross Realized Gains: Available-for-Sale: Fixed maturities $10.9 $32.3 $58.4 $77.0 Preferred stocks -- .9 7.6 2.3 Common equities 6.6 6.3 22.6 15.0 Short-term Investments .1 -- .1 .1 17.6 39.5 88.7 94.4 Gross Realized Losses: Available-for-Sale: Fixed maturities 10.3 3.0 11.4 10.4 Preferred stocks -- 2.4 -- 2.5 Common equities 10.6 11.0 21.0 61.5 Short-term investments .1 -- .2 -- 21.0 16.4 32.6 74.4 Net Realized Gains (Losses) on Securities: Available-for-Sale: Fixed maturities .6 29.3 47.0 66.6 Preferred stocks -- (1.5) 7.6 (.2) Common equities (4.0) (4.7) 1.6 (46.5) Short-term investments -- -- (.1) .1 $(3.4) $23.1 $56.1 $20.0 Per share $(.01) $.07 $.17 $.06 For both the quarter and first six months of 2004, the gains in the fixed-maturity securities and preferred stocks were the result of advantageous yield movements and were recognized across the categories of the portfolio. The largest gains were in corporate debt securities, state and local government obligations and U.S. government obligations. The gross realized losses in the fixed maturity securities were primarily related to our investment in U.S. Government notes, which experienced a decline in value during the second quarter 2004 as a result of rising interest rates. The gross realized gains and losses in the common stock portfolio for the quarter and year-to-date were primarily attributable to rebalancing the equity-indexed portfolio. Other-Than-Temporary Impairment (OTI) From time to time, realized losses include write-downs of securities determined to have an other-than- temporary decline in market value. The Company routinely monitors its portfolio for pricing changes which might indicate potential impairments and performs detailed reviews of securities with unrealized losses based on predetermined criteria. In such cases, changes in market value are evaluated to determine the extent to which such changes are attributable to (i) fundamental factors specific to the issuer, such as financial conditions, business prospects or other factors or (ii) market-related factors, such as interest rates or equity market declines. Fixed income and equity securities with declines attributable to issuer-specific fundamentals are reviewed to identify all available evidence, circumstances and influences to estimate the potential for and timing of recovery of the investment’s impairment. An other-than-temporary impairment loss is deemed to have occurred when the potential for and timing of recovery does not satisfy the guidance set forth in Staff Accounting Bulletin 59, “Noncurrent Marketable Equity Securities,” SFAS 115, “Accounting for Certain Investments in Debt and Equity Securities,” and other related guidance. For fixed income investments with unrealized losses due to market or industry-related declines where the Company has the intent and ability to hold the investment for the period of time necessary to recover a significant portion of the investment’s original principal and interest obligation, declines are not deemed to qualify as other than temporary. The Company's policy for common stocks with market-related declines is to recognize impairment losses on individual securities with losses that are not reasonably expected to be recovered under historical market conditions when the security has been in a loss position for three consecutive quarters. 20
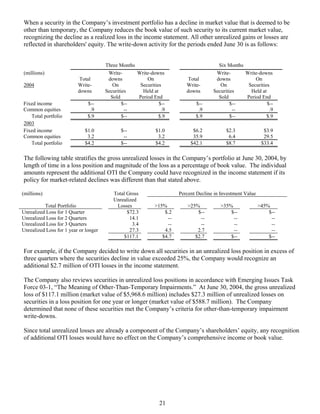
- 22. When a security in the Company’s investment portfolio has a decline in market value that is deemed to be other than temporary, the Company reduces the book value of such security to its current market value, recognizing the decline as a realized loss in the income statement. All other unrealized gains or losses are reflected in shareholders' equity. The write-down activity for the periods ended June 30 is as follows: Three Months Six Months (millions) Write- Write-downs Write- Write-downs Total downs On Total downs On 2004 Write- On Securities Write- On Securities downs Securities Held at downs Securities Held at Sold Period End Sold Period End Fixed income $-- $-- $-- $-- $-- $-- Common equities .9 -- .9 .9 -- .9 Total portfolio $.9 $-- $.9 $.9 $-- $.9 2003 Fixed income $1.0 $-- $1.0 $6.2 $2.3 $3.9 Common equities 3.2 -- 3.2 35.9 6.4 29.5 Total portfolio $4.2 $-- $4.2 $42.1 $8.7 $33.4 The following table stratifies the gross unrealized losses in the Company’s portfolio at June 30, 2004, by length of time in a loss position and magnitude of the loss as a percentage of book value. The individual amounts represent the additional OTI the Company could have recognized in the income statement if its policy for market-related declines was different than that stated above. (millions) Total Gross Percent Decline in Investment Value Unrealized Total Portfolio Losses >15% >25% >35% >45% Unrealized Loss for 1 Quarter $72.3 $.2 $-- $-- $-- Unrealized Loss for 2 Quarters 14.1 -- -- -- -- Unrealized Loss for 3 Quarters 3.4 -- -- -- -- Unrealized Loss for 1 year or longer 27.3 4.5 2.7 -- -- $117.1 $4.7 $2.7 $-- $-- For example, if the Company decided to write down all securities in an unrealized loss position in excess of three quarters where the securities decline in value exceeded 25%, the Company would recognize an additional $2.7 million of OTI losses in the income statement. The Company also reviews securities in unrealized loss positions in accordance with Emerging Issues Task Force 03-1, “The Meaning of Other-Than-Temporary Impairments.” At June 30, 2004, the gross unrealized loss of $117.1 million (market value of $5,968.6 million) includes $27.3 million of unrealized losses on securities in a loss position for one year or longer (market value of $588.7 million). The Company determined that none of these securities met the Company’s criteria for other-than-temporary impairment write-downs. Since total unrealized losses are already a component of the Company’s shareholders’ equity, any recognition of additional OTI losses would have no effect on the Company’s comprehensive income or book value. 21
- 23. Repurchase Transactions The Company entered into repurchase commitment transactions, whereby the Company loans Treasury or U.S. Government agency securities to accredited brokerage firms in exchange for cash equal to the fair market value of the securities. These internally managed transactions are typically overnight arrangements. The cash proceeds are invested in AA or higher financial institution paper with yields that exceed the Company’s interest obligation on the borrowed cash. The Company is able to borrow the cash at low rates since the securities loaned are in short supply. The Company’s interest rate exposure does not increase or decrease since the borrowing and investing periods match. During the three months ended June 30, 2004, the Company’s largest single outstanding balance of repurchase commitments was $1.0 billion open for seven business days, with an average daily balance of $.8 billion for the quarter. The Company had no open repurchase commitments at June 30, 2004 and 2003. The Company earned income of $.6 million and $.2 million on repurchase commitments during the three months ended June 30, 2004 and 2003, respectively, and earned $.9 million for both the six months ended June 30, 2004 and June 30, 2003. Safe Harbor Statement under the Private Securities Litigation Reform Act of 1995: Statements in this quarterly report on Form 10-Q that are not historical fact are forward-looking statements that are subject to certain risks and uncertainties that could cause actual events and results to differ materially from those discussed herein. These risks and uncertainties include, without limitation, uncertainties related to estimates, assumptions and projections generally; inflation and other changes in economic conditions (including changes in interest rates and financial markets); the accuracy and adequacy of the Company’s pricing and loss reserving methodologies; pricing competition and other initiatives by competitors; the Company’s ability to obtain regulatory approval for requested rate changes and the timing thereof; the effectiveness of the Company’s advertising campaigns; legislative and regulatory developments; the outcome of litigation pending against the Company; weather conditions (including the severity and frequency of storms, hurricanes, snowfalls, hail and winter conditions); changes in driving patterns and loss trends; acts of war and terrorist activities; court decisions and trends in litigation and health care and auto repair costs; and other matters described from time to time by the Company in releases and publications, and in periodic reports and other documents filed with the United States Securities and Exchange Commission. In addition, investors should be aware that generally accepted accounting principles prescribe when a company may reserve for particular risks, including litigation exposures. Accordingly, results for a given reporting period could be significantly affected if and when a reserve is established for a major contingency. Reported results, therefore, may appear to be volatile in certain accounting periods. 22