Improving Energy Efficiency of Pumps and Fans
•Download as PPT, PDF•
2 likes•1,046 views

Pumps and Fans are energy consuming equipment that can be found in almost all Industries. Therefore, it is important to check if they are running efficiently. This presentation give an overview about energy saving opportunities in pump and fan equipment. It was prepared in the context of energy auditor training in Nepal in the context of GIZ/NEEP programme. For further information go to EEC webpage: http://eec-fncci.org/
Report
Share


Improving Energy Efficiency of Pumps and Fans
- 1. Energy Efficiency :Energy Efficiency : AS RUN PERFORMANCE ASSESSMENTAS RUN PERFORMANCE ASSESSMENT OF PUMPS AND FANSOF PUMPS AND FANS D PAWAN KUMARD PAWAN KUMAR
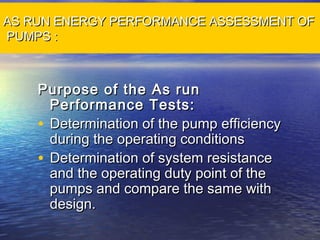
- 2. AS RUN ENERGY PERFORMANCE ASSESSMENT OFAS RUN ENERGY PERFORMANCE ASSESSMENT OF PUMPSPUMPS :: Purpose of the As runPurpose of the As run Performance Tests:Performance Tests: • Determination of the pump efficiencyDetermination of the pump efficiency during the operating conditionsduring the operating conditions • Determination of system resistanceDetermination of system resistance and the operating duty point of theand the operating duty point of the pumps and compare the same withpumps and compare the same with design.design.
- 3. Performance TermsPerformance Terms :: Pump Capacity, Q = Volume of liquid delivered by pump per unit time,m3 /hr or m3 /sec Q is proportional to N, where N- rotational speed of the pump Total developed head, H= The sum of suction and discharge pressures The pump head represents the net work done on unit weights of a liquid in passing from inlet of the pump to the discharge of the pump. There are three heads in common use in pumps namely 1.0. Static head 2.0. Velocity head 3.0. Friction head. The frictional head in a system of pipes, valves and fittings varies as a function (roughly as the square) of the capacity flow through the system. System resistance: The sum of frictional head in resistance & total static head. .
- 4. Pump Efficiency:Pump Efficiency: Where, Hydraulic power, Ph (kW) = Q x (hd - hs ) x ρ x g / 1000 Q = Volume flow rate (m3 /s), ρ = density of the fluid (kg/m3 ), g = acceleration due to gravity (m/s2 ), (hd - hs ) = Total head in metres 100 , x shaftpumpthetoinputPower PpowerHydraulic EfficiencyPump h =
- 5. As run Trials for Determination of PumpAs run Trials for Determination of Pump EfficiencyEfficiency To determine the pump efficiency, three key parameters are required: Flow, Head and Power. Of these, flow measurement is the most crucial parameter as normally accurate online flow meters are hardly available, in majority of pumping systems. The following methods can be adopted to assess the flow depending on the availability and site conditions.
- 6. Different Methods forDifferent Methods for Flow MeasurementFlow Measurement , Q:, Q: • Tracer method BS5857Tracer method BS5857 • Ultrasonic flow measurementUltrasonic flow measurement • Tank filling methodTank filling method • Installation of an on-line flow meterInstallation of an on-line flow meter
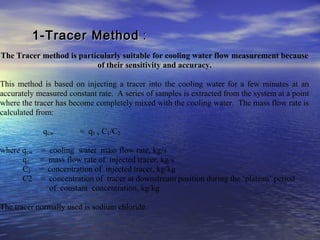
- 7. 1-Tracer Method1-Tracer Method :: The Tracer method is particularly suitable for cooling water flow measurement because of their sensitivity and accuracy. This method is based on injecting a tracer into the cooling water for a few minutes at an accurately measured constant rate. A series of samples is extracted from the system at a point where the tracer has become completely mixed with the cooling water. The mass flow rate is calculated from: qcw = q1 x C1/C2 where qcw = cooling water mass flow rate, kg/s q1 = mass flow rate of injected tracer, kg/s C1 = concentration of injected tracer, kg/kg C2 = concentration of tracer at downstream position during the ‘plateau’ period of constant concentration, kg/kg The tracer normally used is sodium chloride.
- 8. 2-Ultrasonic Flow meters:2-Ultrasonic Flow meters: Operating on Doppler effect principle, these meters are non-invasive, meaning measurements can be taken without disturbing the system. Scales and rust in the pipes are likely to impact the accuracy •Ensure measurements are taken in a sufficiently long length of pipe free from flow disturbance due to bends, tees and other fittings. •The pipe section where measurement is to be taken should be hammered gently to enable scale and rust to fall out. •For better accuracy, a section of the pipe can be replaced with new pipe for flow measurements.
- 9. 3-Tank filling method:3-Tank filling method: In open flow systems such as water getting pumped to an overhead tank or a sump, the flow can be measured by noting the difference in tank levels for a specified period during which the outlet flow from the tank is stopped. The internal tank dimensions should be preferable taken from the design drawings, in the absence of which direct measurements may be resorted to.
- 10. 4-Installation of an on-line flow meter:4-Installation of an on-line flow meter: If the application to be measured is going to be critical and periodic then the best option would be to install an on-line flow meter which can get rid of the major problems encountered with other types.
- 11. Determination of total head, H:Determination of total head, H: Suction head (hs) This is taken from the pump inlet pressure gauge readings and the value to be converted in to meters (1kg/cm2 = 10. m). If not the level difference between sump water level to the centerline of the pump is to be measured. This gives the suction head in meters. Discharge head (hd) This is taken from the pump discharge side pressure gauge. Installation of the pressure gauge in the discharge side is a must, if not already available.
- 12. ILLUSTRATIVE EXAMPLE: BOILER FEED PUMP Sl.Sl. NoNo .. Item Ref.Item Ref. UnitsUnits DesignDesign Unit # 1Unit # 1 Unit # 2Unit # 2 Unit # 3Unit # 3 Unit # 4Unit # 4 BFP # 1BFP # 1 BFP # 2BFP # 2 BFP # 3BFP # 3 BFP # 4BFP # 4 11 Unit LoadUnit Load MWMW 6060 5252 5656 5555 60.160.1 22 Grid frequencyGrid frequency HzHz 5050 49.3949.39 49.7549.75 51.3451.34 49.4749.47 33 BFP flowBFP flow TPHTPH 308308 225225 235235 255255 246246 44 Suc. PressureSuc. Pressure Kg/CmKg/Cm22 5.55.5 6.26.2 6.86.8 5.85.8 55 Disch. PressureDisch. Pressure Kg/CmKg/Cm22 148.2148.2 136.7136.7 135135 127.0127.0 66 Boiler Drum Pr.Boiler Drum Pr. Kg/CmKg/Cm22 100100 8181 8585 8181 8989 77 Total headTotal head Kg/CmKg/Cm22 112.5112.5 142.7142.7 130.5130.5 128.2128.2 121121 88 Suction temp.Suction temp. OO CC 175175 151151 158.4158.4 157157 155155 99 Liquid densityLiquid density Kg/mKg/m33 0.90470.9047 0.910.91 0.9050.905 0.9050.905 0.910.91 1010 BFP AmpsBFP Amps AA 270270 263.60263.60 247.20247.20 253.60253.60 244.80244.80 1111 BFP motor powerBFP motor power KWKW 1305.51305.5 1268.881268.88 1211.991211.99 1225.771225.77 1214.101214.10 1212 Liquid KWLiquid KW KWKW 1043.671043.67 874.93874.93 835.48835.48 890.83890.83 812.46812.46 1313 Combined Eff.*Combined Eff.* %% 73.6073.60 68.9568.95 68.9368.93 72.6772.67 66.966.9 1414 % Load on motor% Load on motor %% 97.297.2 92.892.8 93.993.9 93.093.0 1515 % Load on flow% Load on flow %% 73.0573.05 76.3076.30 82.7982.79 79.8779.87 1616 % Load on head% Load on head %% 126.84126.84 115.97115.97 113.96113.96 107.73107.73 1717 SECSEC kWh/TkWh/T 4.23864.2386 5.63955.6395 5.15745.1574 4.80704.8070 4.93544.9354
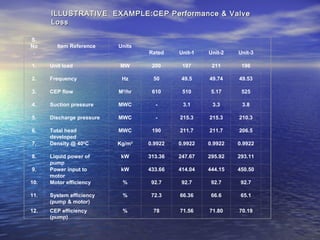
- 13. S. No . Item Reference Units Rated Unit-1 Unit-2 Unit-3 1. Unit load MW 200 197 211 196 2. Frequency Hz 50 49.5 49.74 49.53 3. CEP flow M3 /hr 610 510 5.17 525 4. Suction pressure MWC - 3.1 3.3 3.8 5. Discharge pressure MWC - 215.3 215.3 210.3 6. Total head developed MWC 190 211.7 211.7 206.5 7. Density @ 400 C Kg/m3 0.9922 0.9922 0.9922 0.9922 8. Liquid power of pump kW 313.36 247.67 295.92 293.11 9. Power input to motor kW 433.66 414.04 444.15 450.50 10. Motor efficiency % 92.7 92.7 92.7 92.7 11. System efficiency (pump & motor) % 72.3 66.36 66.6 65.1 12. CEP efficiency (pump) % 78 71.56 71.80 70.19 ILLUSTRATIVE EXAMPLE:CEP Performance & ValveILLUSTRATIVE EXAMPLE:CEP Performance & Valve LossLoss
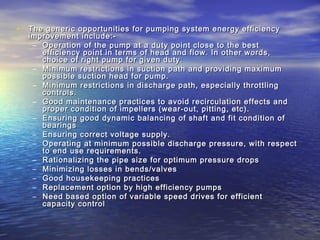
- 14. • The generic opportunities for pumping system energy efficiencyThe generic opportunities for pumping system energy efficiency improvement include:-improvement include:- – Operation of the pump at a duty point close to the bestOperation of the pump at a duty point close to the best efficiency point in terms of head and flow. In other words,efficiency point in terms of head and flow. In other words, choice of right pump for given duty.choice of right pump for given duty. – Minimum restrictions in suction path and providing maximumMinimum restrictions in suction path and providing maximum possible suction head for pump.possible suction head for pump. – Minimum restrictions in discharge path, especially throttlingMinimum restrictions in discharge path, especially throttling controls.controls. – Good maintenance practices to avoid recirculation effects andGood maintenance practices to avoid recirculation effects and proper condition of impellers (wear-out, pitting, etc).proper condition of impellers (wear-out, pitting, etc). – Ensuring good dynamic balancing of shaft and fit condition ofEnsuring good dynamic balancing of shaft and fit condition of bearingsbearings – Ensuring correct voltage supply.Ensuring correct voltage supply. – Operating at minimum possible discharge pressure, with respectOperating at minimum possible discharge pressure, with respect to end use requirements.to end use requirements. – Rationalizing the pipe size for optimum pressure dropsRationalizing the pipe size for optimum pressure drops – Minimizing losses in bends/valvesMinimizing losses in bends/valves – Good housekeeping practicesGood housekeeping practices – Replacement option by high efficiency pumpsReplacement option by high efficiency pumps – Need based option of variable speed drives for efficientNeed based option of variable speed drives for efficient capacity controlcapacity control
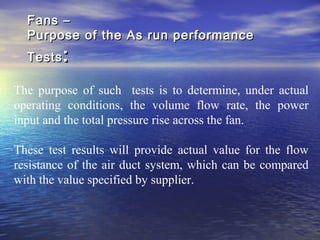
- 15. Fans –Fans – Purpose of the As run performancePurpose of the As run performance TestsTests :: The purpose of such tests is to determine, under actual operating conditions, the volume flow rate, the power input and the total pressure rise across the fan. These test results will provide actual value for the flow resistance of the air duct system, which can be compared with the value specified by supplier.
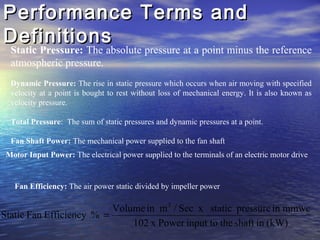
- 16. Performance Terms andPerformance Terms and DefinitionsDefinitions Fan Efficiency: The air power static divided by impeller power Static Pressure: The absolute pressure at a point minus the reference atmospheric pressure. Dynamic Pressure: The rise in static pressure which occurs when air moving with specified velocity at a point is bought to rest without loss of mechanical energy. It is also known as velocity pressure. Total Pressure: The sum of static pressures and dynamic pressures at a point. Fan Shaft Power: The mechanical power supplied to the fan shaft Motor Input Power: The electrical power supplied to the terminals of an electric motor drive (kW)inshafttheinput toPowerx102 mmwcinpressurestaticxSec/minVolume %EfficiencyFanStatic 3 =
- 17. ILLUSTRATIVE EXAMPLE :As run Performance of IDILLUSTRATIVE EXAMPLE :As run Performance of ID FANSFANS = TPH 1664.9 1130.65 1604.40 1604.40 1769.34 = m3 /sec 572.28 376.19 533.23 541.85 593.38 2 Average Suction Pressure = mmWC NA NA -279.0 -263.6 -237.3 3 Average Discharge Pressure = mmWC NA NA 25.0 25.0 25.0 4 = mmWC 351.8 212.5 304.0 288.6 262.3 Nm/kg 4270.7 2497.4 3568.2 3442.5 3107.0 5 Flue Gas Temp at ID inlet = o C 144 135 135.3 141.9 139.0 6 Flue Gas Density = kg/m3 0.8081 0.835 0.836 0.822 0.828 7 ID Fan Hyd. Scoop Positrion = % NA NA 94.29 93.78 97.97 8 ID Fan IGV Positrion = % NA NA 81.78 82.43 77.13 9 ID Fan Speed = RPM 689 487 710.65 740.80 746.62 10 ID Fan Motor Input Power (Electrical) = kW 3960.0 1487.7 2600.0 2566.0 2588.8 11 IDF Motor Output power ( @ 95% motor Effy.) kW 3762.0 1413.3 2470 2437.7 2459.36 12 ID Fan Shaft Power (@ 75% of Hydr. Coupling Effy.) kW 2821.5 1060.0 1852.5 1828.3 1844.5 13 ID fan Air Power = kW 1975.03 784.37 1590.22 1534.20 1527.05 14 Combined Efficiency of ID Fans = % 49.88 52.73 61.16 59.79 58.99 15 Operating Fan Efficiency = % 70.0 74.0 85.84 83.92 82.79 16 SEC KWH/T NA 1.32 1.62 1.60 1.46 17 % Loading on Capacity (Volumetric Flow) = % Ref 65.7 93.2 94.7 103.7 18 % Loading on Head = % Ref 60.4 86.3 82.0 74.5 19 % Loading On kW = % Ref 41.3 72.3 71.3 72.0 Total Diff. Pressure Flue Gas Flow At ID Fan Inlet1 1769.34 581.09 -249.3 25.0 274.3 3181.9 130.5 0.846 94.80 74.38 732.65 2615.7 2484.92 1863.7 1563.83 59.79 83.91 1.48 101.5 77.9 72.7 Units Unit 1 Unit 2 Specified 100 % TCMR IDF-1A IDF-1C IDF-2B Fan Design Unit 2 IDF-2B IDF-2C
- 18. • The generic opportunities for energy efficiencyThe generic opportunities for energy efficiency improvements in fans and fan systems include:-improvements in fans and fan systems include:- – Operation of fan at close to best efficiency duty point.Operation of fan at close to best efficiency duty point. – Minimum restrictions in suction path (no dampers)Minimum restrictions in suction path (no dampers) – Minimum restrictions in discharge path (no dampers)Minimum restrictions in discharge path (no dampers) – Operation at rational head and flow, vis-à-vis processOperation at rational head and flow, vis-à-vis process requirements.requirements. – Ensuring correct voltage and frequency at supplyEnsuring correct voltage and frequency at supply – Good maintenance practicesGood maintenance practices – Good housekeeping practicesGood housekeeping practices – Minimizing in leak air / gasMinimizing in leak air / gas – Minimizing out leak air / gasMinimizing out leak air / gas – Rationalizing duct size for minimizing pressure dropsRationalizing duct size for minimizing pressure drops – Minimizing sharp bendsMinimizing sharp bends – Replacement options by higher efficiency fansReplacement options by higher efficiency fans – Need based option of variable speed drives if capacityNeed based option of variable speed drives if capacity control is required for end usecontrol is required for end use – Minimizing slippage losses in beltsMinimizing slippage losses in belts
- 19. THANK YOU