Location via proxy:   [ UP ]  
[Report a bug]   [Manage cookies]                
SlideShare a Scribd company logo
4th Quarter and Fiscal Year 2009
                      Conference Call

                                September 29, 2009


© Copyright 2009 Walgreen Co.           1
Fourth Quarter and Fiscal Year 2009
Agenda
     Introduction                   Rick Hans
           & Safe Harbor             Divisional VP - IR & Finance

     4Q and FY Highlights           Greg Wasson
           & Strategies Update       President & CEO


     4Q and FY Financials           Wade Miquelon
                                     Executive Vice President & CFO


     Questions & Answers            All


© Copyright 2009 Walgreen Co.    2
Safe Harbor
  Certain statements and projections of
        future results made in this presentation
        f t         lt   d i thi          t ti
        constitute forward-looking information that
        is based on current market, competitive
        and regulatory expectations that involve
        risk and uncertainty.
  Please see our latest Forms 10-K and 10-Q
        for a discussion of factors as they relate to
        forward-looking statements.


© Copyright 2009 Walgreen Co.   3
4Q and FY09 Highlights &
                           Strategies Update

                                Greg Wasson
                                 President & CEO


© Copyright 2009 Walgreen Co.           4
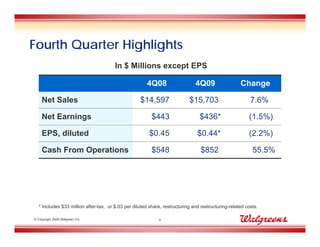
Fourth Quarter Highlights
                                        In $ Millions except EPS

                                                       4Q08                    4Q09                  Change

    Net Sales                                       $14,597                 $15,703                       7.6%

    Net Earnings                                          $443                   $436*                   (1.5%)

    EPS, diluted                                         $0.45                  $0.44*                   (2.2%)

    Cash From Operations                                  $548                    $852                     55.5%


   * Includes $33 million after-tax, or $.03 per diluted share, restructuring and restructuring-related costs.

© Copyright 2009 Walgreen Co.                                5
Fiscal 2009 Highlights
                                        In $ Millions except EPS

                                                       FY08                    FY09                  Change

    Net Sales                                       $59,034                 $63,335                       7.3%

    Net Earnings                                      $2,157                  $2,006*                    (7.0%)

    EPS, diluted                                        $2.17                   $2.02*                   (6.9%)

    Cash From Operations                              $3,039                   $4,111                      35.3%


   * Includes $163 million after-tax, or $.16 per diluted share, restructuring and restructuring-related costs.

© Copyright 2009 Walgreen Co.                                6
On the Frontlines of Healthcare
  Healthcare Reform
           Support need for healthcare reform
           Focus on prevention and wellness
           Employer funded medical coverage critical
            Employer-funded
           Provider of quality, affordable, accessible
             healthcare with 68,000 health professionals

  Update on flu season
           16 000
            16,000  certified immunizers
           Significant growth in seasonal flu shots
           Positioned for H1N1 pandemic


© Copyright 2009 Walgreen Co.      7
Taking Walgreen Co. to the Market
                Co
  Platforms in place
           7,000 drugstores
           Specialty pharmacy and infusion
           700 worksite health centers and retail clinics


  Direct-to-employer/government/MCO/PBM
           Caterpillar         – Proprietary, transparent price list

  Direct-to-consumer
           Prescription         Savings Club – nearly 2M members


© Copyright 2009 Walgreen Co.                8
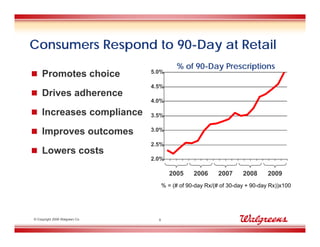
Consumers Respond to 90-Day at Retail
                                            % of 90-Day Prescriptions
 Promotes choice               5.0%

                                4.5%
 Drives adherence
                                4.0%

 Increases compliance          3.5%


 Improves outcomes             3.0%

                                2.5%
 Lowers costs
                                2.0%

                                         2005     2006      2007     2008      2009
                                      % = (# of 90-day Rx/(# of 30-day + 90-day Rx))x100


© Copyright 2009 Walgreen Co.     9
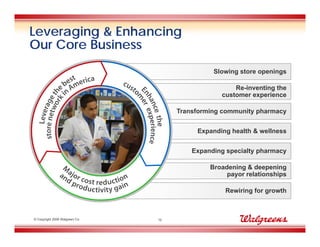
Leveraging & Enhancing
Our Core Business
                                               Slowing store openings

                                                     Re-inventing the
                                                 customer experience

                                     Transforming community pharmacy


                                          Expanding health & wellness


                                         Expanding specialty pharmacy

                                              Broadening & deepening
                                                       g        p    g
                                                   payor relationships

                                                  Rewiring for growth


© Copyright 2009 Walgreen Co.   10
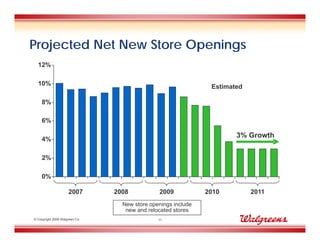
Projected Net New Store Openings
  12%

  10%                                                           Estimated

    8%

    6%

                                                                       3% Growth
    4%

    2%

    0%

                     2007       2008           2009            2010         2011
                                  New store openings include
                                   new and relocated stores
© Copyright 2009 Walgreen Co.                  11
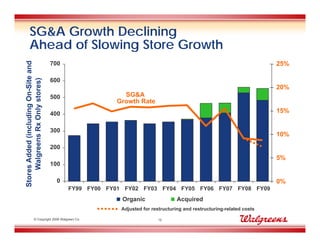
SG&A Growth Declining
       Ahead of Slowing Store Growth
Store Added (including On-Site and


                                     700                                                                              25%
                             e
     Walgreen Rx Only stores)


                                     600
                                                                                                                      20%
                                     500                 SG&A
                                                       Growth Rate
                     y


                                     400                                                                              15%


                                     300
                                                                                                                      10%
            ns


                                     200
                                                                                                                      5%
                                     100
    es


                                      0                                                                               0%
                                           FY99 FY00 FY01 FY02 FY03 FY04 FY05 FY06 FY07 FY08 FY09
                                                         Organic
                                                           g                     Acquired
                                                                                   q
                                                         Adjusted for restructuring and restructuring-related costs

                © Copyright 2009 Walgreen Co.                            12
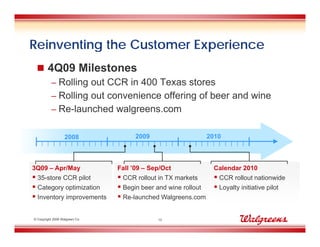
Reinventing the Customer Experience
  4Q09 Milestones
    – Rolling out CCR in 400 Texas stores
    – Rolling out convenience offering of beer and wine
    – Re launched walgreens com
      Re-launched walgreens.com

                   2008              2009                       2010


3Q09 – Apr/May                  Fall ’09 – Sep/Oct
                                      09                          Calendar 2010
 35-store CCR pilot             CCR rollout in TX markets        CCR rollout nationwide
 Category optimization          Begin beer and wine rollout      Loyalty initiative pilot
 Inventory improvements         Re-launched Walgreens.com

© Copyright 2009 Walgreen Co.                13
the new walgreens com
        walgreens.com


© Copyright 2009 Walgreen Co.   14
Cost Reductions & Productivity Gains
                                   Year-over-Year Percent Increase
 20%
                                                                           Gross Profit
 15%

                                                                                        SG&A
 10%


   5%


   0%

                   2004              2005               2006              2007              2008              2009

                       SG&A adjusted for restructuring and restructuring-related costs in 1Q, 2Q, 3Q and 4Q 2009
                       Gross Profit adjusted for restructuring and restructuring-related costs in 2Q, 3Q, and 4Q 2009

© Copyright 2009 Walgreen Co.                                  15
© Copyright 2009 Walgreen Co.   16
4Q and FY09
                                Financial Review

                                 Wade Miquelon
                                  Executive VP and CFO


© Copyright 2009 Walgreen Co.              17
Fourth Quarter Highlights
                                                            4Q08                              4Q09
    Net Sales                                                8.8%                             7.6%
    Net Earnings                                           11.7%                             (1.5%)
    EPS (Diluted)                                          $0.45                            $0.44*
    Prescriptions Sales ($)                                  7.9%                             9.0%
    Total Prescriptions (#)                                  4.9%**                           9.1%**
       p
    Comparable
        Prescription Sales                                   2.0%                             4.5%
        Front-end Sales                                      3.7%                            (1.4%)
        Total Sales                                          2.6%
                                                             2 6%                             2.4%
                                                                                              2 4%
        Rx Scripts                                           1.1%***                          5.9%***
   *Includes $.03 per share, diluted, of restructuring and restructuring-related costs.
   **Includes
   **I l d 111 b i 4Q08 and 136 b i 4Q09 positive i
               bp in      d     bp in       iti impact d t more patients filli 90 d prescriptions
                                                     t due to     ti t filling 90-day     i ti
   ***Includes 118 bp in 4Q08 and 179 bp in 4Q09 positive impact due to more patients filling 90-day prescriptions
© Copyright 2009 Walgreen Co.                               18
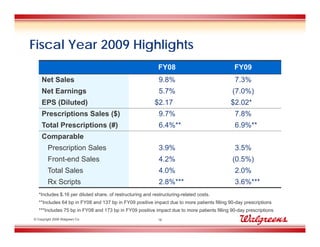
Fiscal Year 2009 Highlights
                                                             FY08                             FY09
    Net Sales                                                9.8%                             7.3%
    Net Earnings                                             5.7%                            (7.0%)
    EPS (Diluted)                                          $2.17                             $2.02*
    Prescriptions Sales ($)                                  9.7%                             7.8%
    Total Prescriptions (#)                                  6.4%**                           6.9%**
       p
    Comparable
        Prescription Sales                                   3.9%                             3.5%
        Front-end Sales                                      4.2%                            (0.5%)
        Total Sales                                          4.0%
                                                             4 0%                             2.0%
                                                                                              2 0%
        Rx Scripts                                           2.8%***                          3.6%***
   *Includes $.16 per diluted share, of restructuring and restructuring-related costs.
   **Includes
   **I l d 64 b i FY08 and 137 b i FY09 positive i
              bp in      d     bp in       iti impact d t more patients filli 90 d prescriptions
                                                    t due to     ti t filling 90-day     i ti
   ***Includes 75 bp in FY08 and 173 bp in FY09 positive impact due to more patients filling 90-day prescriptions
© Copyright 2009 Walgreen Co.                               19
Gross Profit Margin
                                4Q08         4Q09       Change
    Gross Profit Margin         27.6%        27.7%      +10 bps


   Margin impacts
    + Positively impacted by retail pharmacy margins due
      to generics
         g

           - Partially offset by non-retail businesses, and lower
             FE margins d e to prod ct mi LIFO and
                           due product mix,
             restructuring and restructuring-related costs


© Copyright 2009 Walgreen Co.           20
Percent Increase in SG&A Dollars
Two-year Stacked
  30%           28.0%
                                 25.5%
                                     %    24.9%
  25%                                                   23.4%
                10.0%
  20%                            11.2%    10.2%          8.0%         18.6%
                                                                                    16.9%
                                                                                    16 9%         17.6%
                                                                                                  17 6%
  15%                                                                   8.6%                                    14.1%
                                                                                      5.7%          7.4%

  10%                                                                                                              6.1%
                18.0%
                18 0%
                                 14.3%    14.7%         15.4%
    5%                                                                 10.0%         11.2%         10.2%
                                                                                                                   8.0%

    0%
               1Q07              2Q07     3Q07          4Q07          1Q08           2Q08          3Q08          4Q08
               +1Q08             +2Q08    +3Q08         +4Q08         +1Q09          +2Q09         +3Q09         +4Q09

Note: SG&A data adjusted for vacation accrual in 4Q08 and restructuring and restructuring-related costs in 1Q, 2Q, 3Q and 4Q 2009.

 © Copyright 2009 Walgreen Co.                                 21
Rewire for Growth on Target
   $500 million pre-tax savings in FY10
   $1 billion pre-tax savings in FY11
                                1Q09                   2Q09                   3Q09                   4Q09

    Savings                      $.01                   $.02                   $.06                   $.07

    Costs*                      ($.01)                 ($.06)                 ($.06)                 ($.03)

    Net
                                 $.00                  ($.04)                  $.00                   $.04
    Savings
   *Restructuring and restructuring-related charges include impact of CCR markdown activity on gross profit margin
    Restructuring


© Copyright 2009 Walgreen Co.                             22
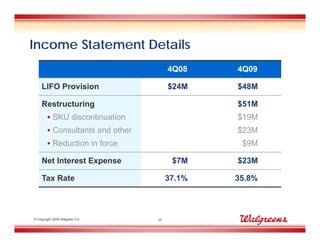
Income Statement Details
                                       4Q08    4Q09

    LIFO Provision                     $24M    $48M

                g
    Restructuring                              $51M
         SKU discontinuation                  $19M
         Consultants and other                $23M
         Reduction in force                    $9M

    Net Interest Expense                $7M    $23M

    Tax Rate                           37.1%   35.8%


© Copyright 2009 Walgreen Co.     23
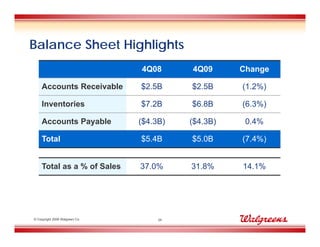
Balance Sheet Highlights
                                4Q08      4Q09      Change

    Accounts Receivable         $2.5B     $2.5B     (1.2%)

    Inventories                 $7.2B     $6.8B     (
                                                    (6.3%)
                                                         )

    Accounts Payable            ($4.3B)   ($4.3B)    0.4%

    Total                       $5.4B
                                $5 4B     $5.0B
                                          $5 0B     (7.4%)
                                                    (7 4%)


    Total as a % of Sales       37.0%     31.8%     14.1%


© Copyright 2009 Walgreen Co.        24
FIFO Inventory Trends

                                   4Q08              1Q09    2Q09     3Q09      4Q09

     Percent
     Change Total                   7.2%             10.0%   4.6%     (0.3%)   (3.5%)
     Inventory
     I    t

     Percent
     C
     Change Total
          g
                                  (2.2%)
                                  (2 2%)             0.1%
                                                     0 1%    (4.0%)
                                                             (4 0%)   (9.1%)
                                                                      (9 1%)   (11.1%)
                                                                               (11 1%)
     Inventory per
     Store*
   *Total FIFO inventory/total drugstore locations
    Total


© Copyright 2009 Walgreen Co.                           25
Net Cash
                                        1Q09                  2Q09             3Q09                  4Q09

Cash                                    $886                  $909            $2,300                $2,087

Short Term
                                           –                  $650              $100                  $500
Investments

Short Term Debt                        $1,081                  $12               $10                      $15

Long Term Debt                         $1,337                 $2,332          $2,338                $2,336


Net Cash*                          ($1,532M)              ($785M)                $52M                $236M


   *Net cash = cash and cash-equivalents plus short-term investments less short-term and long-term debt

© Copyright 2009 Walgreen Co.                            26
Capital Expenditures
                                Dollars in Billions

                                   FY08           FY09       FY10E

    New Stores                      $1.6              $1.4   lower

    Existing Stores                 $0.3              $0.2   higher

    DCs                             $0.1
                                    $0 1              $0.1
                                                      $0 1   lower

    IT & Other                      $0.2              $0.2   higher

    Total
    T t l                           $2.2
                                    $2 2              $1.9
                                                      $1 9    ~$1.6
                                                               $1 6


© Copyright 2009 Walgreen Co.              27
Cash Flow ($ in Millions)
                          Cash Flow
                       from Operations                                   Free Cash Flow
                (From St t
                (F    Statements of Cash Flows)
                              t f C h Fl      )                 (FCF=Cash Flow from Operations – C E )
                                                                (FCF C h Fl    f    O    ti      CapEx)
1,500                                                   1,500
                                           2009

1,000                                                   1,000
                                                                                             2009

                                       2008
 500                                                     500


                                                                                               2008
    0                                                       0


 -500                                                    -500
               1Q                2Q   3Q      4Q                    1Q       2Q       3Q        4Q

 © Copyright 2009 Walgreen Co.                     28
The Road Ahead
  Opportunities
   – Executing our 3 core strategies
   – Significant growth and share gain
   – Aggressively investing in business model

  Challenges... Our Next Opportunities
   – Reimbursement pressure continues
   – Economic uncertainty


© Copyright 2009 Walgreen Co.   29
Questions & Answers
                          Q   ti      A


© Copyright 2009 Walgreen Co.      30
© Copyright 2009 Walgreen Co.   31
Appendix
© Copyright 2009 Walgreen Co.      32
Calculation of Adjusted SG&A:
     Restructuring
     Restr ct ring and Restructuring-Related Costs
                       Restr ct ring Related
                                                   Dollars in Millions
                                               1Q08             1Q09

            SGA under GAAP                     $ 3,193          $ 3,482
            Less: Restructuring and
                               g
            Restructuring-related Costs        $      -         $    14


            Adjusted SGA                       $ 3,193          $ 3,468


            Adjusted YOY % Increase                              8.6%


© Copyright 2009 Walgreen Co.             33
Calculation of Adjusted Gross Profit:
     Restructuring
     Restr ct ring and Restructuring-Related Costs
                       Restr ct ring Related
                                                   Dollars in Millions
                                               2Q08             2Q09

            Gross Profit under GAAP            $ 4,442          $ 4,657
            Plus: Restructuring and
                               g
            Restructuring-related Costs        $      -         $    11


            Adjusted Gross Profit              $ 4,442          $ 4,668


            Adjusted YOY % Increase                              5.1%


© Copyright 2009 Walgreen Co.             34
Calculation of Adjusted SG&A:
     Restructuring
     Restr ct ring and Restructuring-Related Costs
                       Restr ct ring Related
                                                   Dollars in Millions
                                               2Q08             2Q09

            SGA under GAAP                     $ 3,354          $ 3,627
            Less: Restructuring and
                               g
            Restructuring-related Costs        $      -         $    82


            Adjusted SGA                       $ 3,354          $ 3,545


            Adjusted YOY % Increase                              5.7%


© Copyright 2009 Walgreen Co.             35
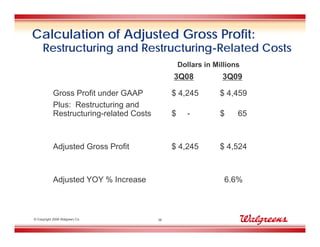
Calculation of Adjusted Gross Profit:
     Restructuring
     Restr ct ring and Restructuring-Related Costs
                       Restr ct ring Related
                                                   Dollars in Millions
                                               3Q08             3Q09

            Gross Profit under GAAP            $ 4,245          $ 4,459
            Plus: Restructuring and
                               g
            Restructuring-related Costs        $      -         $    65


            Adjusted Gross Profit              $ 4,245          $ 4,524


            Adjusted YOY % Increase                              6.6%


© Copyright 2009 Walgreen Co.             36
Calculation of Adjusted SG&A:
     Restructuring
     Restr ct ring and Restructuring-Related Costs
                       Restr ct ring Related
                                                   Dollars in Millions
                                               3Q08             3Q09

            SGA under GAAP                     $ 3,331          $ 3,613
            Less: Restructuring and
                               g
            Restructuring-related Costs        $      -         $    34


            Adjusted SGA                       $ 3,331          $ 3,579


            Adjusted YOY % Increase                              7.4%


© Copyright 2009 Walgreen Co.             37
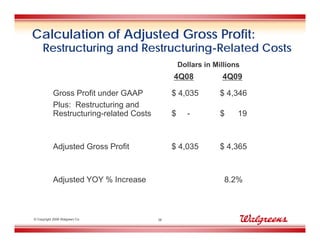
Calculation of Adjusted Gross Profit:
     Restructuring
     Restr ct ring and Restructuring-Related Costs
                       Restr ct ring Related
                                                   Dollars in Millions
                                               4Q08             4Q09

            Gross Profit under GAAP            $ 4,035          $ 4,346
            Plus: Restructuring and
                               g
            Restructuring-related Costs        $      -         $    19


            Adjusted Gross Profit              $ 4,035          $ 4,365


            Adjusted YOY % Increase                              8.2%


© Copyright 2009 Walgreen Co.             38
Calculation of Adjusted SG&A:
     Restructuring
     Restr ct ring and Restructuring-Related Costs
                       Restr ct ring Related
                                                   Dollars in Millions
                                               4Q08             4Q09

            SGA under GAAP                     $ 3,324          $ 3,644
            Less: Restructuring and
                               g
            Restructuring-related Costs        $      -         $    32


            Adjusted SGA                       $ 3,324          $ 3,612


            Adjusted YOY % Increase                              8.7%


© Copyright 2009 Walgreen Co.             39
Reconciliation of FIFO Inventory:

                                   4Q08       1Q09       2Q09       3Q09       4Q09

Total FIFO
                                  $8,316.3   $9,408.4   $8,742.2   $8,082.4   $8,028.7
Inventory

LIFO Provision                    $1,067.3   $1,110.5   $1,158.7   $1,191.4   $1,239.4

         O
Total LIFO
                                  $7,249.0
                                  $7 249 0   $8,297.9
                                             $8 297 9   $7,583.5
                                                        $7 583 5   $6,891.0
                                                                   $6 891 0   $6,789.3
                                                                              $6 789 3
Inventory


  © Copyright 2009 Walgreen Co.                   40
Calculation of Free Cash Flow:

                             1Q08    2Q08     3Q08      4Q08        1Q09     2Q09     3Q09     4Q09

Cash Flow from
Operations                   $390    $1,116   $985          $548    $312     $1,428   $1,519   $852
under GAAP

Capital
Expenditures                ($490)   ($553)   ($610)    ($572)      ($638)   ($454)   ($442)   ($393)
under GAAP

Free Cash Flow
non-GAAP                    ($100)   $563     $375          ($24)   ($326)   $974     $1,077   $459
measure


    © Copyright 2009 Walgreen Co.                      41

More Related Content

Q3 2009 Earning Report of Walgreen Co.

  • 1. 4th Quarter and Fiscal Year 2009 Conference Call September 29, 2009 © Copyright 2009 Walgreen Co. 1
  • 2. Fourth Quarter and Fiscal Year 2009 Agenda  Introduction Rick Hans & Safe Harbor Divisional VP - IR & Finance  4Q and FY Highlights Greg Wasson & Strategies Update President & CEO  4Q and FY Financials Wade Miquelon Executive Vice President & CFO  Questions & Answers All © Copyright 2009 Walgreen Co. 2
  • 3. Safe Harbor  Certain statements and projections of future results made in this presentation f t lt d i thi t ti constitute forward-looking information that is based on current market, competitive and regulatory expectations that involve risk and uncertainty.  Please see our latest Forms 10-K and 10-Q for a discussion of factors as they relate to forward-looking statements. © Copyright 2009 Walgreen Co. 3
  • 4. 4Q and FY09 Highlights & Strategies Update Greg Wasson President & CEO © Copyright 2009 Walgreen Co. 4
  • 5. Fourth Quarter Highlights In $ Millions except EPS 4Q08 4Q09 Change Net Sales $14,597 $15,703 7.6% Net Earnings $443 $436* (1.5%) EPS, diluted $0.45 $0.44* (2.2%) Cash From Operations $548 $852 55.5% * Includes $33 million after-tax, or $.03 per diluted share, restructuring and restructuring-related costs. © Copyright 2009 Walgreen Co. 5
  • 6. Fiscal 2009 Highlights In $ Millions except EPS FY08 FY09 Change Net Sales $59,034 $63,335 7.3% Net Earnings $2,157 $2,006* (7.0%) EPS, diluted $2.17 $2.02* (6.9%) Cash From Operations $3,039 $4,111 35.3% * Includes $163 million after-tax, or $.16 per diluted share, restructuring and restructuring-related costs. © Copyright 2009 Walgreen Co. 6
  • 7. On the Frontlines of Healthcare  Healthcare Reform  Support need for healthcare reform  Focus on prevention and wellness  Employer funded medical coverage critical Employer-funded  Provider of quality, affordable, accessible healthcare with 68,000 health professionals  Update on flu season  16 000 16,000 certified immunizers  Significant growth in seasonal flu shots  Positioned for H1N1 pandemic © Copyright 2009 Walgreen Co. 7
  • 8. Taking Walgreen Co. to the Market Co  Platforms in place  7,000 drugstores  Specialty pharmacy and infusion  700 worksite health centers and retail clinics  Direct-to-employer/government/MCO/PBM  Caterpillar – Proprietary, transparent price list  Direct-to-consumer  Prescription Savings Club – nearly 2M members © Copyright 2009 Walgreen Co. 8
  • 9. Consumers Respond to 90-Day at Retail % of 90-Day Prescriptions  Promotes choice 5.0% 4.5%  Drives adherence 4.0%  Increases compliance 3.5%  Improves outcomes 3.0% 2.5%  Lowers costs 2.0% 2005 2006 2007 2008 2009 % = (# of 90-day Rx/(# of 30-day + 90-day Rx))x100 © Copyright 2009 Walgreen Co. 9
  • 10. Leveraging & Enhancing Our Core Business Slowing store openings Re-inventing the customer experience Transforming community pharmacy Expanding health & wellness Expanding specialty pharmacy Broadening & deepening g p g payor relationships Rewiring for growth © Copyright 2009 Walgreen Co. 10
  • 11. Projected Net New Store Openings 12% 10% Estimated 8% 6% 3% Growth 4% 2% 0% 2007 2008 2009 2010 2011 New store openings include new and relocated stores © Copyright 2009 Walgreen Co. 11
  • 12. SG&A Growth Declining Ahead of Slowing Store Growth Store Added (including On-Site and 700 25% e Walgreen Rx Only stores) 600 20% 500 SG&A Growth Rate y 400 15% 300 10% ns 200 5% 100 es 0 0% FY99 FY00 FY01 FY02 FY03 FY04 FY05 FY06 FY07 FY08 FY09 Organic g Acquired q Adjusted for restructuring and restructuring-related costs © Copyright 2009 Walgreen Co. 12
  • 13. Reinventing the Customer Experience  4Q09 Milestones – Rolling out CCR in 400 Texas stores – Rolling out convenience offering of beer and wine – Re launched walgreens com Re-launched walgreens.com 2008 2009 2010 3Q09 – Apr/May Fall ’09 – Sep/Oct 09 Calendar 2010  35-store CCR pilot  CCR rollout in TX markets  CCR rollout nationwide  Category optimization  Begin beer and wine rollout  Loyalty initiative pilot  Inventory improvements  Re-launched Walgreens.com © Copyright 2009 Walgreen Co. 13
  • 14. the new walgreens com walgreens.com © Copyright 2009 Walgreen Co. 14
  • 15. Cost Reductions & Productivity Gains Year-over-Year Percent Increase 20% Gross Profit 15% SG&A 10% 5% 0% 2004 2005 2006 2007 2008 2009 SG&A adjusted for restructuring and restructuring-related costs in 1Q, 2Q, 3Q and 4Q 2009 Gross Profit adjusted for restructuring and restructuring-related costs in 2Q, 3Q, and 4Q 2009 © Copyright 2009 Walgreen Co. 15
  • 16. © Copyright 2009 Walgreen Co. 16
  • 17. 4Q and FY09 Financial Review Wade Miquelon Executive VP and CFO © Copyright 2009 Walgreen Co. 17
  • 18. Fourth Quarter Highlights 4Q08 4Q09 Net Sales 8.8% 7.6% Net Earnings 11.7% (1.5%) EPS (Diluted) $0.45 $0.44* Prescriptions Sales ($) 7.9% 9.0% Total Prescriptions (#) 4.9%** 9.1%** p Comparable Prescription Sales 2.0% 4.5% Front-end Sales 3.7% (1.4%) Total Sales 2.6% 2 6% 2.4% 2 4% Rx Scripts 1.1%*** 5.9%*** *Includes $.03 per share, diluted, of restructuring and restructuring-related costs. **Includes **I l d 111 b i 4Q08 and 136 b i 4Q09 positive i bp in d bp in iti impact d t more patients filli 90 d prescriptions t due to ti t filling 90-day i ti ***Includes 118 bp in 4Q08 and 179 bp in 4Q09 positive impact due to more patients filling 90-day prescriptions © Copyright 2009 Walgreen Co. 18
  • 19. Fiscal Year 2009 Highlights FY08 FY09 Net Sales 9.8% 7.3% Net Earnings 5.7% (7.0%) EPS (Diluted) $2.17 $2.02* Prescriptions Sales ($) 9.7% 7.8% Total Prescriptions (#) 6.4%** 6.9%** p Comparable Prescription Sales 3.9% 3.5% Front-end Sales 4.2% (0.5%) Total Sales 4.0% 4 0% 2.0% 2 0% Rx Scripts 2.8%*** 3.6%*** *Includes $.16 per diluted share, of restructuring and restructuring-related costs. **Includes **I l d 64 b i FY08 and 137 b i FY09 positive i bp in d bp in iti impact d t more patients filli 90 d prescriptions t due to ti t filling 90-day i ti ***Includes 75 bp in FY08 and 173 bp in FY09 positive impact due to more patients filling 90-day prescriptions © Copyright 2009 Walgreen Co. 19
  • 20. Gross Profit Margin 4Q08 4Q09 Change Gross Profit Margin 27.6% 27.7% +10 bps  Margin impacts + Positively impacted by retail pharmacy margins due to generics g - Partially offset by non-retail businesses, and lower FE margins d e to prod ct mi LIFO and due product mix, restructuring and restructuring-related costs © Copyright 2009 Walgreen Co. 20
  • 21. Percent Increase in SG&A Dollars Two-year Stacked 30% 28.0% 25.5% % 24.9% 25% 23.4% 10.0% 20% 11.2% 10.2% 8.0% 18.6% 16.9% 16 9% 17.6% 17 6% 15% 8.6% 14.1% 5.7% 7.4% 10% 6.1% 18.0% 18 0% 14.3% 14.7% 15.4% 5% 10.0% 11.2% 10.2% 8.0% 0% 1Q07 2Q07 3Q07 4Q07 1Q08 2Q08 3Q08 4Q08 +1Q08 +2Q08 +3Q08 +4Q08 +1Q09 +2Q09 +3Q09 +4Q09 Note: SG&A data adjusted for vacation accrual in 4Q08 and restructuring and restructuring-related costs in 1Q, 2Q, 3Q and 4Q 2009. © Copyright 2009 Walgreen Co. 21
  • 22. Rewire for Growth on Target  $500 million pre-tax savings in FY10  $1 billion pre-tax savings in FY11 1Q09 2Q09 3Q09 4Q09 Savings $.01 $.02 $.06 $.07 Costs* ($.01) ($.06) ($.06) ($.03) Net $.00 ($.04) $.00 $.04 Savings *Restructuring and restructuring-related charges include impact of CCR markdown activity on gross profit margin Restructuring © Copyright 2009 Walgreen Co. 22
  • 23. Income Statement Details 4Q08 4Q09 LIFO Provision $24M $48M g Restructuring $51M  SKU discontinuation $19M  Consultants and other $23M  Reduction in force $9M Net Interest Expense $7M $23M Tax Rate 37.1% 35.8% © Copyright 2009 Walgreen Co. 23
  • 24. Balance Sheet Highlights 4Q08 4Q09 Change Accounts Receivable $2.5B $2.5B (1.2%) Inventories $7.2B $6.8B ( (6.3%) ) Accounts Payable ($4.3B) ($4.3B) 0.4% Total $5.4B $5 4B $5.0B $5 0B (7.4%) (7 4%) Total as a % of Sales 37.0% 31.8% 14.1% © Copyright 2009 Walgreen Co. 24
  • 25. FIFO Inventory Trends 4Q08 1Q09 2Q09 3Q09 4Q09 Percent Change Total 7.2% 10.0% 4.6% (0.3%) (3.5%) Inventory I t Percent C Change Total g (2.2%) (2 2%) 0.1% 0 1% (4.0%) (4 0%) (9.1%) (9 1%) (11.1%) (11 1%) Inventory per Store* *Total FIFO inventory/total drugstore locations Total © Copyright 2009 Walgreen Co. 25
  • 26. Net Cash 1Q09 2Q09 3Q09 4Q09 Cash $886 $909 $2,300 $2,087 Short Term – $650 $100 $500 Investments Short Term Debt $1,081 $12 $10 $15 Long Term Debt $1,337 $2,332 $2,338 $2,336 Net Cash* ($1,532M) ($785M) $52M $236M *Net cash = cash and cash-equivalents plus short-term investments less short-term and long-term debt © Copyright 2009 Walgreen Co. 26
  • 27. Capital Expenditures Dollars in Billions FY08 FY09 FY10E New Stores $1.6 $1.4 lower Existing Stores $0.3 $0.2 higher DCs $0.1 $0 1 $0.1 $0 1 lower IT & Other $0.2 $0.2 higher Total T t l $2.2 $2 2 $1.9 $1 9 ~$1.6 $1 6 © Copyright 2009 Walgreen Co. 27
  • 28. Cash Flow ($ in Millions) Cash Flow from Operations Free Cash Flow (From St t (F Statements of Cash Flows) t f C h Fl ) (FCF=Cash Flow from Operations – C E ) (FCF C h Fl f O ti CapEx) 1,500 1,500 2009 1,000 1,000 2009 2008 500 500 2008 0 0 -500 -500 1Q 2Q 3Q 4Q 1Q 2Q 3Q 4Q © Copyright 2009 Walgreen Co. 28
  • 29. The Road Ahead  Opportunities – Executing our 3 core strategies – Significant growth and share gain – Aggressively investing in business model  Challenges... Our Next Opportunities – Reimbursement pressure continues – Economic uncertainty © Copyright 2009 Walgreen Co. 29
  • 30. Questions & Answers Q ti A © Copyright 2009 Walgreen Co. 30
  • 31. © Copyright 2009 Walgreen Co. 31
  • 32. Appendix © Copyright 2009 Walgreen Co. 32
  • 33. Calculation of Adjusted SG&A: Restructuring Restr ct ring and Restructuring-Related Costs Restr ct ring Related Dollars in Millions 1Q08 1Q09 SGA under GAAP $ 3,193 $ 3,482 Less: Restructuring and g Restructuring-related Costs $ - $ 14 Adjusted SGA $ 3,193 $ 3,468 Adjusted YOY % Increase 8.6% © Copyright 2009 Walgreen Co. 33
  • 34. Calculation of Adjusted Gross Profit: Restructuring Restr ct ring and Restructuring-Related Costs Restr ct ring Related Dollars in Millions 2Q08 2Q09 Gross Profit under GAAP $ 4,442 $ 4,657 Plus: Restructuring and g Restructuring-related Costs $ - $ 11 Adjusted Gross Profit $ 4,442 $ 4,668 Adjusted YOY % Increase 5.1% © Copyright 2009 Walgreen Co. 34
  • 35. Calculation of Adjusted SG&A: Restructuring Restr ct ring and Restructuring-Related Costs Restr ct ring Related Dollars in Millions 2Q08 2Q09 SGA under GAAP $ 3,354 $ 3,627 Less: Restructuring and g Restructuring-related Costs $ - $ 82 Adjusted SGA $ 3,354 $ 3,545 Adjusted YOY % Increase 5.7% © Copyright 2009 Walgreen Co. 35
  • 36. Calculation of Adjusted Gross Profit: Restructuring Restr ct ring and Restructuring-Related Costs Restr ct ring Related Dollars in Millions 3Q08 3Q09 Gross Profit under GAAP $ 4,245 $ 4,459 Plus: Restructuring and g Restructuring-related Costs $ - $ 65 Adjusted Gross Profit $ 4,245 $ 4,524 Adjusted YOY % Increase 6.6% © Copyright 2009 Walgreen Co. 36
  • 37. Calculation of Adjusted SG&A: Restructuring Restr ct ring and Restructuring-Related Costs Restr ct ring Related Dollars in Millions 3Q08 3Q09 SGA under GAAP $ 3,331 $ 3,613 Less: Restructuring and g Restructuring-related Costs $ - $ 34 Adjusted SGA $ 3,331 $ 3,579 Adjusted YOY % Increase 7.4% © Copyright 2009 Walgreen Co. 37
  • 38. Calculation of Adjusted Gross Profit: Restructuring Restr ct ring and Restructuring-Related Costs Restr ct ring Related Dollars in Millions 4Q08 4Q09 Gross Profit under GAAP $ 4,035 $ 4,346 Plus: Restructuring and g Restructuring-related Costs $ - $ 19 Adjusted Gross Profit $ 4,035 $ 4,365 Adjusted YOY % Increase 8.2% © Copyright 2009 Walgreen Co. 38
  • 39. Calculation of Adjusted SG&A: Restructuring Restr ct ring and Restructuring-Related Costs Restr ct ring Related Dollars in Millions 4Q08 4Q09 SGA under GAAP $ 3,324 $ 3,644 Less: Restructuring and g Restructuring-related Costs $ - $ 32 Adjusted SGA $ 3,324 $ 3,612 Adjusted YOY % Increase 8.7% © Copyright 2009 Walgreen Co. 39
  • 40. Reconciliation of FIFO Inventory: 4Q08 1Q09 2Q09 3Q09 4Q09 Total FIFO $8,316.3 $9,408.4 $8,742.2 $8,082.4 $8,028.7 Inventory LIFO Provision $1,067.3 $1,110.5 $1,158.7 $1,191.4 $1,239.4 O Total LIFO $7,249.0 $7 249 0 $8,297.9 $8 297 9 $7,583.5 $7 583 5 $6,891.0 $6 891 0 $6,789.3 $6 789 3 Inventory © Copyright 2009 Walgreen Co. 40
  • 41. Calculation of Free Cash Flow: 1Q08 2Q08 3Q08 4Q08 1Q09 2Q09 3Q09 4Q09 Cash Flow from Operations $390 $1,116 $985 $548 $312 $1,428 $1,519 $852 under GAAP Capital Expenditures ($490) ($553) ($610) ($572) ($638) ($454) ($442) ($393) under GAAP Free Cash Flow non-GAAP ($100) $563 $375 ($24) ($326) $974 $1,077 $459 measure © Copyright 2009 Walgreen Co. 41