Q3 2011 Financial Highlights Presentaion Final
•
1 like•299 views

- Q3 2011 saw record gross billings, adjusted EBITDA, and strong free cash flow for Aimia. Gross billings increased 4.1% year-over-year to $541.8 million. - Adjusted EBITDA grew significantly by 83.5% to $104.2 million compared to Q3 2010. Free cash flow before dividends paid was $124.8 million. - For the first nine months of 2011, gross billings increased 1.1% to $1.6 billion. Adjusted EBITDA rose 25.8% to $252.7 million, driven by growth across the business.
Report
Share


Q3 2011 Financial Highlights Presentaion Final
- 1. Q3 2011 FINANCIAL HIGHLIGHTS 09 11 2011
- 2. FORWARD-LOOKING STATEMENTS Forward-looking statements are included in the following presentations. These forward-looking statements are identified by the use of terms and phrases such as “anticipate”, “believe”, “could”, “estimate”, “expect”, “intend”, “may”, “plan”, “predict”, “project”, “will”, “would”, and similar terms and phrases, including references to assumptions. Such statements may involve but are not limited to comments with respect to strategies, expectations, objectives, goals, aspirations, intentions, planned operations or future actions. Forward-looking statements, by their nature, are based on assumptions and are subject to important risks and uncertainties. Any forecasts, predictions or forward-looking statements cannot be relied upon due to, among other things, changing external events and general uncertainties of the business and its corporate structure. Results indicated in forward-looking statements may differ materially from actual results for a number of reasons, including without limitation, dependency on top accumulation partners and clients, conflicts of interest, greater than expected redemptions for rewards, regulatory matters, retail market/economic conditions, industry competition, Air Canada liquidity issues, Air Canada or travel industry disruptions, airline industry changes and increased airline costs, supply and capacity costs, unfunded future redemption costs, failure to safeguard databases and consumer privacy, consumer privacy legislation, changes to loyalty programs, seasonal nature of the business, other factors and prior performance, foreign operations, legal proceedings, reliance on key personnel, labour relations, pension liability, technological disruptions and inability to use third party software, failure to protect intellectual property rights, interest rate and currency fluctuations, leverage and restrictive covenants in current and future indebtedness, uncertainty of dividend payments, managing growth, credit ratings, as well as the other factors identified throughout this presentation and throughout Groupe Aeroplan’s public disclosure record on file with the Canadian securities regulatory authorities. The forward-looking statements contained herein represent the expectations of Groupe Aeroplan Inc, doing business as Aimia (“Aimia”) as of November 9 2011 and are subject to change. However, Aimia disclaims any intention or obligation to update or revise any forward-looking statements whether as a result of new information, future events or otherwise, except as required under applicable securities regulations. For further information, please contact Investor Relations at 416 352 3728 or trish.moran@aimia.com. Q3 2011 Financial Highlights 2
- 4. Q3 2011 CONSOLIDATED FINANCIAL HIGHLIGHTS Three Months Ended % Change September 30, Constant ($ millions except per share amounts) 2011 2010 Year Over Year Currency (4) Gross billings 541.8 520.5 4.1% 4.7% Gross billings from sale of Loyalty Units 384.7 360.1 6.8% 7.4% Total Revenue 501.4 461.5 8.6% 9.3% Cost of rewards and direct costs 283.7 322.9 (12.1%) (11.9%) Gross margin (1) 217.7 138.6 57.1% 58.7% Aimia brand launched Gross margin (%) 43.4% 30.0% 1339 bps na October 5th 2011 Depreciation and amortization 31.5 30.6 2.9% 3.6% Operating expenses 130.9 107.3 22.0% 23.8% Record Q3 Gross Billings and Operating income 55.3 0.6 na na Adjusted EBITDA Share of net (loss) of PLM (0.7) - na na Net earnings (loss) 25.1 (13.5) 286.2% na Strong Free Cash Flow Non-GAAP Adjusted EBITDA 104.2 56.8 83.5% 84.1% Adjusted EBITDA margin (%) 19.2% 10.9% 832 bps na Free Cash Flow before dividends paid 124.8 139.4 (10.5%) na (2) Free Cash Flow before dividends paid per common share 0.69 0.70 (1.4%) na Excluding One-Time Items Adjusted EBITDA Excluding impact of VAT Judgement (3) 104.2 77.8 34.0% 34.4% (1) Before depreciation and amortization. (2) Calculated as: (Free Cash Flow before common and preferred dividends paid, less preferred dividends)/ weighted average common shares outstanding. (3) Excluding the $21.0 million negative impact of the ECJ VAT Judgment recorded in the third quarter of 2010 relating to prior periods. (4) Constant Currency excludes the translation effect of foreign operations on the consolidated results. For more information on Constant Currency, please refer to Aimia’s November 9, 2011 earnings press release. Q3 2011 Financial Highlights 4
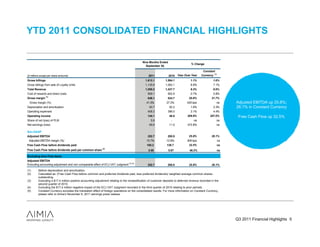
- 5. YTD 2011 CONSOLIDATED FINANCIAL HIGHLIGHTS Nine Months Ended % Change September 30, Constant ($ millions except per share amounts) 2011 2010 Year Over Year Currency (5) Gross billings 1,612.1 1,594.1 1.1% 1.6% Gross billings from sale of Loyalty Units 1,135.6 1,063.1 6.8% 7.1% Total Revenue 1,555.2 1,437.7 8.2% 8.6% Cost of rewards and direct costs 909.1 902.9 0.7% 0.8% (1) Gross margin 646.1 534.7 20.8% 21.7% Gross margin (%) 41.5% 37.2% 435 bps na Adjusted EBITDA up 25.8%; Depreciation and amortization 93.7 92.2 1.6% 2.3% 26.1% in Constant Currency Operating expenses 408.3 396.0 3.1% 4.4% Operating income 144.1 46.5 209.8% 207.0% Free Cash Flow up 32.5% Share of net (loss) of PLM 5.9 - na na Net earnings (loss) 65.6 11.5 472.8% na Non-GAAP Adjusted EBITDA 252.7 200.8 25.8% 26.1% Adjusted EBITDA margin (%) 15.7% 12.6% 308 bps na Free Cash Flow before dividends paid 185.2 139.7 32.5% na (2) Free Cash Flow before dividends paid per common share 0.98 0.67 46.3% na Excluding One-Time Items Adjusted EBITDA Excluding accounting adjustment and non-comparable effect of ECJ VAT Judgment (3) (4) 252.7 200.8 25.8% 26.1% (1) Before depreciation and amortization. (2) Calculated as: (Free Cash Flow before common and preferred dividends paid, less preferred dividends)/ weighted average common shares outstanding. (3) Excluding a $17.4 million positive accounting adjustment relating to the reclassification of customer deposits to deferred revenue recorded in the second quarter of 2010. (4) Excluding the $17.4 million negative impact of the ECJ VAT Judgment recorded in the third quarter of 2010 relating to prior periods. (5) Constant Currency excludes the translation effect of foreign operations on the consolidated results. For more information on Constant Currency, please refer to Aimia’s November 9, 2011 earnings press release. Q3 2011 Financial Highlights 5
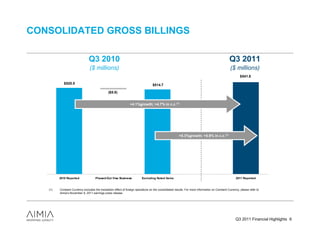
- 6. CONSOLIDATED GROSS BILLINGS Q3 2010 Q3 2011 ($ millions) ($ millions) $541.8 $520.5 $514.7 ($5.8) +4.1%growth; +4.7% in c.c.(1) +5.3%growth; +5.9% in c.c.(1) 2010 Reported Phased-Out Visa Business Excluding Noted Items 2011 Reported (1) Constant Currency excludes the translation effect of foreign operations on the consolidated results. For more information on Constant Currency, please refer to Aimia’s November 9, 2011 earnings press release. Q3 2011 Financial Highlights 6
- 7. CONSOLIDATED GROSS BILLINGS Q3 YTD 2010 Q3 YTD 2011 ($ millions) ($ millions) $1,594.1 $1,612.1 $1,576.7 $1,521.9 ($17.4) ($54.8) +2.2%growth; +2.7% in c.c.(1) +5.9%growth; +6.4% in c.c.(1) 2010 Reported Accounting Excluding Accounting Phased-Out Visa Excluding Noted 2011 Reported Adjustment (US / Adjustment Business Items EMEA) (1) Constant Currency excludes the translation effect of foreign operations on the consolidated results. For more information on Constant Currency, please refer to Aimia’s November 9, 2011 earnings press release. Q3 2011 Financial Highlights 7
- 8. CONSOLIDATED ADJUSTED EBITDA Q3 2010 Q3 2011 ($ millions) ($ millions) $2.6 $106.8 $104.2 $21.0 $87.2 $3.0 $4.5 $56.8 $1.9 +22.5%growth; +22.9% in c.c.(1) 2 0 10 R e po rt e d N e c ta r It a lia C a rls o n M a rk e t ing C o rpo ra te C o s ts V A T Lo s s ( E M E A ) E xc luding N o t e d 2 0 11 R e po rt e d R e s t ruc t uring & E xc luding N o te d La unc h C o s t s M igra t io n C o s t s It e m s R e o rga niza tio n It e m s C ha rge s Q3’10 margin(2) = 16.8% Q3’11 margin(2) = 19.7% (1) Constant Currency excludes the translation effect of foreign operations on the consolidated results. For more information on Constant Currency, please refer to Aimia’s November 9, 2011 earnings press release. (2) Adjusted EBITDA excluding noted items over reported Gross Billings Q3 2011 Financial Highlights 8
- 9. CONSOLIDATED ADJUSTED EBITDA Q3 YTD 2010 Q3 YTD 2011 ($ millions) ($ millions) $14.0 $266.7 $252.7 $17.4 $238.5 $7.2 $10.1 $20.4 $200.8 $183.4 ($17.4) +11.8%growth; +12.1% in c.c.(1) +37.8%growth; +38.1% in c.c.(1) 2 0 10 R e po r t e d A c c o un t i ng Ex c l u di n g Ne c t ar I t a l i a C a r l son M a r k e t i ng C or p or a t e C o st s VA T L oss ( EM EA ) Ex c l ud i ng N o t e d 2 0 11 R e p or t e d R e st r uc t u r i ng & Ex c l u d i n g N ot e d A d j ust m e n t ( U S / A c c o un t i ng L a u nc h C ost s M i g r a t i o n C ost s I t e ms R e o r g a n i z a t i on I t e ms EM EA ) A d j ust m e n t C ha r g e s (4) YTD’10 margin(2) = 15.1% YTD’11 margin(3) = 16.5% (1) Constant Currency excludes the translation effect of foreign operations on the consolidated results. For more information on Constant Currency, please refer to Aimia’s November 9, 2011 earnings press release. (2) Adjusted EBITDA excluding noted items over Gross Billings excluding accounting adjustment. (3) Adjusted EBITDA excluding noted items over reported Gross Billings. Q3 2011 Financial Highlights 9 (4) Includes Visa exit costs.
- 10. FREE CASH FLOW Free Cash Flow (1) FCF/ Common Share (2) ($ millions) $0.98 $185.2 $139.4 $139.7 $0.70 $0.69 $0.67 $124.8 Q3 2010 Q3 2011 YTD 2010 YTD 2011 Q3 2010 Q3 2011 YTD 2010 YTD 2011 (3) Dividends $ 26.7 $ 29.1 $ 81.4 $ 84.6 (4) Free Cash Flow $ 112.7 $ 95.8 $ 58.3 $ 100.6 (1) Free Cash Flow before common and preferred dividends paid. (2) Calculated as: (Free Cash Flow before common and preferred dividends paid, less preferred dividends)/ weighted average common shares outstanding. (3) Common and preferred dividends paid. (4) Free Cash Flow after common and preferred dividends paid. Q3 2011 Financial Highlights 10
- 11. CANADA – Q3 2011 FINANCIAL HIGHLIGHTS Three Months Ended % Change September 30, ($ millions) 2011 2010 Year Over Year Gross billings Aeroplan 278.2 268.4 3.7% Proprietary Loyalty 59.4 44.1 34.8% Strong performance Inter-company eliminations (16.8) - na at Aeroplan 320.8 312.4 2.7% and Proprietary Loyalty Total revenue Aeroplan 265.7 241.8 9.9% Double-digit growth Proprietary Loyalty 59.2 40.9 44.8% Gross Margin Inter-company eliminations (16.8) - na AEBITDA 308.2 282.8 9.0% Gross margin (1) 3.3% increase in Miles issued, Gross margin (%) 47.4% 43.8% 359 bps tracking above general Aeroplan 120.3 103.1 16.7% economic indicators, with Proprietary Loyalty 25.9 20.9 24.1% growth across all sectors 146.2 123.9 17.9% (2) Operating income Aeroplan 58.4 44.4 31.5% Proprietary Loyalty 8.0 2.6 207.6% 66.4 47.0 41.2% (2) Adjusted EBITDA Adjusted EBITDA margin (%) 31.0% 28.4% 259 bps Aeroplan 88.4 80.1 10.4% Proprietary Loyalty 11.1 8.7 27.5% 99.6 88.9 12.0% (1) Before depreciation and amortization. (2) Includes $0.8 million of restructuring costs incurred for three months ended September 30, 2011. Q3 2011 Financial Highlights 11
- 12. CANADA – YTD 2011 FINANCIAL HIGHLIGHTS Nine Months Ended % Change September 30, ($ millions) 2011 2010 Year Over Year Gross billings Aeroplan 837.0 794.4 5.4% Proprietary Loyalty 174.4 117.8 48.0% Inter-company eliminations (46.9) - na 964.5 912.2 5.7% Gross Billings up 5.7% Total revenue Aeroplan 848.9 749.9 13.2% Proprietary Loyalty 180.6 112.4 60.6% Gross margin (%) improvement Inter-company eliminations (46.9) - na of over 200bps 982.5 862.3 13.9% (1) Gross margin Adjusted EBITDA up 12.8% Gross margin (%) 44.7% 42.2% 245 bps Aeroplan 360.5 306.5 17.6% Proprietary Loyalty 78.5 57.6 36.2% 439.0 364.1 20.6% (2) Operating income Aeroplan 177.6 133.8 32.8% Proprietary Loyalty 22.8 3.1 643.4% 200.4 136.8 46.5% (2) Adjusted EBITDA Adjusted EBITDA margin (%) 28.4% 26.6% 177 bps Aeroplan 248.4 225.5 10.1% Proprietary Loyalty 25.6 17.4 46.8% 273.9 243.0 12.8% (1) Before depreciation and amortization. (2) Includes $4.2 million of restructuring costs incurred for the nine months ended September 30, 2011. Q3 2011 Financial Highlights 12
- 13. EMEA – Q3 & YTD 2011 FINANCIAL HIGHLIGHTS Three Months Ended % Change September 30, Year Over Constant Great Quarter ($ millions) 2011 2010 Year Currency (6) from EMEA Wins with existing clients in Gross Billings 139.8 123.5 13.1% 15.3% Wins Customer Loyalty and both with existing clients in Total revenue 112.9 93.1 21.2% 23.6% both Business Loyalty Gas Sainsbury’s and British and Customer Loyalty Gross margin (1) 40.7 (26.1) 255.6% 261.1% showing strong increase Business Loyalty Gross margin (%) 36.0% (28.0%) 6406 bps na Decrease in Gross Billings in quarter Operating income 5.0 (25.8) 119.6% 121.7% Decrease in Gross by the mostly explained Billings Adjusted EBITDA (2) 17.1 (12.4) 237.7% 245.2% phasing explained by the mostly out of a portion of On track to mitigate VAT Adjusted EBITDA margin (%) 12.3% (10.1%) 2234 bps na the Visa businessportion US phasing out of a in the of Nine Months Ended therepresenting $5.8MMUS Visa business in the % Change Nectar Italia: approaching representing $5.8MM September 30, 8mm members Year Over Constant ($ millions) 2011 2010 Year Currency (6) Gross Billings (3) 398.3 362.5 9.9% 11.0% Total revenue 321.0 268.5 19.6% 20.6% Gross margin (1) 106.1 32.2 229.4% 233.0% Gross margin (%) 33.0% 12.0% 2105 bps na YTD Operating income (4) (5) (6.8) (49.8) 86.4% 85.7% Adjusted EBITDA (3) (4) (5) 22.5 (20.8) 208.1% 212.1% Adjusted EBITDA margin (%) 5.6% (5.7%) 1137 bps na Gross Billings up 11% in Constant Currency (1) Before depreciation and amortization. (2) Includes the $21.0 million negative impact of the ECJ VAT Judgment recorded in the third quarter of 2010 relating to prior periods. (3) Includes a one-time $0.4 million adjustment relating to the Carlson Marketing reclassification of customer deposits to deferred revenue Solid gross margin at 33.0% recorded in the second quarter of 2010. compared to 29.6% (excluding (4) Includes $4.3 million of restructuring and reorganization costs incurred in the nine months ended September 30, 2011. (5) Includes the $17.4 million negative impact of the ECJ VAT Judgment recorded in the nine months ended September 30, 2010 relating to impact of VAT) in 2010 prior periods. (6) Constant Currency excludes the translation effect of foreign operations on the consolidated results. For more information on Constant Currency, please refer to Aimia’s November 9, 2011 earnings press release. Q3 2011 Financial Highlights 13
- 14. EMEA – ADJUSTED EBITDA Q3 2010 Q3 2011 ($ millions) ($ millions) (1) $17.1 $10.5 $21.0 +64.0%growth; +73.0% in c.c.(2) 2010 Reported Nectar Italia Launch VAT Loss Excluding Noted Items 2011 Reported Costs $1.9 ($12.4) (1) Q3 2011 Adjusted EBITDA includes the $4.9 million positive adjustment in connection with online store related activities. (2) Constant Currency excludes the translation effect of foreign operations on the consolidated results. For more information on Constant Currency, please refer to Aimia’s November 9, 2011 earnings press release. Q3 2011 Financial Highlights 14
- 15. US & APAC – Q3 & YTD 2011 FINANCIAL HIGHLIGHTS Three Months Ended % Change September 30, Constant ($ millions) 2011 2010 Year Over Year Currency (3) Wins with existing clients in both Customer Loyalty and Gross Billings 81.2 84.5 (3.9%) (3.3%) Business Loyalty Total revenue 80.3 85.6 (6.2%) (5.4%) Gross margin (1) 30.9 40.8 (24.3%) (22.3%) Decrease in Gross Billings Gross margin (%) 38.4% 47.6% (917 bps) na mostly explained by the Operating income (2) (5.0) (6.4) 21.6% 13.2% phasing out of a portion of Adjusted EBITDA (2) (1.4) (5.4) 75.1% 63.9% the Visa business in the US Adjusted EBITDA margin (%) (1.7%) (6.4%) 476 bps na representing $5.8MM Proprietary loyalty services (formerly Carlson Marketing) Nine Months Ended on track to deliver AEBITDA % Change September 30, % margin of between 6% - Constant 8%, excluding restructuring ($ millions) 2011 2010 Year Over Year Currency (3) and VISA exit costs. Gross Billings (4) 249.4 319.4 (21.9%) (20.8%) Total revenue 251.6 306.9 (18.0%) (16.9%) Gross margin (1) 101.1 138.4 (27.0%) (24.6%) Aimia Proprietary Loyalty Gross margin (%) 40.2% 45.1% (494 bps) na Services (formerly branded as Operating income (5) (14.9) (3.5) (323.0%) (349.6%) Carlson Marketing) on track to Adjusted EBITDA (4) (5) (9.2) 15.5 (158.9%) (160.5%) deliver FY2011 AEBITDA Adjusted EBITDA margin (%) (3.7%) 4.9% (854 bps) na Margin of 6% to 8% (1) Before depreciation and amortization. (excluding Restructuring and (2) Includes $1.8 million of restructuring and reorganization costs for the three months ended September 30, 2011. Visa exit costs) (3) Constant Currency excludes the translation effect of foreign operations on the consolidated results. For more information on Constant Currency, please refer to Aimia’s November 9, 2011 earnings press release. (4) Includes a one-time $17.0 million adjustment relating to the reclassification of customer deposits to deferred revenues for the nine months ended September 30, 2010. (5) Includes $5.5 million of restructuring, reorganization and Visa exit costs for the nine months ended September 30, 2011. Q3 2011 Financial Highlights 15
- 16. US & APAC – ADJUSTED EBITDA Q3 2010 Q3 2011 ($ millions) ($ millions) $0.4 $1.8 2010 Reported Carlson Marketing Excluding Noted 2011 Reported Restructuring & Excluding Noted Migration Costs Items Reorganization Items Charges ($0.9) ($1.4) +148.4% growth; +82.9% in c.c.(1) $4.5 ($5.4) (1) Constant Currency excludes the translation effect of foreign operations on the consolidated results. For more information on Constant Currency, please refer to Aimia’s November 9, 2011 earnings press release. Q3 2011 Financial Highlights 16
- 17. LIQUIDITY Balance Sheet Dividends and Distributions Paid ($ millions) ($ millions) Sept 30, 2011 Dec 31, 2010 Cash and cash equivalents $255.3 $538.6 $173 Restricted cash $14.9 $12.6 $144 Short-term investments $41.7 -- $123 Investments in Bonds $276.5 $176.9 $108 $100 $588.4 $728.1 Current portion of long-term debt $200.0 -- $26 $30 $29 Long-term debt $396.2 $643.9 Total Equity $1,474.0 $1,635.1 2006 2007 2008 2009 2010 Q1 2011 Q2 2011 Q3 2011 Distributions Common Preferred Q3 2011 Financial Highlights 17
- 18. COMMON SHARE REPURCHASE SUMMARY Average Common Shares Repurchased (MM) Common Total Price Per Initial NCIB Shares Consideration Common Average Price per Common Share Repurchased (MM) Share Total Shares Repurchased to May 13, 2011 19,983,631 $233.0 $11.66 $13.00 $13.04 13.0 $11.97 Renewed NCIB $11.54 May 16, 2011 – September 30, 2011 6,184,800 $74.9 $12.11 $10.94 Initial and Renewed NCIB Total Shares Repurchased to September 30, 26,168,431 5.4 $307.9 $11.77 2011 4.5 3.3 October 1, 2011 – November 7, 2011 78,000 $0.9 $11.54 Total Shares Repurchased 26,246,431 $308.8 $11.77 0.1 (1) (2) 2010 Q1/11 Q2/11 Q3/11 Q4/11 Total Common Shares Outstanding as at: (1) May 12 to December 31, 2010 September 30, 2011 173.8 million (2) October 1 to November 7, 2011 September 30, 2010 189.7 million Q3 2011 Financial Highlights 18
- 19. 2011 OUTLOOK The Corporation confirms the 2011 annual guidance provided in its February 24, 2011 earnings press release (as updated on August 10, 2011 with respect to the target Gross Billings growth range for the EMEA region). Based on year-to-date performance, we now expect to achieve results at the low end of the target range for Gross Billings and at the high end of the target range for Free Cash Flow. The forecasts assume no further deterioration in the Corporation’s key markets and that the Canadian operations will continue to outperform our initial plan targets for the full year. Interim operating results are subject to seasonal variations and are not indicative of our expectations for the full year. For the year ending 2011, Aimia expects to report the following on a consolidated basis: Target Range Gross Billings1 Between 4% and 6% growth Adjusted EBITDA 2 Between $355M and $365M Free Cash Flow 3, 4 Between $190M and $210M 1 The 2010 results used to calculate the target range growth rate exclude the $17.4 million positive accounting adjustment relating to the reclassification of customer deposits to deferred revenue recorded in the second quarter of 2010. 2. Within the consolidated Adjusted EBITDA target range, Carlson Marketing (as per old segmentation) is expected to generate Adjusted EBITDA margins of between 6% to 8% excluding the impact of costs associated with the phasing out of a portion of the Visa business in the US and restructuring costs related to the creation of the Aimia regional structure. 3. Free Cash Flow before dividends and excluding an anticipated net payment of $81.5 million (£50.2 million) related to the ECJ VAT Judgment, which will reduce cash from operating activities in the statement of cash flows. Upon settlement of the ECJ VAT Judgment, cash proceeds from funds held in escrow of $44.0 million (£27.1 million) and related interest of approximately $1.3 million (£0.8 million) will be classified as cash from investing activities in the statement of cash flows and will partly offset the above payment. The net cash outflow likely expected in 2012 related to the ECJ VAT Judgment, based on accrued balances at September 30, 2011, is estimated to be $36.2 million (£22.3 million). 4. The Free Cash Flow outlook range of $190 million to $210 million includes an assumption of planned incremental spend of $45 million to $65 million when compared to 2010, relating primarily to higher redemptions expected at Nectar Italia as members start reaching redemption thresholds and redemption velocity starts to accelerate, higher redemptions at Aeroplan Canada resulting from program improvements and investments made to improve member engagement, higher capital expenditures and increased cash taxes. Note that 2011 Free Cash Flow will be impacted by an additional interest payment on the Senior Secured Notes Series 3 ($7 million) and will not have the benefit of interest proceeds and prepayment charges from the Air Canada Club Loan ($16 million) received in 2010. Capital expenditures for 2011 are still expected to approximate $55 million. However, given year to date capital spending, some of the projects planned for 2011 may slip into 2012. The current income tax rate is anticipated to approximate 30 per cent in Canada, and the Corporation expects that no significant cash income taxes will be incurred in the rest of its foreign operations. For 2011, on a segmented basis, Aimia anticipates the following Gross Billings growth from its operating segments: Operating Segment As of February 24, 2011 Updated August 10, 2011 Canada Between 4% and 6% No change EMEA 5 Between 12% and 15% Between 9% and 11% US & APAC 5 Between negative 10% and negative 7% No change 5. Year over year Gross Billings reduction reflects the full year impact of US$60 million resulting from the phasing out of a portion of the overall Visa business in the US. The 2010 results used to calculate the target range growth exclude the $0.4 million (EMEA) and $17.0 million (US & APAC) positive adjustments relating to the reclassification of customer deposits to deferred revenue recorded in the second quarter of 2010. The Average Cost of Rewards per Aeroplan Mile Redeemed for 2011 is not expected to exceed 0.95 cents, with gross margin remaining relatively stable. The above excludes the effects of fluctuations in currency exchange rates. In addition, Aimia made a number of economic and market assumptions in preparing its 2011 forecasts, including assumptions regarding the performance of the economies in which the Corporation operates, market competition and tax laws applicable to the Corporation's operations. The Corporation cautions that the assumptions used to prepare the above forecasts for 2011, although reasonable at the time they were made, may prove to be incorrect or inaccurate. Accordingly, our actual results could differ materially from our expectations as set forth in this news release. The outlook provided constitutes forward-looking statements within the meaning of applicable securities laws and should be read in conjunction with the "Caution Concerning Forward-Looking Statements" section. Q3 2011 Financial Highlights 19
- 20. APPENDIX
- 21. RESTRUCTURING, REORGANIZATION, AND VISA EXIT COSTS COSTS Q3 2011 YTD 2011 ($ millions) ($ millions) Other Other Termination Onerous Restructuring Termination Onerous Restructuring Reorganization Total Reorganization Total Benefits Lease Costs Benefits Lease Costs Costs and Visa Costs Canada 0.8 - 0.8 - 0.8 Canada 4.2 - 4.2 - 4.2 EMEA - - - - - EMEA 1.5 2.3 3.8 0.5 4.3 US & APAC 1.8 - 1.8 - 1.8 US & APAC 3.6 - 3.6 1.9 5.5 TOTAL 2.6 - 2.6 - 2.6 TOTAL 9.3 2.3 11.6 2.4 14.0 Q3 2011 Financial Highlights 21
- 22. GROSS BILLINGS Three Months Ended Nine Months Ended % Change % Change September 30, September 30, Constant Constant ($ millions) 2011 2010 Year Over Year Currency (5) 2011 2010 Year Over Year Currency (5) Canada Aeroplan 278.2 268.4 3.7% 3.7% 837.0 794.4 5.4% 5.4% Proprietary Loyalty 59.4 44.1 34.8% 34.8% 174.4 117.8 48.0% 48.0% Inter-company eliminations (16.8) -- na na (46.9) -- na na 320.8 312.4 2.7% 2.7% 964.5 912.2 5.7% 5.7% (1) (2) EMEA 139.8 123.5 13.1% 15.3% 398.3 362.5 9.9% 11.0% US & APAC (3) 81.2 84.5 (3.9%) (3.3%) 249.4 319.4 (21.9%) (20.8%) Consolidated 541.8 520.5 4.1% 4.7% 1,612.1 1,594.1 1.1% 1.6% Excluding One-Time Items (4) Excluding accounting adjustment 1,612.1 1,576.7 2.2% 2.7% (1) Includes Nectar Italia Gross Billings of €12.7 million for the three month period ended September 30, 2011. (2) Includes a one-time $0.4 million adjustment relating to the Carlson Marketing reclassification of customer deposits to deferred revenue recorded in the second quarter of 2010. (3) Includes a one-time $17.0 million adjustment relating to the Carlson Marketing reclassification of customer deposits to deferred revenue recorded in the second quarter of 2010. (4) Excluding the $17.4 million positive accounting adjustment relating to the reclassification of customer deposits to deferred revenue recorded in the second quarter of 2010. (5) Constant Currency excludes the translation effect of foreign operations on the consolidated results. For more information on Constant Currency, please refer to Aimia’s November 9, 2011 earnings press release. EMEA EMEA Canada Canada 26% 25% 60% 59% Three Months Nine Months Ended September $541.8MM Ended September $1,612.1MM 30, 2011 30, 2011 US & APAC US & APAC 15% 15% Q3 2011 Financial Highlights 22
- 23. ADJUSTED EBITDA Three Months Ended Nine Months Ended % Change % Change September 30, September 30, Constant Constant ($ millions) 2011 2010 Year Over Year Currency (5) 2011 2010 Year Over Year Currency (5) Canada Aeroplan Canada 88.4 80.1 10.4% 10.4% 248.4 225.5 10.1% 10.1% Proprietary Loyalty 11.1 8.7 27.5% 27.5% 25.6 17.4 46.8% 46.8% 99.6 88.9 12.0% 12.0% 273.9 243.0 12.8% 12.8% EMEA (1) 17.1 (12.4) 237.7% 245.2% 22.5 (20.8) 208.1% 212.1% US & APAC (2) (1.4) (5.4) 75.1% 63.9% (9.2) 15.5 (158.9%) (160.5%) Corporate (11.1) (14.2) (21.6%) (21.6%) (34.6) (36.9) (6.4%) (6.4%) Consolidated (1) (2) 104.2 56.8 83.5% 84.1% 252.7 200.8 25.8% 26.1% Excluding One-Time Items Consolidated - Excluding accounting adjustment and non-comparable effect of ECJ VAT Judgement (3)(4) 104.2 77.8 34.0% 34.4% 252.7 200.8 25.8% 26.1% (1) Includes a one-time $0.4 million adjustment relating to the Carlson Marketing reclassification of customer deposits to deferred revenue recorded in the second quarter of 2010. (2) Includes a one-time $17.0 million adjustment relating to the Carlson Marketing reclassification of customer deposits to deferred revenue recorded in the second quarter of 2010. (3) Excluding the $21.0 million and the $17.4 million negative impact of the ECJ VAT Judgment recorded in the three and nine months ended September 30, 2010, respectively, relating to prior periods. (4) Excluding the $17.4 million positive accounting adjustment relating to the reclassification of customer deposits to deferred revenue recorded in the second quarter of 2010. (5) Constant Currency excludes the translation effect of foreign operations on the consolidated results. For more information on Constant Currency, please refer to Aimia’s November 9, 2011 earnings press release. Q3 2011 Financial Highlights 23
- 24. AEROPLAN – FINANCIAL HIGHLIGHTS Three Months Ended Nine Months Ended % Change % Change September 30, September 30, ($ millions) 2011 2010 Year Over Year 2011 2010 Year Over Year Gross billings 278.2 268.4 3.7% 837.0 794.4 5.4% Gross billings from sale of Loyalty Units 265.8 257.0 3.4% 799.4 757.4 5.5% Total revenue 265.7 241.8 9.9% 848.9 749.9 13.2% Cost of rewards & direct costs 145.4 138.8 4.8% 488.3 443.4 10.1% Gross margin (1) 120.3 103.1 16.7% 360.5 306.5 17.6% Gross margin (%) 45.3% 42.6% 264 bps 42.5% 40.9% 160 bps Depreciation and amortization 22.3 22.1 1.1% 66.5 66.0 0.7% Operating expenses 39.5 36.6 8.1% 116.4 106.7 9.1% Operating income 58.4 44.4 31.5% 177.6 133.8 32.8% Non-GAAP Adjusted EBITDA 88.4 80.1 10.4% 248.4 225.5 10.1% Adjusted EBITDA margin (%) 31.8% 29.9% 193 bps 29.7% 28.4% 128 bps (1) Before depreciation and amortization. Q3 2011 Financial Highlights 24
- 25. AEROPLAN – REVENUE AND MILES Revenue Breakdown Three Months Ended September 30, (in $ millions) 2011 2010 Change % Change Miles revenue 208.0 189.3 18.7 9.9% Breakage revenue 45.3 41.2 4.1 10.0% Other 12.4 11.4 1.0 8.8% Total Revenue 265.7 241.8 23.9 9.9% Aeroplan Miles Issued & Redeemed Average Selling Price & Cost (billions) (cents / mile) 21.3 20.7 1.25 1.24 17.0 15.5 0.89 0.86 Q3 2011 Q3 2010 Q3 2011 Q3 2010 Aeroplan Miles Issued Aeroplan Miles Redeemed Average Selling Price Average Cost/ Aeroplan Mile Redeemed Q3 2011 Financial Highlights 25
- 26. GROUPE AEROPLAN EUROPE(1) – FINANCIAL HIGHLIGHTS Three Months Ended Nine Months Ended % Change % Change September 30, September 30, Year Over Constant Year Over Constant ($ millions) 2011 2010 Year Currency (5) 2011 2010 Year Currency (5) Gross Billings 134.4 115.7 16.2% 18.3% 378.3 337.5 12.1% 13.1% Gross Billings from sale of Loyalty Units 118.9 103.1 15.3% 17.4% 336.2 305.6 10.0% 11.0% Total revenue 107.2 86.6 23.8% 26.1% 301.4 244.0 23.5% 24.4% Cost of rewards & direct costs 71.4 118.1 (39.5%) (38.9%) 209.3 229.4 (8.8%) (8.2%) Gross margin (2) 35.8 (31.5) 213.4% 217.3% 92.0 14.6 531.2% 536.5% Gross margin (%) 33.4% (36.4%) 6978 bps na 30.5% 6.0% 2457 bps na Depreciation and amortization 3.1 3.1 (0.2%) 1.9% 9.3 9.8 (4.8%) (2.6%) Operating expenses 27.8 (8.5) 427.7% 434.9% 85.7 55.7 54.0% 55.4% Operating income (3) 4.8 (26.2) 118.5% 120.7% (2.9) (50.8) 94.2% 93.7% Non-GAAP Adjusted EBITDA (3) 17.0 (14.5) 217.7% 224.3% 25.1 (23.3) 207.9% 210.8% Adjusted EBITDA margin (%) 12.7% (12.5%) 2516 bps na 6.6% (6.9%) 1354 bps na Excluding One-Time Items (3) (4) Adjusted EBITDA - Excluding Impact of ECJ VAT Judgment 17.0 6.5 160.1% 174.8% 25.1 (5.9) 526.7% 538.3% (1) Former operating segment of Aimia. (2) Before depreciation and amortization. (3) Includes $0.9 million of restructuring and reorganization costs incurred in the nine months ended September 30, 2011. (4) Excluding the $21.0 million and the $17.4 million negative impact of the ECJ VAT Judgment recorded in the third quarter of 2010 and nine months ended September 30, 2010, respectively, and relating to prior periods. (5) Constant Currency excludes the translation effect of foreign operations on the consolidated results. For more information on Constant Currency, please refer to Aimia’s November 9, 2011 earnings press release. Q3 2011 Financial Highlights 26
- 27. CARLSON MARKETING(1) – FINANCIAL HIGHLIGHTS Three Months Ended Nine Months Ended % Change % Change September 30, September 30, Year Over Constant Year Over Constant ($ millions) 2011 2010 Year Currency (9) 2011 2010 Year Currency (9) Gross Billings (2) 146.0 136.4 7.0% 7.5% 443.8 462.2 (4.0%) (3.0%) (3) Total revenue 145.3 133.1 9.2% 9.8% 451.9 443.8 1.8% 2.7% Cost of rewards & direct costs 83.6 66.1 26.6% 26.4% 258.4 230.1 12.3% 12.3% (4) Gross margin 61.7 67.0 (8.0%) (6.5%) 193.6 213.7 (9.4%) (7.7%) Gross margin (%) 42.4% 50.4% (792 bps) na 42.8% 48.1% (532 bps) na Depreciation and amortization 6.1 5.4 12.2% 14.9% 17.9 16.5 8.8% 11.4% Operating expenses 52.4 65.0 (19.3%) (17.2%) 171.6 196.7 (12.7%) (10.5%) Operating income (loss) 3.1 (3.4) (192.5%) (175.9%) 4.0 0.5 635.1% 444.5% Non-GAAP Adjusted EBITDA (2) (5) 9.9 5.3 86.3% 74.5% 13.8 35.5 (61.2%) (61.5%) Adjusted EBITDA margin (%) 6.8% 3.9% 289 bps na 3.1% 7.7% (457 bps) na Excluding One-Time Items (6) Gross Billings 146.0 136.4 7.0% 7.5% 443.8 444.8 (0.2%) 0.7% (6) (7) (8) Adjusted EBITDA 12.5 9.8 27.4% 21.0% 26.6 28.2 (5.7%) (6.1%) (1) Former operating segment of Aimia. (2) Includes a one-time $17.4 million positive accounting adjustment relating to the reclassification of customer deposits to deferred revenue recorded in the second quarter of 2010. (3) Total revenue includes intercompany revenues of $16.8 million and $46.9 million for three and nine months ended September 30, 2011, respectively. (4) Before depreciation and amortization. (5) Includes restructuring, reorganization and Visa exit costs of $2.6 million and $12.8 million for the three and nine months ended September 30, 2011, respectively. (6) Excluding a $17.4 million positive accounting adjustment relating to the reclassification of customer deposits to deferred revenue recorded in the second quarter of 2010. (7) Excluding $2.6 million and $12.8 million of restructuring and reorganization costs for the three and nine months ended September 30, 2011, respectively. (8) Excluding $4.5 million and $10.1 million of migration costs for the three and nine months ended September 30, 2010, respectively. (9) Constant Currency excludes the translation effect of foreign operations on the consolidated results. For more information on Constant Currency, please refer to Aimia’s November 9, 2011 earnings press release. Q3 2011 Financial Highlights 27
- 28. GROSS BILLINGS FROM SALE OF LOYALTY UNITS BY MAJOR PARTNER Q3 2011 Gross Billings Q3 2010 Gross Billings from sale of Loyalty Units from sale of Loyalty Units 20.8% 21.7% 36.2% 37.6% $384.7M $360.1M 17.1% 16.7% 9.1% 16.2% 9.2% 15.3% Partner A Partner B Partner C Air Canada Other Q3 2011 Financial Highlights 28
- 29. ADJUSTED EBITDA & FREE CASH FLOW - SEASONALITY (1) Adjusted EBITDA Free Cash Flow (2) 160 140 120 100 80 60 40 20 0 Q1 Q2 Q3 Q4 Q1 Q2 Q3 Q4 Q1 Q2 Q3 Q4 Q1 Q2 Q3 Q4 Q1 Q2 Q3 (20) 2007 2008 2009 2010 2011 (40) (60) (1) Q3 and Q4 2010 exclude the unfavourable impact of the ECJ VAT Judgment. (2) Before common and preferred dividends paid. Q3 2011 Financial Highlights 29
- 30. FOREIGN EXCHANGE RATES Period Rates Q3 2011 Q3 2010 Change % Change Period end rate £ to $ 1.6231 1.6198 0.0033 0.2% Average Quarter £ to $ 1.5757 1.6117 (0.0360) (2.2%) Average YTD £ to $ 1.5785 1.5901 (0.0116) (0.7%) Period end rate AED to $ 0.2828 0.2804 0.0024 0.9% Average Quarter AED to $ 0.2662 0.2829 (0.0167) (5.9%) Average YTD AED to $ 0.2662 0.2820 (0.0158) (5.6%) Period end rate AED to £ 0.1742 0.1731 0.0011 0.6% Average Quarter AED to £ 0.1689 0.1758 (0.0069) (3.9%) Average YTD AED to £ 0.1687 0.1775 (0.0088) (5.0%) Period end rate USD to $ 1.0389 1.0290 0.0099 1.0% Average Quarter USD to $ 0.9780 1.0395 (0.0615) (5.9%) Average YTD USD to $ 0.9775 1.0362 (0.0587) (5.7%) Period end rate € to $ 1.4039 1.4006 0.0033 0.2% Average Quarter € to $ 1.3839 1.3438 0.0401 3.0% Average YTD € to $ 1.3751 1.3639 0.0112 0.8% Q3 2011 Financial Highlights 30
- 31. THANK YOU