Location via proxy:   [ UP ]  
[Report a bug]   [Manage cookies]                
SlideShare a Scribd company logo
A fast easy-to-use tool to help anyone working within
an organization, improve their Quality Problem Solving
skills quickly and efficiently
Presented by Mark Troncone – MBA, PMP®, CBAP®, CSM®, ITIL v3®
Agenda
 What is QwikSolver™
 Where did QwikSolver™ come from
 Who can use QwikSolver™
 Why Use QwikSolver™
 When to use QwikSolver™
 How does QwikSolver™ work:
 Step 1 – Define the Issue
 Step 2 – Measure What Matters
 Step 3 – Analyze the Causes
 Step 4 – Improve the Situation
 Step 5 – Control the Future
 QwikSolver™ Template
 QwikSolver™ Example
About Me
 PMP® Certified – Project Management Institute
 CBAP® Certified – International Institute of Business Analysts
 CRM Certified SCRUM Master® – SCRUM Alliance
 ITIL v3® Foundations Certified
 MT Associates - Active Career Transition Mentor
 MBA – Management, BS – Marketing, AS - Accounting
 Work experience:
 Save the Children
 TransAct Technologies
 Starwood Hotels
 Affinion Group
 Hewitt Associates
 Wachovia Bank
 Bayer Pharmaceuticals
 Reader’s Digest
 James River Corporation
What is QwikSolver™
 QwikSolver™ is a simple, five step method that’s derived
from proven Lean Six Sigma methods.
 It is designed for use across an entire organization to
help improve problem-solving quality and speed
 The goal is to help everyone understand the through
process supported by basic Lean Six Sigma tools – and
know when and how to apply it to everyday decision-
making and problem-solving situations.
 It can be used to reason out a problem, decipher what is
causing a problem, make a decision to resolve a
problem, show data/evidence to support a decision, or
select a course of action to correct a problem.
Where did QwikSolver™ come from
 QwikSolver™ was developed by Xerox as part of their Lean
Six Sigma Initiative in 2005
 Xerox called this evolution LSS 2.0 and one of its goals was to
provide tools that people on the frontline will use to do their job
better without having to go through the formal LSS education
and Certification process
 QwikSolver™ brought the power of data-driven decision-
making to the masses, in order to help employees who are not
trained as Lean Six Sigma belts to access the tools and apply
the methodologies in day-to-day real business.
Where did QwikSolver™come from
 QwikSolver™ was designed for use across the entire
organization to help improve problem solving quality and
speed.
 Xerox believed that the use of Lean Six Sigma principles by
all employees at all levels could form the foundation of
continuous improvement throughout the organization.
 QwikSolver™ has been an internal tool at Xerox since
recently, however Xerox has started to sell the training to
customers and partners worldwide – hense, how I was
indoctrinated in it at my present position.
Who can use QwikSolver™
 Anyone in any business function or business unit
within an organization who has been trained in
QwikSolver™ - this can include:
 Individuals
 Groups
 Project Managers or Project Team Members
 Business Units
 Team Leaders
 Teams (Internal or Global)
 Non-Project or Teams
Why Use QwikSolver™
 It is easy to use - Anyone who is trained on QwikSolver™
can address simple problems related to their daily work
without having to wait for the Lean Six Sigma (Black or
Green) belts to be available or to start up a project.
 Anyone using QwikSolver™ does not have to be formally
trained in Lean Six Sigma methodologies which can be
costly to an organization.
 Anyone using QwikSolver™ does not have to take any
sort of certification test.
 It is simple to learn, flexible, easy to use and apply in
everyday business situations
Why Use QwikSolver™
 Allows organizations to provide a common method and
language for everyday problem solving.
 Addresses situations that are determined not to require a
“full blown” Lean Six Sigma Project.
 QwikSolver™ is a proven approach that uses facts and
data to solve problems.
 Establishes more confidence and credibility to your
decisions.
 Once employed and used regularly, cannot help but to
improve performance of individuals, teams, units, and
departments throughout the organization.
When to use QwikSolver™
When is using QwikSolver™ a good approach -
 When you need to make a decision or solve a problem
 When the decision or problem is of low complexity and within
the usual scope of your job/function
 The resources you need (information and data) are readily
available
 You have the authority to make the decision or solve this
problem or make a recommendation about it
If none of above are true -
 You may opt to make this problem a Project
 Go to a higher authority to help resolve
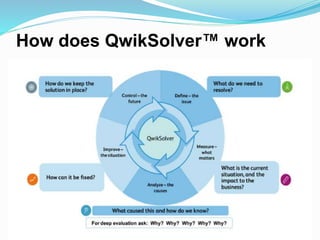
How does QwikSolver™ work
Step 1 – Define the Issue
DEFINE: What situation do we need to resolve?
 Create your Problem Statement
 The statement Must Be specific and measurable
 The statement Must avoid stating solutions or assuming
root causes.
 To be placed in the top portion of the QwikSolver™
Template
Step 1 con’t. – List the Resources
DEFINE: List the resources (information, data, people) that are
needed, and how they can be obtained.
 Base this on logic, critical thinking, experience, or discussions
with colleagues.
 A flow chart could help identify important information.
 An Organizational Chart or Department Chart could help identify
people
 A Data Dictionary, Data Documentation, Data Map showing Table
relationships.
Step 2 – Measure what Matters
MEASURE: What is the current situation, and what is the
impact to the business?
 Consider: “Who/What/When/Where/How Much”
 Quantifiable information can be displayed in such tools as:
 Histograms - graphical representation of the distribution of numerical data
 Pareto Chart - 80% of the output in a given situation or system is produced by 20% of the
input.
 Trend Charts - useful for showing how the value of one or more items changes over time
 Pie Charts - is a circular statistical graphic, which is divided into slices to illustrate numerical
proportion
 Qualitative information can be displayed in:
 Affinity Diagrams - (Brainstorming into Groups)
 Ishikawa (Fishbone) Diagrams – Shows cause-and-effect relationships
Step 3 – Analyze the Causes
ANALYZE: What caused this situation? How do we know?
 Objective information about the current situation leads you here
 Helpful tools include:
 Pareto Chart - 80/20 rule
 Ishikawa (Fishbone) Diagrams – Shows cause-and-effect relationships
 Five Why’s - is an iterative question-asking technique used to explore
the cause-and-effect relationships underlying a particular problem
 and many others
 ALWAYS share your logic and thinking.
Step 4 – Improve the Situation
IMPROVE: What is the Solution?
 This should be a collaborative effort using tools such as:
 Brainstorming - list of ideas spontaneously contributed by its
member(s)
 Nominal Group Technique - every member of the group gives their
view of the solution, with a short explanation. Then, duplicate solutions
are eliminated from the list of all solutions, and the members proceed to
rank the solutions, 1st, 2nd, 3rd, 4th, and so on.
 Group Passing Technique - Each person in a circular group writes down
one idea, and then passes the piece of paper to the next person, who adds some
thoughts. This continues until everybody gets his or her original piece of paper
back. By this time, it is likely that the group will have extensively elaborated on
each idea.
Step 4 con’t. – Improve the Situation
IMPROVE: What is the Solution?
 Team Idea Mapping Method - Each participant brainstorms
individually, then all the ideas are merged onto one large idea map.
During this consolidation phase, participants may discover a common
understanding of the issues as they share the meanings behind their
ideas. During this sharing, new ideas may arise by the association,
and they are added to the map as well. Once all the ideas are
captured, the group can prioritize and/or take action
 Brainstorming and Affinity make sure many options are
considered
 Solution selection tools exist, but essentially evaluate:
Which options best fix the root cause?
Step 5 – Control the Future
CONTROL: How do we maintain the solution and keep
it in place?
 No special tools are needed here, just hard work, good
communication, and buy-in.
 Posting the results of the solution, over time, can be helpful
to remind and motivate people to keep the solution in
place.
 Always reconsider risk at this stage: where are we now,
relative to the initial state?
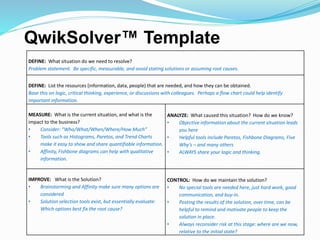
QwikSolver™ Template
DEFINE: What situation do we need to resolve?
Problem statement. Be specific, measurable, and avoid stating solutions or assuming root causes.
DEFINE: List the resources (information, data, people) that are needed, and how they can be obtained.
Base this on logic, critical thinking, experience, or discussions with colleagues. Perhaps a flow chart could help identify
important information.
MEASURE: What is the current situation, and what is the
impact to the business?
• Consider: “Who/What/When/Where/How Much”
• Tools such as Histograms, Paretos, and Trend Charts
make it easy to show and share quantifiable information.
• Affinity, Fishbone diagrams can help with qualitative
information.
ANALYZE: What caused this situation? How do we know?
• Objective information about the current situation leads
you here
• Helpful tools include Paretos, Fishbone Diagrams, Five
Why’s – and many others
• ALWAYS share your logic and thinking.
IMPROVE: What is the Solution?
• Brainstorming and Affinity make sure many options are
considered
• Solution selection tools exist, but essentially evaluate:
Which options best fix the root cause?
CONTROL: How do we maintain the solution?
• No special tools are needed here, just hard work, good
communication, and buy-in.
• Posting the results of the solution, over time, can be
helpful to remind and motivate people to keep the
solution in place.
• Always reconsider risk at this stage: where are we now,
relative to the initial state?
QwikSolver™ Example
QUESTIONS?
Tell me what you think
mtroncone73@yahoo.com

More Related Content

QUIKSOLVER

  • 1. A fast easy-to-use tool to help anyone working within an organization, improve their Quality Problem Solving skills quickly and efficiently Presented by Mark Troncone – MBA, PMP®, CBAP®, CSM®, ITIL v3®
  • 2. Agenda  What is QwikSolver™  Where did QwikSolver™ come from  Who can use QwikSolver™  Why Use QwikSolver™  When to use QwikSolver™  How does QwikSolver™ work:  Step 1 – Define the Issue  Step 2 – Measure What Matters  Step 3 – Analyze the Causes  Step 4 – Improve the Situation  Step 5 – Control the Future  QwikSolver™ Template  QwikSolver™ Example
  • 3. About Me  PMP® Certified – Project Management Institute  CBAP® Certified – International Institute of Business Analysts  CRM Certified SCRUM Master® – SCRUM Alliance  ITIL v3® Foundations Certified  MT Associates - Active Career Transition Mentor  MBA – Management, BS – Marketing, AS - Accounting  Work experience:  Save the Children  TransAct Technologies  Starwood Hotels  Affinion Group  Hewitt Associates  Wachovia Bank  Bayer Pharmaceuticals  Reader’s Digest  James River Corporation
  • 4. What is QwikSolver™  QwikSolver™ is a simple, five step method that’s derived from proven Lean Six Sigma methods.  It is designed for use across an entire organization to help improve problem-solving quality and speed  The goal is to help everyone understand the through process supported by basic Lean Six Sigma tools – and know when and how to apply it to everyday decision- making and problem-solving situations.  It can be used to reason out a problem, decipher what is causing a problem, make a decision to resolve a problem, show data/evidence to support a decision, or select a course of action to correct a problem.
  • 5. Where did QwikSolver™ come from  QwikSolver™ was developed by Xerox as part of their Lean Six Sigma Initiative in 2005  Xerox called this evolution LSS 2.0 and one of its goals was to provide tools that people on the frontline will use to do their job better without having to go through the formal LSS education and Certification process  QwikSolver™ brought the power of data-driven decision- making to the masses, in order to help employees who are not trained as Lean Six Sigma belts to access the tools and apply the methodologies in day-to-day real business.
  • 6. Where did QwikSolver™come from  QwikSolver™ was designed for use across the entire organization to help improve problem solving quality and speed.  Xerox believed that the use of Lean Six Sigma principles by all employees at all levels could form the foundation of continuous improvement throughout the organization.  QwikSolver™ has been an internal tool at Xerox since recently, however Xerox has started to sell the training to customers and partners worldwide – hense, how I was indoctrinated in it at my present position.
  • 7. Who can use QwikSolver™  Anyone in any business function or business unit within an organization who has been trained in QwikSolver™ - this can include:  Individuals  Groups  Project Managers or Project Team Members  Business Units  Team Leaders  Teams (Internal or Global)  Non-Project or Teams
  • 8. Why Use QwikSolver™  It is easy to use - Anyone who is trained on QwikSolver™ can address simple problems related to their daily work without having to wait for the Lean Six Sigma (Black or Green) belts to be available or to start up a project.  Anyone using QwikSolver™ does not have to be formally trained in Lean Six Sigma methodologies which can be costly to an organization.  Anyone using QwikSolver™ does not have to take any sort of certification test.  It is simple to learn, flexible, easy to use and apply in everyday business situations
  • 9. Why Use QwikSolver™  Allows organizations to provide a common method and language for everyday problem solving.  Addresses situations that are determined not to require a “full blown” Lean Six Sigma Project.  QwikSolver™ is a proven approach that uses facts and data to solve problems.  Establishes more confidence and credibility to your decisions.  Once employed and used regularly, cannot help but to improve performance of individuals, teams, units, and departments throughout the organization.
  • 10. When to use QwikSolver™ When is using QwikSolver™ a good approach -  When you need to make a decision or solve a problem  When the decision or problem is of low complexity and within the usual scope of your job/function  The resources you need (information and data) are readily available  You have the authority to make the decision or solve this problem or make a recommendation about it If none of above are true -  You may opt to make this problem a Project  Go to a higher authority to help resolve
  • 12. Step 1 – Define the Issue DEFINE: What situation do we need to resolve?  Create your Problem Statement  The statement Must Be specific and measurable  The statement Must avoid stating solutions or assuming root causes.  To be placed in the top portion of the QwikSolver™ Template
  • 13. Step 1 con’t. – List the Resources DEFINE: List the resources (information, data, people) that are needed, and how they can be obtained.  Base this on logic, critical thinking, experience, or discussions with colleagues.  A flow chart could help identify important information.  An Organizational Chart or Department Chart could help identify people  A Data Dictionary, Data Documentation, Data Map showing Table relationships.
  • 14. Step 2 – Measure what Matters MEASURE: What is the current situation, and what is the impact to the business?  Consider: “Who/What/When/Where/How Much”  Quantifiable information can be displayed in such tools as:  Histograms - graphical representation of the distribution of numerical data  Pareto Chart - 80% of the output in a given situation or system is produced by 20% of the input.  Trend Charts - useful for showing how the value of one or more items changes over time  Pie Charts - is a circular statistical graphic, which is divided into slices to illustrate numerical proportion  Qualitative information can be displayed in:  Affinity Diagrams - (Brainstorming into Groups)  Ishikawa (Fishbone) Diagrams – Shows cause-and-effect relationships
  • 15. Step 3 – Analyze the Causes ANALYZE: What caused this situation? How do we know?  Objective information about the current situation leads you here  Helpful tools include:  Pareto Chart - 80/20 rule  Ishikawa (Fishbone) Diagrams – Shows cause-and-effect relationships  Five Why’s - is an iterative question-asking technique used to explore the cause-and-effect relationships underlying a particular problem  and many others  ALWAYS share your logic and thinking.
  • 16. Step 4 – Improve the Situation IMPROVE: What is the Solution?  This should be a collaborative effort using tools such as:  Brainstorming - list of ideas spontaneously contributed by its member(s)  Nominal Group Technique - every member of the group gives their view of the solution, with a short explanation. Then, duplicate solutions are eliminated from the list of all solutions, and the members proceed to rank the solutions, 1st, 2nd, 3rd, 4th, and so on.  Group Passing Technique - Each person in a circular group writes down one idea, and then passes the piece of paper to the next person, who adds some thoughts. This continues until everybody gets his or her original piece of paper back. By this time, it is likely that the group will have extensively elaborated on each idea.
  • 17. Step 4 con’t. – Improve the Situation IMPROVE: What is the Solution?  Team Idea Mapping Method - Each participant brainstorms individually, then all the ideas are merged onto one large idea map. During this consolidation phase, participants may discover a common understanding of the issues as they share the meanings behind their ideas. During this sharing, new ideas may arise by the association, and they are added to the map as well. Once all the ideas are captured, the group can prioritize and/or take action  Brainstorming and Affinity make sure many options are considered  Solution selection tools exist, but essentially evaluate: Which options best fix the root cause?
  • 18. Step 5 – Control the Future CONTROL: How do we maintain the solution and keep it in place?  No special tools are needed here, just hard work, good communication, and buy-in.  Posting the results of the solution, over time, can be helpful to remind and motivate people to keep the solution in place.  Always reconsider risk at this stage: where are we now, relative to the initial state?
  • 19. QwikSolver™ Template DEFINE: What situation do we need to resolve? Problem statement. Be specific, measurable, and avoid stating solutions or assuming root causes. DEFINE: List the resources (information, data, people) that are needed, and how they can be obtained. Base this on logic, critical thinking, experience, or discussions with colleagues. Perhaps a flow chart could help identify important information. MEASURE: What is the current situation, and what is the impact to the business? • Consider: “Who/What/When/Where/How Much” • Tools such as Histograms, Paretos, and Trend Charts make it easy to show and share quantifiable information. • Affinity, Fishbone diagrams can help with qualitative information. ANALYZE: What caused this situation? How do we know? • Objective information about the current situation leads you here • Helpful tools include Paretos, Fishbone Diagrams, Five Why’s – and many others • ALWAYS share your logic and thinking. IMPROVE: What is the Solution? • Brainstorming and Affinity make sure many options are considered • Solution selection tools exist, but essentially evaluate: Which options best fix the root cause? CONTROL: How do we maintain the solution? • No special tools are needed here, just hard work, good communication, and buy-in. • Posting the results of the solution, over time, can be helpful to remind and motivate people to keep the solution in place. • Always reconsider risk at this stage: where are we now, relative to the initial state?
  • 21. QUESTIONS? Tell me what you think mtroncone73@yahoo.com