Result of Baseline Study of Selected Sector Industries to assess the Potentials for more Efficient use of Energy in Nepal
•Download as PPTX, PDF•
1 like•3,076 views

Nepalese industries offer a huge potential to cut production cost by using energy more efficiently. It is estimated that around 15% of electrical and 30% of thermal energy could be saved in eight energy intensive industrial sector. This presentation contains the result of a study conducted by German Development Cooperation (GIZ) among 200 Nepalese industries in 2012.
Report
Share


Result of Baseline Study of Selected Sector Industries to assess the Potentials for more Efficient use of Energy in Nepal
- 1. Result of Baseline Study of Selected Sector Industries to assess the Potentials for more Efficient use of Energy Gyanendra P. Upadhyay Local Long Term Expert, Energy Efficiency
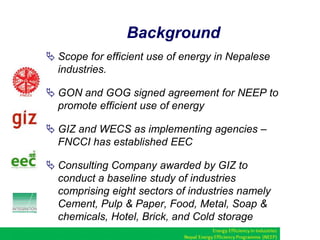
- 2. Background Scope for efficient use of energy in Nepalese industries. GON and GOG signed agreement for NEEP to promote efficient use of energy GIZ and WECS as implementing agencies – FNCCI has established EEC Consulting Company awarded by GIZ to conduct a baseline study of industries comprising eight sectors of industries namely Cement, Pulp & Paper, Food, Metal, Soap & chemicals, Hotel, Brick, and Cold storage
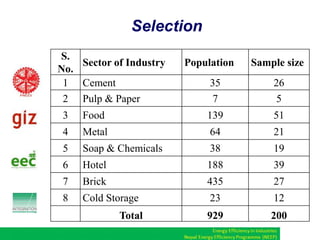
- 3. Selection S. Sector of Industry No. 1 Cement 2 Pulp & Paper Population Sample size 35 7 26 5 3 Food 139 51 4 Metal 64 21 5 Soap & Chemicals 38 19 6 Hotel 188 39 7 Brick 435 27 8 Cold Storage 23 12 929 200 Total
- 4. Summary of all sectors
- 5. Saving potential of 8 energy-intensive sectors Nepal No Sector Cement 1 2 3 4 5 6 7 8 National Production Q 2,642,521 t 1,933,518 t 709,003 t 39,372t Clinker-based Limestone-based Pulp & Paper Food total Beverage 2,000,000 kl Biscuit 18,000 t Dairy 1,556,000 kl Noodle 42,840 t Sugar 190,650 t Vegetable Oil & Ghee 194,319 t Metal 600,000 t Soap & Chemical 112,000 t Hotel 15,021 rooms Brick FC-BTK 3,984,000,000 bricks VSBK 16,000,000 bricks Cold Storage 60,900 t Total Money NPR 1,488,829,349 383,938,427 1,104,890,923 33,663,972 783,680,733 430,210,534 18,988,796 257,647,474 15,298,110 21,020,412 40,515,407 281,870,090 42,087,972 360,432,716 3,374,780,735 3,374,019,929 Emission Savings CO2 kg 85,853 5,486 80,367 9,940 12,835 1,161 791 1,068 2,353 491 6,971 9,490 10,226 1,951 6,535 6,524 760,806 12 13,191,798 6,378,537,366 108 136,938 Energy Saving Potential Electrical MWh Thermal GJ 45,854 35,390 919 1,598,359 136,848 23,075 1,551 7,584 478 1,900 1,911 5,522 1,210 29,445 177,635 12,835 192,145 52,577 5,080 124,337 202,695 149,334 97,056 0 5,329,804 0 1,214/ 1,838 156,676 8,079,920
- 7. Observations Two types of cement plants Limestone based Clinker based Limestone based plants use electrical as well as thermal energy (coal) as fuel for Sintering process Clinker based plants use electrical energy Motors used are old, rewound and of standard efficiency NEA supply is from 66/33/11 kV with TOD metering Capacitor banks are installed to improve P.F. Face problem of voltage fluctuation and low voltage supply Production hampered by load shedding
- 8. Pulp & Paper Sector
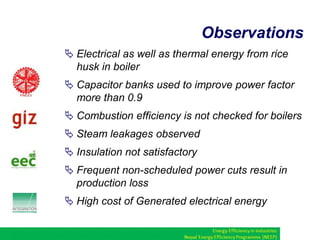
- 9. Observations Electrical as well as thermal energy from rice husk in boiler Capacitor banks used to improve power factor more than 0.9 Combustion efficiency is not checked for boilers Steam leakages observed Insulation not satisfactory Frequent non-scheduled power cuts result in production loss High cost of Generated electrical energy
- 10. Food Sector
- 11. Food Sector Sub-sectors Beverage Biscuit Dairy Noodle Sugar Vegetable oil & Ghee
- 12. Observations Food industries consume both electrical and thermal energy. Diesel boiler used most for backup. Use of inefficient motors. Steam leakages are observed. Improper Insulation Power factor not manage well.
- 13. Potential saving as per ESPS standard Total Electrical (MWh) Electrical saving (MWh) Total Thermal (GJ) Thermal saving (GJ) Beverage 1,530 139 55,623 10,707 Biscuit 3,571 1,052 56,584 8,702 Dairy 7,996 505 91,913 12,785 Noodles 3,956 243 235,382 26,786 Sugar 5,386 783 10,106 2,095 Veg. oil & ghee 21,863 1,200 705,371 78,084
- 14. Metal Sector
- 15. Observations Iron and Steel industries are installed with heavy motors and electrical energy is mainly used for the drives of rolling mill, billet sharing, pumps, compressor, blowers and wire plant motors Motors are old and re-winded Capacitor banks are used to improve power factor Furnace is used mainly with coal, FO and diesel and workplace is warm/hot indicating insufficient insulation Frequent power cuts affect production
- 16. Soap & Chemical Sector
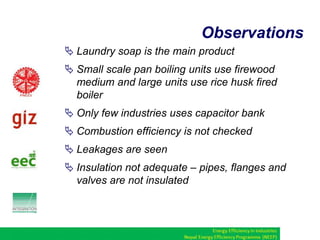
- 17. Observations Laundry soap is the main product Small scale pan boiling units use firewood medium and large units use rice husk fired boiler Only few industries uses capacitor bank Combustion efficiency is not checked Leakages are seen Insulation not adequate – pipes, flanges and valves are not insulated
- 18. Brick Sector
- 19. Observations Majority of brick industries are BTK (fixed chimney) Energy use in brick kiln is coal and coal is imported from India Electricity is used for lighting and drives No significant disturbance in production by load shedding Insulation inefficient Inefficient coal feeding practice
- 21. Observations Potatoes and fruits are the main products stored They consume only electrical energy for cooling process The rate of electricity charge is subsidized 50% by NEA All units have DG for backup. Motor loadings are not checked Power factor is low – none used capacitor banks Many incandescent lamps are used Air curtains are not used
- 22. Energy Intensity regional VS Baseline Sector Electrical Intensity Regional (kWh/MT) Baseline (kWh/MT) Cement Limestone Base 105 148.5 Cement Clinker Base 35 48.68 Pulp & Paper 1175 937.49 Metal 200 149.17 Soap & Chemical - 111.25 Brick (BTK Fixed - 21.27 kWh/1000 pcs Cold Storage - 283.53
- 23. Energy Intensity regional VS Baseline Sector Thermal Intensity Regional (MJ/MT) Baseline (MJ/MT) Cement Limestone Base 3,138 5,411.26 Cement Clinker Base - - Pulp & Paper 16,412 15,434 Metal 1,500 1,470 Soap & Chemical - 3,378 Brick (BTK Fixed 2,215 MJ/1000 pcs 3,951 MJ/1000 pcs Cold Storage - -
- 24. Areas of Potential Savings Efficient motors Power factor improvement Improvement in insulation of the cold pipelines, storage room walls and ceiling More efficient belt and pulleys Partition of cooling areas, installation and effective use of air curtains Regular cleaning and maintenance of condenser pipes Replacement of incandescent lamps Minimization of leakages of compressed ammonia gas
- 25. Recommendations Energy audits must be carried out periodically in all the industries so that opportunities are known and understood Awareness & training about EE Financing for the implementation of energy saving options – mobilize financial institutes and banks Keeping the record of data and monitoring
- 26. Recommendations Institutionalizing energy audit expertise Focus on best practices and best available technology on energy Policy with mandatory periodic energy audits and reporting Involve educational institutions for offer course on EE Competition and award for improvement in EE by sector
- 27. Thank you