Location via proxy:   [ UP ]  
[Report a bug]   [Manage cookies]                
SlideShare a Scribd company logo
SafePeak Case Study:
Large Microsoft SharePoint with SafePeak
The benchmark was conducted in an Enterprise class organization (>20,000 employees), in the
software development business unit, unit that widely uses Microsoft SharePoint (MOSS) for
multiple mission-critical applications in the organization.

SafePeak was installed in pre-production environment for testing and benchmarking. After
intensive evaluation and testing by QA and development teams, the unit performed a benchmark
to receive objective results of SafePeak ability to accelerate response time on SharePoint
applications and upgrade scalability of the existing database-storage infrastructure to handle
growth and peaks of work load.


Benchmark description:
Date: 26/04/2011
2 different Microsoft SharePoint 2007 applications.
17 different pages.
50 parallel users all executing pages in random way.
Benchmark load testing tool: Visual Studio Team System Load Test
SafePeak installed on: Virtual machine, 4 cores 4GB RAM.
SafePeak version: 1.3.7


SafePeak Technologies Ltd 2011      www.safepeak.com                                Page 1
Benchmark results

SQL Server (database) throughput metrics
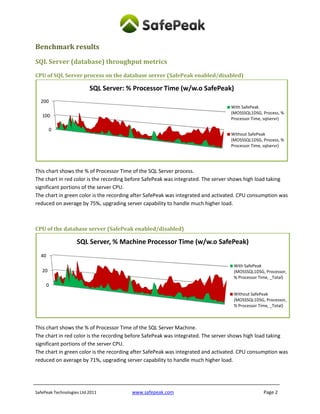
CPU of SQL Server process on the database server (SafePeak enabled/disabled)

                          SQL Server: % Processor Time (w/w.o SafePeak)
  200
                                                                                  With SafePeak
                                                                                  (MOSSSQL1DSG, Process, %
   100
                                                                                  Processor Time, sqlservr)

        0
                                                                                  Without SafePeak
                                                                                  (MOSSSQL1DSG, Process, %
                                                                                  Processor Time, sqlservr)


This chart shows the % of Processor Time of the SQL Server process.
The chart in red color is the recording before SafePeak was integrated. The server shows high load taking
significant portions of the server CPU.
The chart in green color is the recording after SafePeak was integrated and activated. CPU consumption was
reduced on average by 75%, upgrading server capability to handle much higher load.


CPU of the database server (SafePeak enabled/disabled)

                    SQL Server, % Machine Processor Time (w/w.o SafePeak)
  40
                                                                                   With SafePeak
   20                                                                              (MOSSSQL1DSG, Processor,
                                                                                   % Processor Time, _Total)
       0
                                                                                   Without SafePeak
                                                                                   (MOSSSQL1DSG, Processor,
                                                                                   % Processor Time, _Total)


This chart shows the % of Processor Time of the SQL Server Machine.
The chart in red color is the recording before SafePeak was integrated. The server shows high load taking
significant portions of the server CPU.
The chart in green color is the recording after SafePeak was integrated and activated. CPU consumption was
reduced on average by 71%, upgrading server capability to handle much higher load.


SafePeak Technologies Ltd 2011          www.safepeak.com                                         Page 2
Database IO Data Bytes/sec (SafePeak enabled/disabled)

                          SQL Server: IO Data Bytes/sec (w/w.o SafePeak)
  15000000                                                                             With SafePeak
                                                                                       (MOSSSQL1DSG, Process,
   10000000
                                                                                       IO Data Bytes/sec,
    5000000                                                                            sqlservr)

            0                                                                          Without SafePeak
                                                                                       (MOSSSQL1DSG, Process,
                                                                                       IO Data Bytes/sec,
                                                                                       sqlservr)


This chart shows the % of IO Data Bytes/second of the SQL Server process. This performance counter
describes how much the machine (here the SQL Server) is using the storage devices to access data. Database
servers have very high dependency on the speed and throughput of the IO. Specifically Microsoft SharePoint
platform saves all data, including files (doc, excel, pdf, etc) in the SQL Server database, thus increase the IO
consumption/load significantly.
The chart in red color is the recording before SafePeak was integrated. It shows high IO load, and especially
high peaks or spikes of load.
The chart in green color is the recording after SafePeak was integrated and activated. IO consumption was
reduced on average by 83%, upgrading significantly the server infrastructure capability to handle much
higher load and effective performance of average IO access speed.


SafePeak Technologies Ltd 2011            www.safepeak.com                                          Page 3
Application performance metrics
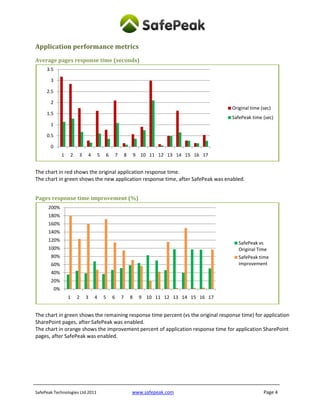
Average pages response time (seconds)
     3.5

       3

     2.5

       2
                                                                                              Original time (sec)
     1.5
                                                                                              SafePeak time (sec)
       1

     0.5

       0
                1   2   3   4    5       6       7       8       9 10 11 12 13 14 15 16 17


The chart in red shows the original application response time.
The chart in green shows the new application response time, after SafePeak was enabled.


Pages response time improvement (%)
      200%
      180%
      160%
      140%
      120%
                                                                                                 SafePeak vs
      100%                                                                                       Original Time
       80%                                                                                       SafePeak time
       60%                                                                                       improvement
       40%
       20%
           0%
                    1   2   3   4    5       6       7       8    9 10 11 12 13 14 15 16 17


The chart in green shows the remaining response time percent (vs the original response time) for application
SharePoint pages, after SafePeak was enabled.
The chart in orange shows the improvement percent of application response time for application SharePoint
pages, after SafePeak was enabled.


SafePeak Technologies Ltd 2011                               www.safepeak.com                                Page 4
About SafePeak
SafePeak is a unique Plug and Play solution for immediate performance acceleration of databases
and applications and datacenter efficiency and scalability.

SafePeak performs an automated, self-adaptive, dynamic caching of result sets for queries and
procedures requested by mission critical applications. SafePeak accelerates the data access to
speed bellow 1ms for any query and boosts scalability of existing infrastructure by factor of 10.


SafePeak is deployed in any production environment within minutes.
The only automated dynamic caching solution requiring zero application, database or data changes.

More info you can find here: www.safepeak.com/downloadtrial


SafePeak Technologies Ltd 2011      www.safepeak.com                                   Page 5
More Related Content

SafePeak @ large telco - Sharepoint benchmark

  • 1. SafePeak Case Study: Large Microsoft SharePoint with SafePeak The benchmark was conducted in an Enterprise class organization (>20,000 employees), in the software development business unit, unit that widely uses Microsoft SharePoint (MOSS) for multiple mission-critical applications in the organization. SafePeak was installed in pre-production environment for testing and benchmarking. After intensive evaluation and testing by QA and development teams, the unit performed a benchmark to receive objective results of SafePeak ability to accelerate response time on SharePoint applications and upgrade scalability of the existing database-storage infrastructure to handle growth and peaks of work load. Benchmark description: Date: 26/04/2011 2 different Microsoft SharePoint 2007 applications. 17 different pages. 50 parallel users all executing pages in random way. Benchmark load testing tool: Visual Studio Team System Load Test SafePeak installed on: Virtual machine, 4 cores 4GB RAM. SafePeak version: 1.3.7 SafePeak Technologies Ltd 2011 www.safepeak.com Page 1
  • 2. Benchmark results SQL Server (database) throughput metrics CPU of SQL Server process on the database server (SafePeak enabled/disabled) SQL Server: % Processor Time (w/w.o SafePeak) 200 With SafePeak (MOSSSQL1DSG, Process, % 100 Processor Time, sqlservr) 0 Without SafePeak (MOSSSQL1DSG, Process, % Processor Time, sqlservr) This chart shows the % of Processor Time of the SQL Server process. The chart in red color is the recording before SafePeak was integrated. The server shows high load taking significant portions of the server CPU. The chart in green color is the recording after SafePeak was integrated and activated. CPU consumption was reduced on average by 75%, upgrading server capability to handle much higher load. CPU of the database server (SafePeak enabled/disabled) SQL Server, % Machine Processor Time (w/w.o SafePeak) 40 With SafePeak 20 (MOSSSQL1DSG, Processor, % Processor Time, _Total) 0 Without SafePeak (MOSSSQL1DSG, Processor, % Processor Time, _Total) This chart shows the % of Processor Time of the SQL Server Machine. The chart in red color is the recording before SafePeak was integrated. The server shows high load taking significant portions of the server CPU. The chart in green color is the recording after SafePeak was integrated and activated. CPU consumption was reduced on average by 71%, upgrading server capability to handle much higher load. SafePeak Technologies Ltd 2011 www.safepeak.com Page 2
  • 3. Database IO Data Bytes/sec (SafePeak enabled/disabled) SQL Server: IO Data Bytes/sec (w/w.o SafePeak) 15000000 With SafePeak (MOSSSQL1DSG, Process, 10000000 IO Data Bytes/sec, 5000000 sqlservr) 0 Without SafePeak (MOSSSQL1DSG, Process, IO Data Bytes/sec, sqlservr) This chart shows the % of IO Data Bytes/second of the SQL Server process. This performance counter describes how much the machine (here the SQL Server) is using the storage devices to access data. Database servers have very high dependency on the speed and throughput of the IO. Specifically Microsoft SharePoint platform saves all data, including files (doc, excel, pdf, etc) in the SQL Server database, thus increase the IO consumption/load significantly. The chart in red color is the recording before SafePeak was integrated. It shows high IO load, and especially high peaks or spikes of load. The chart in green color is the recording after SafePeak was integrated and activated. IO consumption was reduced on average by 83%, upgrading significantly the server infrastructure capability to handle much higher load and effective performance of average IO access speed. SafePeak Technologies Ltd 2011 www.safepeak.com Page 3
  • 4. Application performance metrics Average pages response time (seconds) 3.5 3 2.5 2 Original time (sec) 1.5 SafePeak time (sec) 1 0.5 0 1 2 3 4 5 6 7 8 9 10 11 12 13 14 15 16 17 The chart in red shows the original application response time. The chart in green shows the new application response time, after SafePeak was enabled. Pages response time improvement (%) 200% 180% 160% 140% 120% SafePeak vs 100% Original Time 80% SafePeak time 60% improvement 40% 20% 0% 1 2 3 4 5 6 7 8 9 10 11 12 13 14 15 16 17 The chart in green shows the remaining response time percent (vs the original response time) for application SharePoint pages, after SafePeak was enabled. The chart in orange shows the improvement percent of application response time for application SharePoint pages, after SafePeak was enabled. SafePeak Technologies Ltd 2011 www.safepeak.com Page 4
  • 5. About SafePeak SafePeak is a unique Plug and Play solution for immediate performance acceleration of databases and applications and datacenter efficiency and scalability. SafePeak performs an automated, self-adaptive, dynamic caching of result sets for queries and procedures requested by mission critical applications. SafePeak accelerates the data access to speed bellow 1ms for any query and boosts scalability of existing infrastructure by factor of 10. SafePeak is deployed in any production environment within minutes. The only automated dynamic caching solution requiring zero application, database or data changes. More info you can find here: www.safepeak.com/downloadtrial SafePeak Technologies Ltd 2011 www.safepeak.com Page 5