Sales Analytics in Power BI
•
0 likes•923 views

When looking at Sales Analytics, where should you start? What should you measure? This session provides ideas on sales metrics, implemented in Power BI
Report
Share


Sales Analytics in Power BI
- 1. Sales Analytics In Power BI Jen Stirrup Data Whisperer, Data Relish Level: 300
- 2. Sales Analytics Effective and accurate sales analytics in a Power BI dashboard will allow you to: ● Forecast accurately ● Have a robust visibility of the sales pipeline ● See the analysis and metrics about historic sales performance that will allow you to drive future revenue
- 3. Useful Metrics • When deciding on what sales metrics to use and where to place them on your dashboard. • A visualization of how many deals people have closed is a good place to start, for example.
- 4. Matrix Reports vs Summary • Matrix reports are similar to Summary reports but allow you to group and summarize data by both rows and columns. • A Matrix report will give you a much better, more comprehensive overview of your data than a summary report.
- 5. Matrix Reports vs Summary • While they tend to be aesthetically clean and easy to follow, some people are just more comfortable with a Summary report. • It’s best to go with a Matrix report if in any doubt, as it gives you and your clients and colleagues much more information and scope for analysis.
- 6. How To Break Up Your Data There are several ways you can organise your data in a Sales Analytics dashboard. Which way is best for you depends on what your objectives are. Here are some things to consider: ● Should you organise sales by specific sales colleagues or by teams? Or should you be organising by region or territory instead? This should be tailored to however you organise your sales team. ● Sales can be broken down by week, month, year, financial year, etc. Which of these metrics should be used for each visual? When is a shorter / longer timescale more appropriate? It is also helpful to visually break up your data by using contrasting colours in visualizations.
- 7. Pipeline Dashboard A pipeline report helps sales analysts focus on impactful insights such as strategy, development and planning. The information provided in the report benefits sales department manage sales funnel of opportunities or velocity by stage of sales cycle. It helps you see the number of opportunities created, a breakdown of opportunity values by customer type, and the top opportunities by account. You can compare actual performance to target performance and identify which opportunities are at a more advanced stage, and primed for conversion.
- 8. Pipeline Shape One of the most common ways to represent a pipeline shape is through a funnel chart. While these are popular, and are good for getting an idea at a glance, they can be hard to interpret if they don’t have numbers. They are not always the most informative. However, they are good to have on your dashboard for the purposes of looking at once a week or so. It helps us to understand the pipeline proportions, and what the pipeline might look like by stage going forward.
- 9. Pipeline Dashboard • Keep track of opportunities that are being closed and ones that are still open • Keep track of and analyze deals that are in negotiation - ask yourself and your team, are there ways to bring these forward?
- 10. Pipeline Dashboard • Visualizing sales makes them more manageable and less likely to be pushed on to the end of the month or the end of the year. • Split opportunities by month / stage, or split by owner.
- 11. Pipeline Dashboard • Summarise by region, sales team, country, or colleague. • Get a better idea of what your team is doing, and a better idea of their habits - whether that is as individuals, or as a group.
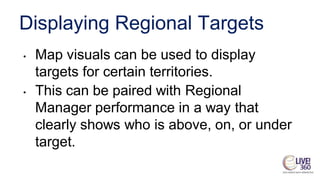
- 12. Displaying Regional Targets • Map visuals can be used to display targets for certain territories. • This can be paired with Regional Manager performance in a way that clearly shows who is above, on, or under target.
- 13. Sales Performance Reports • Sales performance report provides an increased visibility and operational insight into sales actuals, variances, and forecasts. Sales performance across various regions and countries can be viewed.
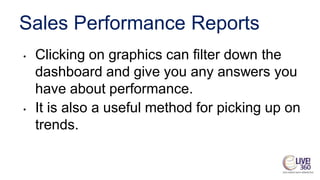
- 14. Sales Performance Reports • Clicking on graphics can filter down the dashboard and give you any answers you have about performance. • It is also a useful method for picking up on trends.
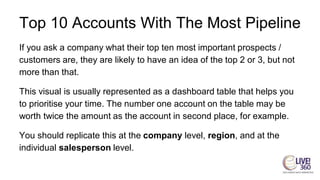
- 15. Top 10 Accounts With The Most Pipeline If you ask a company what their top ten most important prospects / customers are, they are likely to have an idea of the top 2 or 3, but not more than that. This visual is usually represented as a dashboard table that helps you to prioritise your time. The number one account on the table may be worth twice the amount as the account in second place, for example. You should replicate this at the company level, region, and at the individual salesperson level.
- 16. Long And Short Term Pipeline Trends • A long term pipeline trend, also known as an ‘as-at report’, is a historical report that shows figures ‘as-at’ the first of each month. This works with the visuals reflecting opportunities - changes in those opportunities will be reflected in the as-at report.
- 17. Long And Short Term Pipeline Trends • A short term pipeline trend looks at shorter turnarounds, such as a week, a month or even a day. • It can add value when you have some sort of marketing activity going on • It is useful to show a short term trend will reflect if this has happened or not.
- 18. Pipeline By Created Date • Showing the total pipeline created in any given month, and where it is currently. • This is an important part of your dashboard because you want to be able to see a fairly steady ongoing contribution to the pipeline throughout the chart.
- 19. Pipeline By Created Date • This chart helps you to keep track of these changes. • Who is creating the pipeline? • You don’t want to see opportunities opened a long time ago (e.g., over a year ago) still outstanding.
- 20. Sales vs. Targets KPIs • Measuring performance against sales targets should be a crucial feature of your dashboard. • It helps you to understand where you are, how on track you are, and where to go next.
- 21. Conversion Rates • This can be indicative of what is going to happen to the pipeline, and tells you about your performance in terms of turnaround. It’s a great chart to drill down on and look at individual performances. • You can display win rate by value and win rate by count.
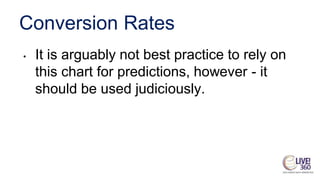
- 22. Conversion Rates • It is arguably not best practice to rely on this chart for predictions, however - it should be used judiciously.
- 23. Deals Closing This Month • Other charts on the dashboard will often show or analyse the size and/or stage of the pipeline - but what about the quality of the pipeline? • A table showing deals due to close this month is a useful part of your dashboard to help demonstrate this.
- 24. Deals Closing This Month • It can effectively be used to show three metrics - how long the deal has been open (in days), number of days since the last stage changed, and how many times the close date has moved from one month to the next.
- 25. Expected Revenue Closed Won plus Weighted Pipeline • This can be an effective part of your dashboard if you have enough data to be able to make a prediction. It’s not always possible in the early stages to have an accurate sales forecast, and it won’t always be the most nuanced as it is represented in a binary way. • It can, however, be a statistically accurate way of forecasting revenue, if the data is accurate and represented well.
- 26. Where Are We Leaking Funnel? • This amount can represent deals set to closed lost in a certain time period, such as the last 60 or 120 days. It can be a good way to identify where you are losing revenue and time.
- 27. Conclusion • All the visuals and the data behind them tell a story - when they are all put together, they should build an accurate picture. • The charts don’t tell you the answer - they tell you where to go and look for the answer.