Location via proxy:   [ UP ]  
[Report a bug]   [Manage cookies]                
SlideShare a Scribd company logo
1 | © All rights reserved to Viola 20201 | © All rights reserved to Viola
SDR Benchmarks
Nov 2020
2 | © All rights reserved to Viola 2020
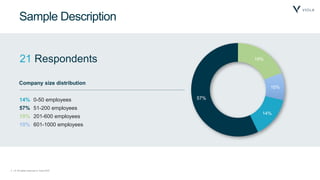
Sample Description
21 Respondents
14%
57%
19%
10%
14% 0-50 employees
57% 51-200 employees
19% 201-600 employees
10% 601-1000 employees
Company size distribution
3 | © All rights reserved to Viola 2020
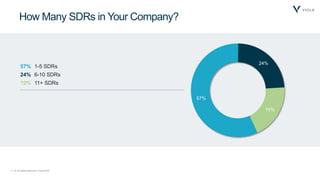
How Many SDRs in Your Company?
57%
24%
19%
57% 1-5 SDRs
24% 6-10 SDRs
19% 11+ SDRs
4 | © All rights reserved to Viola 2020
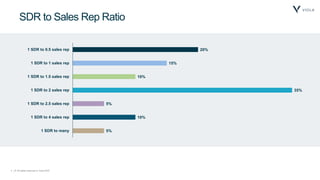
SDR to Sales Rep Ratio
20%
15%
10%
35%
5%
10%
5%
1 SDR to 0.5 sales rep
1 SDR to 1 sales rep
1 SDR to 1.5 sales rep
1 SDR to 2 sales rep
1 SDR to 2.5 sales rep
1 SDR to 4 sales rep
1 SDR to many
5 | © All rights reserved to Viola 2020
SDR Quota is Mostly Based On Converted Meetings
61%
19%
5%
5%
5%
5%
61% Converted meeting (opportunities)
19% Meetings (both converted and not)
5% Booking/revenue
5% Both booking and revenue
5% Pipeline creation in ARR ($)
5% Based on converted meetings, possibly with
an uptick in revenue
6 | © All rights reserved to Viola 2020
Average Ramp-Up Time for New SDRs: 2 Months
33%
52%
15%
33% 1 month
52% 2 months
15% 3 months
7 | © All rights reserved to Viola 2020
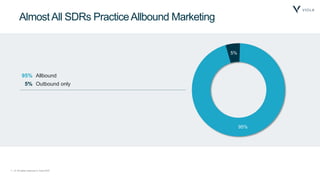
AlmostAll SDRs PracticeAllbound Marketing
95%
5%
95% Allbound
5% Outbound only
8 | © All rights reserved to Viola 2020
SDR Monthly Quota (in Number of Meetings)
28%
28%
11%
11%
22%
28% 1-5
28% 6-10
11% 11-15
11% 16-20
22% 20+
9 | © All rights reserved to Viola 2020
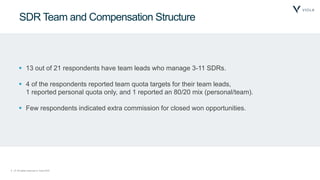
SDR Team and Compensation Structure
 13 out of 21 respondents have team leads who manage 3-11 SDRs.
 4 of the respondents reported team quota targets for their team leads,
1 reported personal quota only, and 1 reported an 80/20 mix (personal/team).
 Few respondents indicated extra commission for closed won opportunities.

More Related Content

SDR Benchmarks

  • 1. 1 | © All rights reserved to Viola 20201 | © All rights reserved to Viola SDR Benchmarks Nov 2020
  • 2. 2 | © All rights reserved to Viola 2020 Sample Description 21 Respondents 14% 57% 19% 10% 14% 0-50 employees 57% 51-200 employees 19% 201-600 employees 10% 601-1000 employees Company size distribution
  • 3. 3 | © All rights reserved to Viola 2020 How Many SDRs in Your Company? 57% 24% 19% 57% 1-5 SDRs 24% 6-10 SDRs 19% 11+ SDRs
  • 4. 4 | © All rights reserved to Viola 2020 SDR to Sales Rep Ratio 20% 15% 10% 35% 5% 10% 5% 1 SDR to 0.5 sales rep 1 SDR to 1 sales rep 1 SDR to 1.5 sales rep 1 SDR to 2 sales rep 1 SDR to 2.5 sales rep 1 SDR to 4 sales rep 1 SDR to many
  • 5. 5 | © All rights reserved to Viola 2020 SDR Quota is Mostly Based On Converted Meetings 61% 19% 5% 5% 5% 5% 61% Converted meeting (opportunities) 19% Meetings (both converted and not) 5% Booking/revenue 5% Both booking and revenue 5% Pipeline creation in ARR ($) 5% Based on converted meetings, possibly with an uptick in revenue
  • 6. 6 | © All rights reserved to Viola 2020 Average Ramp-Up Time for New SDRs: 2 Months 33% 52% 15% 33% 1 month 52% 2 months 15% 3 months
  • 7. 7 | © All rights reserved to Viola 2020 AlmostAll SDRs PracticeAllbound Marketing 95% 5% 95% Allbound 5% Outbound only
  • 8. 8 | © All rights reserved to Viola 2020 SDR Monthly Quota (in Number of Meetings) 28% 28% 11% 11% 22% 28% 1-5 28% 6-10 11% 11-15 11% 16-20 22% 20+
  • 9. 9 | © All rights reserved to Viola 2020 SDR Team and Compensation Structure  13 out of 21 respondents have team leads who manage 3-11 SDRs.  4 of the respondents reported team quota targets for their team leads, 1 reported personal quota only, and 1 reported an 80/20 mix (personal/team).  Few respondents indicated extra commission for closed won opportunities.