Second Quarter 2007 Earnings Presentation
- 1. Bank of America Second Quarter 2007 Results Ken Lewis Chairman, CEO and President Joe Price Chief Financial Officer July 19, 2007
- 2. Forward Looking Statements This presentation contains forward-looking statements, including statements about the financial conditions, results of operations and earnings outlook of Bank of America Corporation. The forward-looking statements involve certain risks and uncertainties. Factors that may cause actual results or earnings to differ materially from such forward-looking statements include, among others, the following: 1) projected business increases following process changes and other investments are lower than expected; 2) competitive pressure among financial services companies increases significantly; 3) general economic conditions are less favorable than expected; 4) political conditions including the threat of future terrorist activity and related actions by the United States abroad may adversely affect the company’s businesses and economic conditions as a whole; 5) changes in the interest rate environment reduce interest margins and impact funding sources; 6) changes in foreign exchange rates increases exposure; 7) changes in market rates and prices may adversely impact the value of financial products; 8) legislation or regulatory environments, requirements or changes adversely affect the businesses in which the company is engaged; 9) changes in accounting standards, rules or interpretations, 10) litigation liabilities, including costs, expenses, settlements and judgments, may adversely affect the company or its businesses; 11) mergers and acquisitions and their integration into the company; and 12) decisions to downsize, sell or close units or otherwise change the business mix of any of the company. For further information regarding Bank of America Corporation, please read the Bank of America reports filed with the SEC and available at www.sec.gov. 2
- 3. Important Presentation Format Information • Certain prior period amounts have been reclassified to conform to current period presentation • The Corporation reports its Global Consumer & Small Business Banking (GCSBB) results, specifically Card Services, on a managed basis. Refer to Exhibit A in Supplemental Package for reconciliation from Managed to Held Results. • Effective April 1, 2007, the Corporation changed its income statement presentation to reflect gains (losses) on sales of debt securities as a component of noninterest income. 3
- 4. Summary Earnings Statement – 2nd Quarter Comparison ($ in millions) 2Q07 2Q06 $ Change % Change Core net interest income (FTE) $ 8,146 $ 8,546 $ (400) (5 %) Market-based net interest income 635 380 Net interest income (FTE) 8,781 8,926 (145) (2 %) Noninterest income 11,177 9,589 1,588 17 % Total revenue, net of interest expense (FTE) 19,958 18,515 1,443 8% Provision for credit losses 1,810 1,005 805 80 % Noninterest expense (excl merger charges) 9,018 8,523 495 6% Merger charge 75 194 Noninterest expense 9,093 8,717 Pre-tax income 9,055 8,793 Income tax expense 3,294 3,318 Net income 5,761 5,475 286 5% Merger & restructuring charges (after-tax) 47 123 Net Income before merger charges $ 5,808 $ 5,598 $ 210 4% Diluted EPS reported $ 1.28 $ 1.19 8% Merger charge impact .01 .03 Impact of intangibles amortization .05 .06 4
- 5. Businesses Generating Good Fee Revenue 2Q07 vs. 2Q06 Change Managed Total Core Total GCSBB GCIB GWIM Businesses Other Corp Amt. % Amt. % Amt. % Amt.1 % Amt. Amt. % Net interest income (FTE) $ 183 3% $177 7% $ 36 4% $ 396 4% $ (541) $ (145) (2 %) Noninterest income 379 9% 322 11 % 119 13 % 820 10 % 768 1,588 17 % Revenue, net of interest expense 562 5% 499 9% 155 8% 1,216 7% 227 1,443 8% Provision for credit losses 1,287 71 % 19 86 % 26 65 % 1,332 74 % (527) 805 80 % Noninterest expense 461 10 % 371 13 % 73 8% 905 11 % (529) 376 4% Net income $ (745) (23 %) $ 75 5 % $ 37 6% $ (633) (12 %) $ 919 $ 286 5% • Good fee revenue growth across all businesses • Yield curve environment is muting revenue growth • Trend toward normalcy for credit costs is muting earnings growth 1 Balance excludes the All Other business line. 5
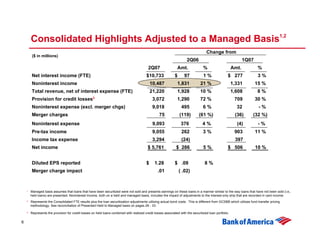
- 6. Consolidated Highlights Adjusted to a Managed Basis1,2 Change from ($ in millions) 2Q06 1Q07 2Q07 Amt. % Amt. % Net interest income (FTE) $10,733 $ 97 1% $ 277 3% Noninterest income 10,487 1,831 21 % 1,331 15 % Total revenue, net of interest expense (FTE) 21,220 1,928 10 % 1,608 8% Provision for credit losses3 3,072 1,290 72 % 709 30 % Noninterest expense (excl. merger chgs) 9,018 495 6% 32 -% Merger charges 75 (119) (61 %) (36) (32 %) Noninterest expense 9,093 376 4% (4) -% Pre-tax income 9,055 262 3% 903 11 % Income tax expense 3,294 (24) 397 Net income $ 5,761 $ 286 5% $ 506 10 % Diluted EPS reported $ 1.28 $ .09 8% Merger charge impact .01 ( .02) 1 Managed basis assumes that loans that have been securitized were not sold and presents earnings on these loans in a manner similar to the way loans that have not been sold (i.e., held loans) are presented. Noninterest income, both on a held and managed basis, includes the impact of adjustments to the interest-only strip that are recorded in card income. 2 Represents the Consolidated FTE results plus the loan securitization adjustments utilizing actual bond costs. This is different from GCSBB which utilizes fund transfer pricing methodology. See reconciliation of Presented Held to Managed basis on pages 29 - 33. 3 Represents the provision for credit losses on held loans combined with realized credit losses associated with the securitized loan portfolio. 6
- 7. Highlights – 2nd Quarter • Earnings of $5.8 billion • Diluted EPS of $1.28 (includes $0.01 of merger charges) grew 8% over 2Q06 • Revenue reflects strong noninterest income growth over 2Q06 across each line of business • Total retail unit sales increased 8% over 2Q06 to 12.1 million – Introduction of innovative products like No Fee Mortgage PLUS gaining momentum – Net new retail checking accounts increased to 717,000 • Assets under management again reached new highs increasing to more than $566 billion • Credit quality remains sound • Solid capital position with Tier 1 Capital ratio of 8.52% 7
- 8. Global Consumer & Small Business Banking (GCSBB) – Managed Basis Change from ($ in millions) 2Q06 1Q07 2Q07 Amt. % Amt. % Net interest income (FTE) $ 7,150 $ 183 3% $ 121 2% Noninterest income 4,789 379 9% 395 9% Total revenue, net of interest expense (FTE) 11,939 562 5% 516 5% Provision for credit losses1 3,094 1,287 71 % 683 28 % Noninterest expense 4,969 461 10 % 238 5% Pre-tax income 3,876 (1,186) (23 %) (405) (9 %) Income tax expense 1,417 (441) (169) Net income $ 2,459 $ (745) (23 %) $(236) (9 %) ROE 15.80 % (434 bps) (176 bps) Efficiency ratio 41.62 % 200 bps 20 bps • Card Services average loans grew 9% over 2Q06, led by International, Unsecured Lending and Business Card • Consumer Card loss rate increased to 5.02% as expected. Projected to move lower next quarter. • Retail sales of 12.1 million grew 8% over 2Q06 • Fee income growth over 2Q06 led by a combined 7% improvement in service charges and card income • Small business unit sales grew 41% over 2Q06, led by online banking, business checking and debit • Provision expense includes current quarter reserve build for growth in small business, home equity and unsecured lending 1 Represents the provision for credit losses on held loans combined with realized credit losses associated with the securitized loan portfolio. 8
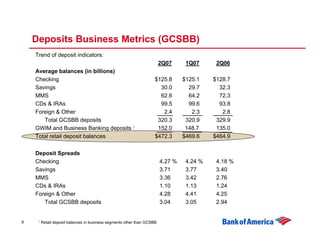
- 9. Deposits Business Metrics (GCSBB) Trend of deposit indicators: 2Q07 1Q07 2Q06 Average balances (in billions) Checking $125.8 $125.1 $128.7 Savings 30.0 29.7 32.3 MMS 62.6 64.2 72.3 CDs & IRAs 99.5 99.6 93.8 Foreign & Other 2.4 2.3 2.8 Total GCSBB deposits 320.3 320.9 329.9 GWIM and Business Banking deposits 1 152.0 148.7 135.0 Total retail deposit balances $472.3 $469.6 $464.9 Deposit Spreads Checking 4.27 % 4.24 % 4.18 % Savings 3.71 3.77 3.40 MMS 3.36 3.42 2.76 CDs & IRAs 1.10 1.13 1.24 Foreign & Other 4.28 4.41 4.25 Total GCSBB deposits 3.04 3.05 2.94 9 1 Retail deposit balances in business segments other than GCSBB
- 10. Retail Sales Highlights – 2Q07 Product Metric Performance Highlight Checking Net new retail 717,000 units • Sales up 11% from 1Q07 and up 16% from accounts 2Q06 Savings Net new retail 516,000 units • Keep the ChangeTM product driving growth accounts surpassing 5 million users Credit card New accounts 3.5 million units • Lower cost delivery strategy driving increasing sales coupled with e-Commerce Mortgage Production $29.2 billion • No Fee Mortgage PLUS product has lifted banking center application volumes 36% from last year Home equity Production $22.7 billion • Remains the leader in the industry with attractive no fee offering for customers Debit card Revenue $539 million up • Remains #1 with 16% market share 14% over 2Q06 increasing usage and penetration rates Online banking Activations 1.6 million units • Largest active online banking customer base with 22 million, industry leading DDA- based bill pay market share of 66% Small business Sales 894,000 units • Debit, online banking, business checking led sales 10
- 11. Global Corporate & Investment Banking (GCIB) ($ in millions) Change from 2Q06 1Q07 2Q07 Amt. % Amt. % Net interest income (FTE) $2,618 $ 177 7% $ 206 9% Noninterest income 3,196 322 11 % 285 10 % Total revenue, net of interest expense (FTE) 5,814 499 9% 491 9% Provision for credit losses 41 19 86 % (74) (64 %) Noninterest expense 3,135 371 13 % 235 8% Pre-tax income 2,638 109 4% 330 14 % Income tax expense 968 34 107 Net income $1,670 $ 75 5% $ 223 15 % ROE 16.15 % 106 bps 179 bps Efficiency ratio 53.91 % 190 bps (56 bps) • Capital Markets and Advisory Services revenue grew 23% over 2Q06 and 13% over 1Q07 • Investment banking revenue grew 27% over 2Q06 and 17% vs 1Q07 • Sales and trading increased 20% vs 2Q06 and 10% vs 1Q07 • Loans grew 10% vs 2Q06 with continued spread compression • Average deposit and sweep balance growth of 7% with a continued trend from noninterest-bearing to interest- bearing 11
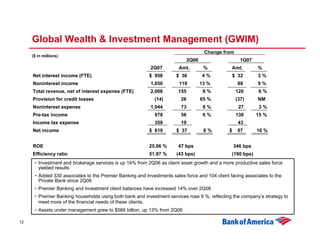
- 12. Global Wealth & Investment Management (GWIM) Change from ($ in millions) 2Q06 1Q07 2Q07 Amt. % Amt. % Net interest income (FTE) $ 958 $ 36 4% $ 32 3% Noninterest income 1,050 119 13 % 88 9% Total revenue, net of interest expense (FTE) 2,008 155 8% 120 6% Provision for credit losses (14) 26 65 % (37) NM Noninterest expense 1,044 73 8% 27 3% Pre-tax income 978 56 6% 130 15 % Income tax expense 359 19 43 Net income $ 619 $ 37 6% $ 87 16 % ROE 25.06 % 47 bps 346 bps Efficiency ratio 51.97 % (43 bps) (190 bps) • Investment and brokerage services is up 14% from 2Q06 as client asset growth and a more productive sales force yielded results • Added 330 associates to the Premier Banking and Investments sales force and 104 client facing associates to the Private Bank since 2Q06 • Premier Banking and Investment client balances have increased 14% over 2Q06 • Premier Banking households using both bank and investment services rose 9 %, reflecting the company’s strategy to meet more of the financial needs of these clients. • Assets under management grew to $566 billion, up 13% from 2Q06 12
- 13. All Other – Including GCSBB Securitization Eliminations ($ in millions) Change from 2Q06 1Q07 2Q07 Amt. % Amt. % Net interest income (FTE) $ (1,945) $ (541) (39 %) $ (175) (10 %) Noninterest income 2,142 768 56 % 522 32 % Total revenue, net of interest expense (FTE) 197 227 NM 347 NM Provision for credit losses1 (1,311) (527) (67 %) 3 -% Merger & restruct. exp. 75 (119) (61 %) (36) (32 %) Noninterest expense (130) (410) NM (468) NM Pre-tax income 1,563 1,283 NM 848 NM Income tax expense 550 364 416 Net income $ 1,013 $ 919 NM $ 432 74 % Components of equity investment gains: Principal investing $ 1,250 $ 833 NM $ 675 NM Corporate & strategic 469 309 NM 148 46 % Total All Other equity gains 1,719 1,142 NM 823 92 % Other business segments 110 (12) (10 %) (8) (7 %) Total Corp equity gains $ 1,829 $1,130 NM $ 815 80% 1 Represents the provision for credit losses in All Other combined with the GCSBB securitization offset. 13
- 14. 2nd Quarter Topical Items • Equity investment gains – Conversus transaction • Asset quality – Sound with expected increased loss trends associated primarily with targeted growth areas • Balance sheet management – Managed net interest income trending up as expected • Capital – All regulatory ratios remain strong 14
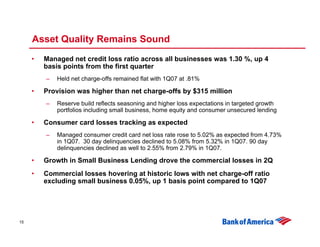
- 15. Asset Quality Remains Sound • Managed net credit loss ratio across all businesses was 1.30 %, up 4 basis points from the first quarter – Held net charge-offs remained flat with 1Q07 at .81% • Provision was higher than net charge-offs by $315 million – Reserve build reflects seasoning and higher loss expectations in targeted growth portfolios including small business, home equity and consumer unsecured lending • Consumer card losses tracking as expected – Managed consumer credit card net loss rate rose to 5.02% as expected from 4.73% in 1Q07. 30 day delinquencies declined to 5.08% from 5.32% in 1Q07. 90 day delinquencies declined as well to 2.55% from 2.79% in 1Q07. • Growth in Small Business Lending drove the commercial losses in 2Q • Commercial losses hovering at historic lows with net charge-off ratio excluding small business 0.05%, up 1 basis point compared to 1Q07 15
- 16. Balanced Mix of Managed Consumer Loans Total Managed Consumer 2Q07 Average Balances 1 $604.0B Other Consumer 2% DFS 7% Unsecured Lending 4% Residential Mortgage Foreign Consumer Card 44% 5% Avg. FICO 739 2 Avg. LTV 59% 2Q07 Managed loss ratio .02% US Consumer Card 23% Avg. FICO 689 2 2Q07 Managed loss ratio 5.02%3 Avg. FICO 722 2 Home Equity 1 Includes certain securitizations in addition to Avg. CLTV 66% those within Card Services 15% 2Q07 Managed loss ratio .12% 2 FICOs and LTVs are on a refreshed basis as of 6/30/07 3 Card loss represents Consumer Credit Card 16
- 17. Net Interest Income ($ in millions) Linked Quarter Net Interest Income & Yield 2Q07 1Q07 $ Change % Change Reported net interest income (FTE) $ 8,781 $ 8,597 $ 184 2% Market based NII (635) (484) (151) Core net interest income (FTE) 8,146 8,113 33 -% Impact of securitizations 1,952 1,859 93 Core NII - Managed Basis $10,098 $ 9,972 $ 126 1% Avg. earning assets $1,358,199 $1,321,946 $ 36,253 3% Market based earning assets 425,647 408,113 17,534 4% Impact of securitizations 102,357 102,529 (172) - % Reported net interest yield 2.59 % 2.61 % (2 bps) Core net interest yield 3.50 % 3.56 % (6 bps) Core net interest yield – Managed Basis 3.91 % 3.94 % (3 bps) • Change in core net interest income – managed basis driven by: 1 more accrual day in the qtr ($75 mm) Consumer and commercial loan growth ($95 mm) Offset by loss of revenue from sale of Latin America businesses in 1Q ($65 mm) 17
- 18. Bank of America NII Sensitivity on a Managed Basis First Rolling 12 Months June 30, 2007 300 Year 1 FF: 7.00 10-Y: 6.72 NII ∆: -900 200 Curve Flatteners NII ∆: -835 FF: 6.00 10-Y: 5.72 FF: 2.75 NII ∆: -586 10-Y: 4.78 NII ∆: -511 100 FF: 5.00 10-Y: 5.72 C an inF F n s ed u d FF: 5.00 FF: 5.00 10-Y: 4.72 10-Y: 6.72 NII ∆: -94 NII ∆: 61 0 FF: 5.25 h ge -300 -200 -100 0 100 200 300 10-Y: 5.67 NII ∆: -76 NII ∆: 840 FF: 4.00 S -100 10-Y: 5.72 NII ∆: 938 FF: 1.75 NII ∆: 1,519 10-Y: 4.45 NII ∆: 299 -200 Curve Steepeners FF: 3.00 10-Y: 4.72 NII ∆: 1,760 -300 Change in 10-yr Swap
- 19. Bank of America NII Sensitivity on a Managed Basis First Rolling 12 Months March 31, 2007 300 Year 1 FF: 6.67 10-Y: 6.20 NII ∆: -975 200 Curve Flatteners NII ∆: -880 FF: 5.67 10-Y: 5.20 FF: 2.75 NII ∆: -763 10-Y: 4.78 100 NII ∆: -631 FF: 4.67 Change in Fed Funds 10-Y: 5.20 FF: 4.67 FF: 4.67 10-Y: 4.20 10-Y: 6.20 NII ∆: -256 NII ∆: 153 0 -300 -200 -100 0 FF: 5.34 100 200 300 10-Y: 5.34 NII ∆: -500 NII ∆: 688 FF: 3.67 S -100 10-Y: 5.20 NII ∆: 895 FF: 1.75 10-Y: 4.45 NII ∆: 299 NII ∆: 1,121 -200 Curve Steepeners FF: 2.67 10-Y: 4.20 NII ∆: 1,616 -300 Change in 10-yr Swap
- 20. Net Interest Income – Managed Sensitivity ($ in millions) Managed Net interest income impact for next 12 months Forward curve interest rate scenarios @6/30/07 @3/31/07 + 100 bp parallel shift $(511) $(631) - 100 bp parallel shift 840 688 Flattening scenario from forward curve + 100 bp flattening on short end (586) (763) - 100 bp flattening on long end (94) (256) Steepening scenario from forward curve + 100 bp steepening on long end 61 153 - 100 bp steepening on short end 938 895 20
- 21. Capital Strength ($ in millions) 2Q07 1Q07 2Q06 Tier 1 Capital $ 94,979 $ 91,112 $ 84,978 Risk Weighted Assets 1,115,150 1,062,883 1,019,828 Tier 1 Capital Ratio 8.52 % 8.57 % 8.33 % Total Capital Ratio 12.11 % 11.94 % 11.25 % Tier 1 Leverage Ratio 6.33 % 6.25 % 6.13 % Tangible Equity $ 61,186 $ 59,943 $ 51,408 Tangible Equity Ratio 4.19 % 4.20 % 3.76 % Tangible Equity Ratio Adj for OCI 4.82 % 4.70 % 4.49 % Months to required funding- Parent Co. 26 23 22 Earnings Returned to Common Shareholders Dividends paid $2,494 $ 2,502 $ 2,285 Cost of net share repurchases 273 1,359 3,054 Dividends & net repur. as % of earnings 48 % 74 % 98 % Dividend yield 4.58 % 4.39 % 4.16 % 21
- 22. Appendix 22
- 23. Summary Earnings Statement – 1st 6 Months Comparison ($ in millions) YTD 07 YTD 06 $ Change % Change Core net interest income (FTE) $ 16,259 $17,174 $ (915) (5 %) Market-based net interest income 1,119 792 Net interest income (FTE) 17,378 17,966 (588) (3 %) Noninterest income 21,064 18,504 2,560 14 % Total revenue, net of interest expense (FTE) 38,442 36,470 1,972 5% Provision for credit losses 3,045 2,275 770 34 % Noninterest expense (excl merger charges) 18,004 17,349 655 4% Merger charge 186 292 Noninterest expense 18,190 17,641 Pre-tax income 17,207 16,554 Income tax expense 6,191 6,093 Net income 11,016 10,461 555 5% Merger & restructuring charges (after-tax) 117 184 Net Income before merger charges $ 11,133 $10,645 $ 488 5% Diluted EPS reported $ 2.44 $ 2.25 8% Merger charge impact .02 .04 Impact of intangibles amortization .11 .12 23
- 24. Consolidated Highlights Adjusted to a Managed Basis1,2 ($ in millions) Change vs. YTD06 YTD07 Amt. % Net interest income (FTE) $21,189 $ (212) (1 %) Noninterest income 19,643 3,143 19 % Total revenue, net of interest expense (FTE) 40,832 2,931 8% Provision for credit losses3 5,435 1,729 47 % Noninterest expense (excl. merger chgs) 18,004 655 4% Merger charges 186 (106) (36 %) Noninterest expense 18,190 549 3% Pre-tax income 17,207 653 4% Income tax expense 6,191 98 Net income $11,016 $ 555 5% 1 Managed basis assumes that loans that have been securitized were not sold and presents earnings on these loans in a manner similar to the way loans that have not been sold (i.e., held loans) are presented. Noninterest income, both on a held and managed basis, includes the impact of adjustments to the interest-only strip that are recorded in card income. 2 Represents the Consolidated FTE results plus the loan securitization adjustments utilizing actual bond costs. This is different from GCSBB which utilizes fund transfer pricing methodology. See reconciliation of Presented Held to Managed basis on pages 29 - 33. 3 Represents the provision for credit losses on held loans combined with realized credit losses associated with the securitized loan portfolio. 24
- 25. Global Consumer & Small Business Banking (GCSBB) – Managed Basis ($ in millions) Change vs. YTD06 YTD07 Amt. % Net interest income (FTE) $14,179 $ 120 1% Noninterest income 9,183 1,024 13 % Total revenue, net of interest expense (FTE) 23,362 1,144 5% Provision for credit losses1 5,505 1,797 48 % Noninterest expense 9,700 581 6% Pre-tax income 8,157 (1,234) (13 %) Income tax expense 3,003 (459) Net income $ 5,154 $ (775) (13 %) ROE 16.67 % (175 bps) Efficiency ratio 41.52 % 48 bps • Card Services average loans grew 8% over YTD06, led by International, Unsecured Lending and Business Card • Consumer Card loss rate YTD increased to 4.88% • Retail sales of 23.8 million grew 7% over YTD06 • Fee income growth over YTD06 led by a combined 11% improvement in service charges and card income • Small business unit sales grew 37% over YTD06, led by online banking, business checking and debit 1 Represents the provision for credit losses on held loans combined with realized credit losses associated with the securitized loan portfolio. 25
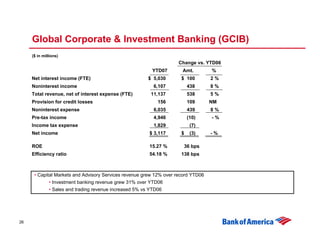
- 26. Global Corporate & Investment Banking (GCIB) ($ in millions) Change vs. YTD06 YTD07 Amt. % Net interest income (FTE) $ 5,030 $ 100 2% Noninterest income 6,107 438 8% Total revenue, net of interest expense (FTE) 11,137 538 5% Provision for credit losses 156 109 NM Noninterest expense 6,035 439 8% Pre-tax income 4,946 (10) -% Income tax expense 1,829 (7) Net income $ 3,117 $ (3) -% ROE 15.27 % 36 bps Efficiency ratio 54.18 % 138 bps • Capital Markets and Advisory Services revenue grew 12% over record YTD06 • Investment banking revenue grew 31% over YTD06 • Sales and trading revenue increased 5% vs YTD06 26
- 27. Global Wealth & Investment Management (GWIM) ($ in millions) Change vs. YTD06 YTD07 Amt. % Net interest income (FTE) $ 1,884 $ 23 1% Noninterest income 2,012 191 10 % Total revenue, net of interest expense (FTE) 3,896 214 6% Provision for credit losses 9 49 NM Noninterest expense 2,061 123 6% Pre-tax income 1,826 42 2% Income tax expense 675 14 Net income $ 1,151 $ 28 2% ROE 23.33 % 81 bps Efficiency ratio 52.89 % 24 bps • Investment and brokerage services is up 13% from YTD06 as client asset growth and a more productive sales force yielded results 27
- 28. All Other – Including GCSBB Securitization Eliminations ($ in millions) Change vs. YTD06 YTD07 Amt. % Net interest income (FTE) $ (3,715) $ (831) (29 %) Noninterest income 3,762 907 32 % Total revenue, net of interest expense (FTE) 47 76 NM Provision for credit losses1 (2,625) (1,185) (82 %) Merger & restruct. exp. 186 (106) (36 %) Noninterest expense 208 (488) (70 %) Pre-tax income 2,278 1,855 NM Income tax expense 684 550 Net income $ 1,594 $1,305 NM Components of equity investment gains: Principal investing $ 1,825 $1,082 NM Corporate & strategic 790 385 95 % Total All Other equity gains 2,615 1,467 NM Other business segments 228 (41) (15 %) Total Corp equity gains $ 2,843 $1,426 NM 1 Represents the provision for credit losses in All Other combined with the GCSBB securitization offset. 28
- 29. Reconciliation of Presented Held to Managed Basis – Consolidated 2Q071 ($ in millions) 2Q07 Held Securitizations Managed Basis Impact Basis2 Net interest income (FTE) $ 8,781 $ 1,952 $ 10,733 Noninterest income 11,177 (690) 10,487 Total revenue, net of interest expense (FTE) 19,958 1,262 21,220 Provision for credit losses 1,810 1,262 3,072 Noninterest expense (excl. merger chgs) 9,018 - 9,018 Merger charges 75 - 75 Noninterest expense 9,093 - 9,093 Pre-tax income 9,055 - 9,055 Income tax expense 3,294 - 3,294 Net income $ 5,761 $ - $ 5,761 1 Represents the Consolidated FTE results plus the loan securitization adjustments utilizing actual bond costs. This is different from GCSBB which utilizes fund transfer pricing methodology. 2 Provision for credit losses on a managed basis represents held loans combined with realized credit losses associated with the securitized loan portfolio. 29
- 30. Reconciliation of Presented Held to Managed Basis – Consolidated 2Q061 ($ in millions) 2Q06 Held Securitizations Managed Basis Impact Basis2 Net interest income (FTE) $ 8,926 $ 1,710 $ 10,636 Noninterest income 9,589 (933) 8,656 Total revenue, net of interest expense (FTE) 18,515 777 19,292 Provision for credit losses 1,005 777 1,782 Noninterest expense (excl. merger chgs) 8,523 - 8,523 Merger charges 194 - 194 Noninterest expense 8,717 - 8,717 Pre-tax income 8,793 - 8,793 Income tax expense 3,318 - 3,318 Net income $ 5,475 $ - $ 5,475 1 Represents the Consolidated FTE results plus the loan securitization adjustments utilizing actual bond costs. This is different from GCSBB which utilizes fund transfer pricing methodology. 2 Provision for credit losses on a managed basis represents held loans combined with realized credit losses associated with the securitized loan portfolio. 30
- 31. Reconciliation of Presented Held to Managed Basis – Consolidated 1Q071 ($ in millions) 1Q07 Held Securitizations Managed Basis Impact Basis2 Net interest income (FTE) $ 8,597 $ 1,859 $10,456 Noninterest income 9,887 (731) 9,156 Total revenue, net of interest expense (FTE) 18,484 1,128 19,612 Provision for credit losses 1,235 1,128 2,363 Noninterest expense (excl. merger chgs) 8,986 - 8,986 Merger charges 111 - 111 Noninterest expense 9,097 - 9,097 Pre-tax income 8,152 - 8,152 Income tax expense 2,897 - 2,897 Net income $ 5,255 $ - $ 5,255 1 Represents the Consolidated FTE results plus the loan securitization adjustments utilizing actual bond costs. This is different from GCSBB which utilizes fund transfer pricing methodology. 2 Provision for credit losses on a managed basis represents held loans combined with realized credit losses associated with the securitized loan portfolio. 31
- 32. Reconciliation of Presented Held to Managed Basis – Consolidated YTD 20071 ($ in millions) YTD 2007 Held Securitizations Managed Basis Impact Basis2 Net interest income (FTE) $ 17,378 $ 3,811 $ 21,189 Noninterest income 21,064 (1,421) 19,643 Total revenue, net of interest expense (FTE) 38,442 2,390 40,832 Provision for credit losses 3,045 2,390 5,435 Noninterest expense (excl. merger chgs) 18,004 - 18,004 Merger charges 186 - 186 Noninterest expense 18,190 - 18,190 Pre-tax income 17,207 - 17,207 Income tax expense 6,191 - 6,191 Net income $ 11,016 $ - $ 11,016 1 Represents the Consolidated FTE results plus the loan securitization adjustments utilizing actual bond costs. This is different from GCSBB which utilizes fund transfer pricing methodology. 2 Provision for credit losses on a managed basis represents held loans combined with realized credit losses associated with the securitized loan portfolio. 32
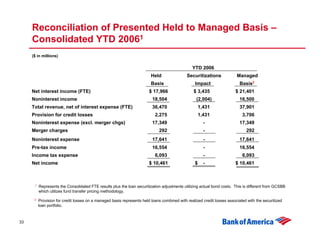
- 33. Reconciliation of Presented Held to Managed Basis – Consolidated YTD 20061 ($ in millions) YTD 2006 Held Securitizations Managed Basis Impact Basis2 Net interest income (FTE) $ 17,966 $ 3,435 $ 21,401 Noninterest income 18,504 (2,004) 16,500 Total revenue, net of interest expense (FTE) 36,470 1,431 37,901 Provision for credit losses 2,275 1,431 3,706 Noninterest expense (excl. merger chgs) 17,349 - 17,349 Merger charges 292 - 292 Noninterest expense 17,641 - 17,641 Pre-tax income 16,554 - 16,554 Income tax expense 6,093 - 6,093 Net income $ 10,461 $ - $ 10,461 1 Represents the Consolidated FTE results plus the loan securitization adjustments utilizing actual bond costs. This is different from GCSBB which utilizes fund transfer pricing methodology. 2 Provision for credit losses on a managed basis represents held loans combined with realized credit losses associated with the securitized loan portfolio. 33


