Second Quarter 2008 Earnings Presentation
- 1. Bank of America Second Quarter 2008 Results Ken Lewis Chairman, CEO and President Joe Price Chief Financial Officer July 21, 2008
- 2. Forward Looking Statements This presentation contains forward-looking statements, including statements about the financial conditions, results of operations and earnings outlook of Bank of America Corporation. The forward-looking statements involve certain risks and uncertainties. Factors that may cause actual results or earnings to differ materially from such forward-looking statements include, among others, the following: 1) projected business increases following process changes and other investments are lower than expected; 2) competitive pressure among financial services companies increases significantly; 3) general economic conditions are less favorable than expected; 4) political conditions including the threat of future terrorist activity and related actions by the United States abroad may adversely affect the company’s businesses and economic conditions as a whole; 5) changes in the interest rate environment and market liquidity reduce interest margins, impact funding sources and effect the ability to originate and distribute financial products in the primary and secondary markets; 6) changes in foreign exchange rates increases exposure; 7) changes in market rates and prices may adversely impact the value of financial products; 8) legislation or regulatory environments, requirements or changes adversely affect the businesses in which the company is engaged; 9) changes in accounting standards, rules or interpretations; 10) litigation liabilities, including costs, expenses, settlements and judgments, may adversely affect the company or its businesses; 11) mergers and acquisitions and their integration into the company; and 12) decisions to downsize, sell or close units or otherwise change the business mix of any of the company. Accordingly, readers are cautioned not to place undue reliance on forward-looking statements, which speak only as of the date on which they are made. Bank of America does not undertake to update forward-looking statements to reflect the impact of circumstances or events that arise after the date the forward-looking statements are made. For further information regarding Bank of America Corporation, please read the Bank of America reports filed with the SEC and available at www.sec.gov. 2
- 3. Important Presentation Format Information • Certain prior period amounts have been reclassified to conform to current period presentation • The Corporation reports its Global Consumer & Small Business Banking (GCSBB) results, specifically Card Services, on a managed basis. Refer to Exhibit A in the Supplemental Package for a reconciliation from Managed to Held results 3
- 4. 2Q08 Summary Items • Diluted EPS of $0.72, $0.75 excluding merger and restructuring charges – Good business growth and strong expense management offset by higher credit costs – Merger and restructuring charges - $134 million (after-tax), $.03 per share • Record revenue quarter at $20.3 billion • Net interest income up due to beneficial impact of the expanded net interest yield, loan and deposit growth, and market-based activity • Capital markets disruption charges of $1.2 billion, $1.6 billion lower than 1Q08, including: – CDO and subprime - $645 million, net of hedge activities – Commercial real estate capital markets - $263 million – Leveraged lending - $64 million • Provision expense of $5.8 billion (includes $2.2 billion reserve increase) • Efficiency ratio of 47% • Capital position improved with a Tier 1 capital ratio of 8.25% and tangible equity ratio of 4.62% • Closed Countrywide acquisition on July 1st 4
- 5. Consolidated Highlights ($ in millions) Increase (decrease) over 2Q08 2Q07 1Q08 Net interest income (FTE) $ 10,937 $ 2,153 $ 646 Noninterest income 9,694 (1,542) 2,682 Total revenue, net of interest expense (FTE) 20,631 611 3,328 Provision for credit losses 5,830 4,020 (180) Noninterest expense 9,564 409 369 Pre-tax income 5,237 (3,818) 3,139 Income tax expense (FTE) 1,827 (1,467) 939 Net income $ 3,410 $ (2,351) $ 2,200 Preferred dividends $ 186 $ 146 $ (4) Diluted EPS 0.72 (0.56) 0.49 After tax effect of merger charge 134 87 27 Return on common equity 1 9.63 % (807) bps 643 bps Tangible return on equity 1 17.05 N/M N/M 1 Measures shown on an operating basis. Please refer to the Supplemental Information Package for more information. 5
- 6. 1,2 Consolidated Highlights Adjusted to a Managed Basis ($ in millions) Increase (decrease) over 2Q08 2Q07 1Q08 Net interest income (FTE) $ 13,191 $ 2,455 $ 810 Noninterest income 9,084 (1,462) 2,746 Total revenue, net of interest expense (FTE) 22,275 993 3,556 3 Provision for credit losses 7,474 4,402 48 Noninterest expense 9,564 409 369 Pre-tax income 5,237 (3,818) 3,139 Income tax expense (FTE) 1,827 (1,467) 939 Net income $ 3,410 $ (2,351) $ 2,200 Preferred dividends $ 186 $ 146 $ (4) Diluted EPS 0.72 (0.56) 0.49 After tax effect of merger charge 134 87 27 4 Return on common equity 9.63 % (807) bps 643 bps 4 Tangible return on equity 17.05 N/M N/M 1 Managed basis assumes that loans that have been securitized were not sold and presents earnings on these loans in a manner similar to the way loans that have not been sold (i.e., held loans) are presented. Noninterest income, both on a held and managed basis, includes the impact of adjustments to the interest-only strip that are recorded in card income. 2 Represents the Consolidated FTE results plus the loan securitization adjustments, related to Card Services, utilizing actual bond costs. This is different from GCSBB which utilizes fund transfer pricing methodology. See Reconciliation of Presented Held to Managed Basis on pages 38-40. 3 Represents the provision for credit losses on held loans combined with realized credit losses associated with the Card Services securitized loan portfolio. 4 Measures shown on an operating basis. Please refer to the Supplemental Information Package for more information. 6
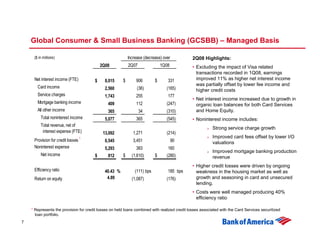
- 7. Global Consumer & Small Business Banking (GCSBB) – Managed Basis ($ in millions) Increase (decrease) over 2Q08 Highlights: 2Q08 2Q07 1Q08 • Excluding the impact of Visa related transactions recorded in 1Q08, earnings Net interest income (FTE) $ 8,015 $ 906 $ 331 improved 11% as higher net interest income was partially offset by lower fee income and Card income 2,560 (36) (165) higher credit costs Service charges 1,743 255 177 • Net interest income increased due to growth in Mortgage banking income 409 112 (247) organic loan balances for both Card Services All other income 365 34 (310) and Home Equity. Total noninterest income 5,077 365 (545) • Noninterest income includes: Total revenue, net of Strong service charge growth interest expense (FTE) 13,092 1,271 (214) Improved card fees offset by lower I/O Provision for credit losses 1 6,545 3,451 90 valuations Noninterest expense 5,293 383 160 Improved mortgage banking production Net income $ 812 $ (1,610) $ (280) revenue • Higher credit losses were driven by ongoing Efficiency ratio 40.43 % (111) bps 185 bps weakness in the housing market as well as Return on equity 4.89 (1,087) (176) growth and seasoning in card and unsecured lending. • Costs were well managed producing 40% efficiency ratio 1 Represents the provision for credit losses on held loans combined with realized credit losses associated with the Card Services securitized loan portfolio. 7
- 8. Global Consumer & Small Business Banking (GCSBB) – Managed Basis ($ in millions) Revenue of $13.1 billion, 11% over 2Q07 • Net interest income of $8.0 billion increased 13% 14,000 – Avg. loan growth of 16% from 2Q07 12,000 5,077 5,622 – Avg. deposits grew 5% over 2Q07 10,000 4,712 – Spreads expanded 38 bps 8,000 6,000 • Noninterest income of $5.1 billion improved 8% 4,000 8,015 7,684 – Service charge revenue grew 17% driven by account growth. 7,109 2,000 – Mortgage banking income increased due to production income driven by improved margins on mortgage volume originated for - 2Q08 2Q07 1Q08 distribution and higher servicing income. Net interest income Noninterest income Managed credit costs of $6.5 billion, up $3.5 billion from 2Q07, and $90 million from 1Q08 ($ in millions) • Managed net losses of $4.7 billion in 2Q08 7,000 – Total Corp., home equity net loss ratio rose to 3.08% from 1.71% 6,000 in 1Q08 1,824 5,000 2,762 – Consumer credit card managed net loss ratio increased to 5.96% 4,000 from 5.19% in 1Q08 3,000 432 • Increased reserves, in GCSBB, $1.8 billion in 2Q08 4,721 2,000 3,693 – $1.2 billion home equity 2,662 1,000 – $0.5 billion unsecured lending - – $0.1 billion residential mortgage 2Q08 2Q07 1Q08 8 Managed net losses Reserve build
- 9. Global Consumer & Small Business Banking (GCSBB) – Managed Basis (units in thousands) 1,400 1,200 Gross product sales of 13 million, 4% over 2Q07 1,000 590 516 644 • Strong growth in deposits, debit and online banking 800 • Banking center channel represented 63% of sales in 2Q08 600 400 • Consumer real estate production down reflecting current 674 717 557 environment 200 - 2Q08 2Q07 1Q08 Net new checking Net new savings ($ in billions) 600 Average retail deposits of $528.3 billion, 12% over 2Q07 and 1.4% over 1Q08 500 193.5 183.4 • Year-over-year increase driven by growth in core retail and the 400 152.0 addition of LaSalle and U.S. Trust. 300 • Linked quarter growth driven by consumer checking as well as traditional savings products 200 334.8 320.3 337.5 • GCSBB successfully migrated $5.6 billion to Premier Banking and 100 Investments in 2Q08. - 2Q08 2Q07 1Q08 9 GCSBB GWIM and Business Banking
- 10. Global Wealth & Investment Management (GWIM) ($ in millions) Increase (decrease) over 2Q08 Highlights: 2Q08 2Q07 1Q08 • Net Interest Income increased due to higher loan and deposit levels and benefits of the rate Net interest income (FTE) $ 1,133 $ 184 $ 135 environment. Inv. & brokerage services 1,095 232 14 • Noninterest income increased $206 million or All other income (loss) 22% from 2Q07 driven by: 51 (26) 208 Total noninterest income 1,146 206 222 Asset management fees increased 31% primarily due to the U.S. Trust and Total revenue, net of LaSalle acquisitions. interest expense (FTE) 2,279 390 357 Provision for credit losses Brokerage income increased 10% to 119 132 (124) $193 million. Noninterest expense 1,241 248 (74) • Lower cash funds support provided in 2Q08 vs. Net income $ 573 $ (3) $ 344 1Q08 ($36 million vs. $220 million) • The increase in provision for credit losses from Efficiency ratio 54.44 % 187 bps (1,399) bps 2Q07 was driven by higher losses and reserve 19.58 increases from the impact of deterioration in Return on equity (677) 1,163 the housing market. 10
- 11. Global Corporate & Investment Banking (GCIB) 2Q08 Highlights: ($ in millions) Increase (decrease) over 2Q08 2Q07 1Q08 • Net interest income increased due to benefits of the interest rate environment, broad based Net interest income (FTE) $ 3,824 $ 1,215 $ 233 strength in lending as well as strong deposit Card income 296 9 46 growth in Treasury Services. Service charges 856 173 68 Inv. & brokerage services • Average loans were up $10 billion from 1Q08 210 (11) (35) Investment banking income 765 (56) 100 • Noninterest income increased from 1Q08 Trading account profits including $1.6 billion lower charges for capital (losses) 369 (568) 2,159 market disruptions and a strong investment All other income (loss) (360) (745) 230 banking quarter. Total noninterest income 2,136 (1,198) 2,568 Service charges were up 9% from 1Q08 Total revenue, net of and 19% from 2Q07 (excluding interest expense (FTE) 5,960 17 2,801 LaSalle) on good volume growth Provision for credit losses 363 321 (160) • The decrease in provision for credit losses was Noninterest expense 2,801 (426) 337 driven by a lower reserve build in the second Net income $ 1,746 $ 54 $ 1,639 quarter. Efficiency ratio 46.99 % (732) bps 3,101 bps Return on equity 11.57 (458) 1,084 11
- 12. All Other – Including GCSBB Securitization Eliminations 1 ($ in millions) Increase (decrease) over 2Q08 Highlights: 2Q08 2Q07 1Q08 • Noninterest income declined from 2Q07 Net interest income (FTE) primarily as a result of lower gains from $ (2,035) $ (152) $ (53) Principal Investing including the $600 million Card income 595 (81) (69) increase in value of private equity funds Equity investment income 710 (1,009) 442 during 2Q07, which were sold to Conversus Gains on sales of debt Capital, L.P. securities 131 129 (89) All other income (loss) (101) 46 153 Total noninterest income 1,335 (915) 437 Total revenue, net of interest expense (FTE) (700) (1,067) 384 2 Provision for credit losses (1,197) 116 14 Noninterest expense 17 67 (96) Merger charges 212 137 42 Net income (loss) $ 279 $ (792) $ 497 1 All Other’s results include a “securitization offset” which removes the impact of Card Services’ securitized loans in order to present the consolidated results on a GAAP basis (i.e., held basis). 2 Represents the provision for credit losses in All Other combined with the GCSBB securitization offset. 12
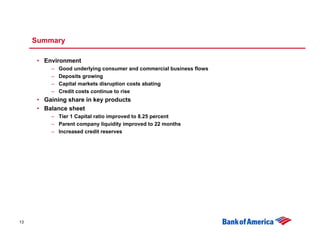
- 13. Summary • Environment – Good underlying consumer and commercial business flows – Deposits growing – Capital markets disruption costs abating – Credit costs continue to rise • Gaining share in key products • Balance sheet – Tier 1 Capital ratio improved to 8.25 percent – Parent company liquidity improved to 22 months – Increased credit reserves 13
- 14. Capital Markets Records Strong Investment Banking • Sales and trading favorability was largely driven by lower charges for market disruption impacts during 2Q08 vs. 1Q08, but also include core product favorability. ($ in millions) 2Q08 Total Sales & Trading Investment Banking Liquid Products $ 1,323 $ 1,290 $ 33 Credit Products 913 495 418 Structured Products (801) (923) 122 Equities 408 298 110 Other 82 - 82 Total $ 1,925 $ 1,160 $ 765 Change in revenue from 1Q08 Total Sales & Trading Investment Banking Liquid Products $ 579 $ 568 $ 11 Credit Products 1,194 1,008 186 Structured Products 976 930 46 Equities (165) (35) (130) Other (13) - (13) Total $ 2,571 $ 2,471 $ 100 • Excludes $25 million and $27 million margin from FVO loan book for 2Q08 and 1Q08 14
- 15. Key Capital Markets Risk Exposures ($ in millions) Exposures 6/30/2008 3/31/2008 Leveraged lending related: Net new commitments 3,207 Prior commitments – funded/terminated/changed (3,039) EOP Unfunded commitments 4,061 3,893 Net new additions 122 Sold or syndicated (3,518) EOP Funded commitments 6,154 9,550 Net writedown (64) (439) Capital markets commercial mortgage related: Unfunded commitments 717 877 Funded commitments 8,487 11,144 Net writedown (79) (191) Other capital markets commercial mortgage writedowns (184) Super Senior CDO and other subprime related: Super senior subprime, net of insurance 3,501 5,935 Super senior nonsubprime, net of insurance 3,260 3,350 Retained positions from terminated deals 1,667 264 Net writedown (645) (1,465) 15
- 16. Super Senior CDO Exposure (Dollars in millions) Total CDO Exposure at June 30, 2008 Total CDO (1) (2) Subprime Exposure Non-Subprime Exposure Net Exposure Net of Net of Insured Cumulative Net Insured Cumulative Net June 30 March 31 (3) (3) Gross Insured Amount Writedowns Exposure Gross Insured Amount Writedowns Exposure 2008 2008 Super senior liquidity commitments High grade $- $- $- $- $- $714 $- $714 $- $714 $714 $2,892 Mezzanine 363 - 363 (5) 358 - - - - - 358 358 CDO-squared - - - - - - - - - - - 414 Total super senior liquidity commitments 363 - 363 (5) 358 714 - 714 - 714 1,072 3,664 Other super senior exposure High grade 5,170 (3,741) 1,429 (367) 1,062 3,463 (735) 2,728 (182) 2,546 3,608 3,429 Mezzanine 1,019 - 1,019 (742) 277 - - - - - 277 495 CDO-squared 5,107 - 5,107 (3,303) 1,804 365 (365) - - - 1,804 1,697 Total other super senior exposure 11,296 (3,741) 7,555 (4,412) 3,143 3,828 (1,100) 2,728 (182) 2,546 5,689 5,621 Total super senior exposure excluding retained securities on CDOs that have since been liquidated $11,659 $(3,741) $7,918 $(4,417) $3,501 $4,542 $(1,100) $3,442 $(182) $3,260 $6,761 $9,285 Retained securities on CDOs that have since been liquidated $1,667 $1,667 $264 Total super senior CDO exposure and retained securities $5,168 $8,428 $9,549 (1) Classified as subprime when subprime consumer real estate loans make up at least 35 percent of the ultimate underlying collateral. (2) Includes highly-rated collateralized loan obligations and commercial mortgage-backed securities super senior exposure. (3) Net of insurance. Represents remaining CDOs. 16
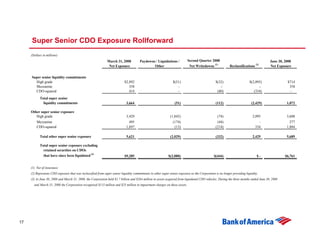
- 17. Super Senior CDO Exposure Rollforward (Dollars in millions) March 31, 2008 Paydowns / Liquidations / Second Quarter 2008 June 30, 2008 Net Exposure Other Net Writedowns (1) Reclassifications (2) Net Exposure Super senior liquidity commitments High grade $2,892 $(51) $(32) $(2,095) $714 Mezzanine 358 - - - 358 CDO-squared 414 - (80) (334) - Total super senior liquidity commitments 3,664 (51) (112) (2,429) 1,072 Other super senior exposure High grade 3,429 (1,842) (74) 2,095 3,608 Mezzanine 495 (174) (44) - 277 CDO-squared 1,697 (13) (214) 334 1,804 Total other super senior exposure 5,621 (2,029) (332) 2,429 5,689 Total super senior exposure excluding retained securities on CDOs that have since been liquidated (3) $9,285 $(2,080) $(444) $- $6,761 (1) Net of insurance. (2) Represents CDO exposure that was reclassified from super senior liquidity commitments to other super senior exposure as the Corporation is no longer providing liquidity. (3) At June 30, 2008 and March 31, 2008, the Corporation held $1.7 billion and $264 million in assets acquired from liquidated CDO vehicles. During the three months ended June 30, 2008 and March 31, 2008 the Corporation recognized $115 million and $25 million in impairment charges on these assets. 17
- 18. Subprime Super Senior CDO Exposure Carrying Values (Dollars in millions) June 30, 2008 Vintage of Subprime Collate ral Carrying Value as a Subprime pe rce nt of Subprime Pe rce nt in Pe rce nt in Ne t original ne t Conte nt of 2006/2007 2005/prior Exposure e xposure Collate ral (1) Vintage s Vintage s Super senior liquidity commitments High grade $- - % - % - % -% Mezzanine 358 99 34 55 45 CDO-squared - - - - - Total super senior liquidity commitments 358 99 Other super senior exposure High grade 1,062 73 53 13 87 Mezzanine 277 28 81 59 41 CDO-squared 1,804 33 23 71 29 Total other super senior exposure 3,143 39 Total super senior exposure excluding retained securities on CDOs that have since been liquidated $3,501 42 Retained securities on CDOs that have since been liquidated $1,667 44 51 43 57 Total super senior CDO exposure and retained securities $5,168 43 1 Based on current net exposure value. 18
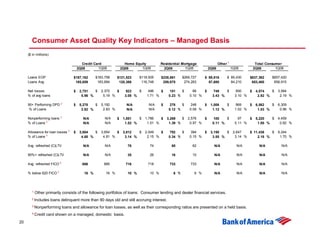
- 19. Asset Quality • Sustained stress from housing markets and other economic pressures including increasing fuel and food prices drove consumer losses higher. Additional weakening came from seasoning of growth portfolios. • Managed net credit loss ratio across all businesses was 2.15%, up 46 basis points from 1Q08 – Held net charge-offs increased to 1.67%, up 42 basis points from 1Q08 • Provision was higher than net charge-offs by $2.2 billion increasing allowance for loans and leases ratio to 1.98% from 1.71% in 1Q08 – Housing market related $1.3 billion in home equity $0.4 billion residential mortgage $0.1 billion commercial homebuilder deterioration – Seasoning and deterioration $0.5 billion unsecured lending • Consumer card losses trended higher – Managed consumer credit card net loss rate increased to 5.96% from 5.19% in 1Q08. 30+ day delinquencies decreased to 5.53% from 5.61% in 1Q08. 90+ day delinquencies decreased to 2.82% from 2.83% in 1Q08. • Small business net loss ratio increased 222 basis points to 9.53%. • Commercial net charge-off ratio excluding small business increased slightly from 0.26% in 1Q08 to 0.28%. 19
- 20. Consumer Asset Quality Key Indicators – Managed Basis ($ in millions) Credit Card Home Equity Residential Mortgage Other 1 Total Consumer 2Q08 1Q08 2Q08 1Q08 2Q08 1Q08 2Q08 1Q08 2Q08 1Q08 Loans EOP $187,162 $183,758 $121,523 $118,505 $238,861 $269,727 $ 89,816 $ 85,430 $637,362 $657,420 Loans Avg 185,659 183,694 120,386 116,748 259,675 274,263 87,680 84,210 653,400 658,915 Net losses $ 2,751 $ 2,372 $ 923 $ 496 $ 151 $ 66 $ 749 $ 650 $ 4,574 $ 3,584 % of avg loans 5.96 % 5.19 % 3.08 % 1.71 % 0.23 % 0.10 % 3.43 % 3.10 % 2.82 % 2.19 % 90+ Performing DPD 2 $ 5,278 $ 5,192 N/A N/A $ 278 $ 248 $ 1,006 $ 869 $ 6,562 $ 6,309 % of Loans 2.82 % 2.83 % N/A N/A 0.12 % 0.09 % 1.12 % 1.02 % 1.03 % 0.96 % Nonperforming loans 3 N/A N/A $ 1,851 $ 1,786 $ 3,269 $ 2,576 $ 100 $ 97 $ 5,220 $ 4,459 % of Loans 3 N/A N/A 1.52 % 1.51 % 1.39 % 0.97 % 0.11 % 0.11 % 1.00 % 0.82 % Allowance for loan losses 3 $ 3,684 $ 3,654 $ 3,812 $ 2,549 $ 792 $ 394 $ 3,150 $ 2,647 $ 11,438 $ 9,244 % of Loans 3 4.68 % 4.81 % 3.14 % 2.15 % 0.34 % 0.15 % 3.55 % 3.14 % 2.18 % 1.70 % Avg. refreshed (C)LTV N/A N/A 78 74 65 62 N/A N/A N/A N/A 90%+ refreshed (C)LTV N/A N/A 35 26 16 10 N/A N/A N/A N/A Avg. refreshed FICO 4 686 685 716 718 733 733 N/A N/A N/A N/A % below 620 FICO 4 16 % 16 % 10 % 10 % 6 % 6 % N/A N/A N/A N/A 1 Other primarily consists of the following portfolios of loans: Consumer lending and dealer financial services. 2 Includes loans delinquent more than 90 days old and still accruing interest. 3 Nonperforming loans and allowance for loan losses, as well as their corresponding ratios are presented on a held basis. 4 Credit card shown on a managed, domestic basis. 20
- 21. Consumer Real Estate Asset Quality – Managed Basis Home Equity • Net loss ratio climbed 137 basis points from 1Q08 to 3.08% – Net losses of $923 million driven by high CLTV loans – Loans with >90% CLTV represents 35% of portfolio – 17% in first lien position, 27% have a first lien position with BAC in front of BAC second – CA and FL represent 41% of the portfolio • Allowance was increased to cover 3.14% of loans • Nonperforming loans were largely unchanged at 1.52% of loans • 30+ performing delinquencies improved 6 basis points to 1.27% Residential Mortgage • Net loss ratio climbed 13 basis points from 1Q08 to .23% – Net losses of $151 million largely driven by CRA portfolio (8% of loans) and housing stressed states – Loans with >90% CLTV represents 16% of portfolio – CA and FL represent 41% of the portfolio • Allowance was increased to cover .34% of loans • Nonperforming loans increased $693 million to 1.39% of loans • 30+ performing delinquencies increased to 2.07% 21
- 22. Other Consumer Lending Asset Quality – Managed Basis Consumer Credit Card • Net loss ratio climbed 77 basis points to 5.96% – Increase centered in geographies of housing stress • 30+ delinquencies improved 8 basis points to 5.53% of loans • 90+ delinquencies improved 1 basis point to 2.82% of loans • CA and FL represent 24% of the domestic card portfolio 22
- 23. Commercial Asset Quality Key Indicators 1 ($ in millions) Commercial Real Commercial Lease Commercial 2 Estate Small Business Financing Total Commercial 2Q08 1Q08 2Q08 1Q08 2Q08 1Q08 2Q08 1Q08 2Q08 1Q08 Loans EOP $235,541 $219,171 $ 62,897 $ 62,739 $ 19,908 $ 20,142 $ 22,815 $ 22,132 $341,161 $324,184 Loans Avg 227,488 218,467 62,640 61,890 20,123 20,022 22,276 22,227 332,527 322,606 Net charge-offs $ 75 $ 70 $ 136 $ 107 $ 477 $ 364 $ 6 $ 15 $ 694 $ 556 % of avg loans 0.13 % 0.13 % 0.88 % 0.70 % 9.53 % 7.31 % 0.11 % 0.27 % 0.84 % 0.69 % 90+ Performing DPD $ 278 $ 191 $ 262 $ 223 $ 594 $ 547 $ 27 $ 32 $ 1,161 $ 993 % of Loans 0.12 % 0.09 % 0.42 % 0.36 % 2.98 % 2.72 % 0.12 % 0.14 % 0.34 % 0.31 % Nonperforming loans $ 1,127 $ 1,034 $ 2,616 $ 1,627 $ 153 $ 169 $ 40 $ 44 $ 3,936 $ 2,874 % of Loans 0.48 % 0.47 % 4.16 % 2.59 % 0.77 % 0.84 % 0.18 % 0.20 % 1.15 % 0.89 % Allowance for loan losses $ 2,083 $ 2,180 $ 1,333 $ 1,206 $ 2,078 $ 2,034 $ 199 $ 227 $ 5,693 $ 5,647 % of Loans 0.88 % 0.99 % 2.12 % 1.92 % 10.44 % 10.10 % 0.87 % 1.03 % 1.67 % 1.74 % Criticized Utilized Exposure 3 $ 15,630 $ 11,857 $ 10,776 $ 9,208 $ 1,060 $ 1,021 $ 870 $ 647 $ 28,336 $ 22,733 % of Total Exposure 4.48 % 3.59 % 15.62 % 13.36 % 5.29 % 5.04 % 3.81 % 2.92 % 6.15 % 5.15 % • Homebuilder utilized balances at 6/30/08, included in commercial real estate, down slightly from 1Q08 to $13 billion. These utilized balances are included in total binding exposure which was $19 billion. – Criticized utilized exposure increased $863 million to $7.5 billion (57% of utilized exposure) – NPAs rose $868 million to $2.2 billion – 2Q08 charge-offs of $130 million (vs $107 million in 1Q08) 1 Does not include certain commercial loans measured at fair value in accordance with SFAS 159. 2 Includes Commercial – Domestic and Commercial – Foreign. 3 Excludes Assets Held for Sale. 23
- 24. Net Interest Income Linked Quarter Net Interest Income & Yield ($ in millions) 2Q08 1Q08 $ Change Reported net interest income (FTE) $ 10,937 $ 10,291 $ 646 Market-based NII (1,369) (1,308) (61) Core net interest income (FTE) 9,568 8,983 585 Impact of securitizations 2,254 2,090 164 Core NII – Managed Basis $ 11,822 $ 11,073 $ 749 Average earning assets $ 1,500,234 $ 1,510,295 $ (10,061) Market-based earning assets (375,274) (403,733) 28,459 Impact of securitizations 103,131 102,577 554 Reported net interest yield 2.92 % 2.73 % 19 bps Core net interest yield 3.41 3.25 16 Core net interest yield – Managed Basis 3.86 3.67 19 • Change in core net interest income – managed basis driven by: Rate benefit from the short-end led steepener Benefits of solid loan and deposit growth Market based increase driven by improved spreads and trading strategies Average earnings assets reflect trading asset reductions as well as strong loan growth 24
- 25. Net Interest Income – Managed Sensitivity ($ in millions) Managed net interest income impact for next 12 months @ 6/30/08 @ 3/31/08 Forward curve interest rate scenarios +100 bp parallel shift $ (1,189) $ (865) - 100 bp parallel shift 1,113 527 Flattening scenario from forward curve + 100 bp flattening on short end (1,283) (1,153) - 100 bp flattening on long end (234) (614) Steepening scenario from forward curve + 100 bp steepening on long end 93 275 - 100 bp steepening on short end 1,350 1,112 25
- 26. 26
- 27. Bank of America NII Sensitivity on a Managed Basis First Rolling 12 Months March 31, 2008 300 Year 1 FF: 3.75 10-Y: 5.38 NII ∆: -2,009 200 Curve Flatteners NII ∆: -1,869 FF: 2.75 10-Y: 4.38 NII ∆: -1,153 100 NII ∆: -865 Stable FF: 2.25 10-Y: 4.08 Change in Fed Funds FF: 1.75 NII ∆: -1,277 FF: 1.75 10-Y: 3.38 10-Y: 5.38 NII ∆: -614 NII ∆: 275 0 -300 -200 -100 0 1 Yr Fwd Rates 100 200 300 Avg Mar '09 FF: 1.75 10-Y: 4.38 NII ∆: 527 -100 FF: 0.75 10-Y: 4.38 NII ∆: 1,112 NII ∆: 577 -200 Curve Steepeners FF: 0.00 10-Y: 3.38 NII ∆: 1,404 -300 Change in 10-yr Swap 27
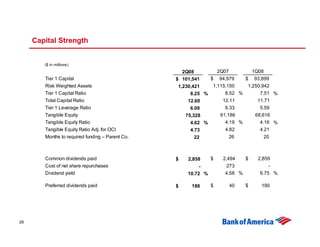
- 28. Capital Strength ($ in millions) 2Q08 2Q07 1Q08 Tier 1 Capital $ 101,541 $ 94,979 $ 93,899 Risk Weighted Assets 1,230,421 1,115,150 1,250,942 Tier 1 Capital Ratio 8.25 % 8.52 % 7.51 % Total Capital Ratio 12.60 12.11 11.71 Tier 1 Leverage Ratio 6.09 6.33 5.59 Tangible Equity 75,328 61,186 68,616 Tangible Equity Ratio 4.62 % 4.19 % 4.16 % Tangible Equity Ratio Adj. for OCI 4.73 4.82 4.21 Months to required funding – Parent Co. 22 26 20 Common dividends paid $ 2,858 $ 2,494 $ 2,859 Cost of net share repurchases - 273 - Dividend yield 10.72 % 4.58 % 6.75 % Preferred dividends paid $ 186 $ 40 $ 190 28
- 29. Conclusions • Environment remains challenging – Credit costs reflect economic environment – Capital markets still fragile • Momentum remains strong in most businesses – Retail deposits and lending growing – Commercial lending and treasury services remain steady – Wealth management showing steady customer activity and performance • Balance sheet remains strong • Integration of acquisitions on track 29
- 30. Countrywide Operational Update • Transaction closed July 1, 2008 • Consumer real estate headquarters will be in Calabasas • Barbara Desoer named as consumer real estate executive based in California • Management teams largely in place with balance between both legacy organizations • Announced 7,500 positions to be reduced as a result of the acquisition • Operational consolidation on track: Consolidated many back office and risk management operational activities Aligning deposit pricing with Bank of America processes Consolidated much of the capital markets platforms immediately Implementing management and sales routines across all products • Business model commitments Reaffirmed commitment to Wholesale and Correspondent channels in mortgage Will continue to offer Conforming loans underwritten to standard guidelines of government-sponsored enterprises and the government including CRA No subprime mortgage origination Discontinue certain nontraditional mortgages, including option-ARMs, and significantly curtail use of low documentation loans Expect to modify or workout $40 billion in troubled mortgage loans over the next 2 years Creating $35 million “Neighborhood Preservation Program” for counseling and foreclosure prevention 30
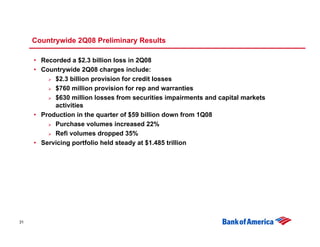
- 31. Countrywide 2Q08 Preliminary Results • Recorded a $2.3 billion loss in 2Q08 • Countrywide 2Q08 charges include: $2.3 billion provision for credit losses $760 million provision for rep and warranties $630 million losses from securities impairments and capital markets activities • Production in the quarter of $59 billion down from 1Q08 Purchase volumes increased 22% Refi volumes dropped 35% • Servicing portfolio held steady at $1.485 trillion 31
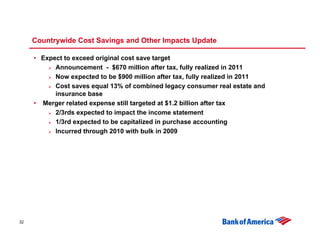
- 32. Countrywide Cost Savings and Other Impacts Update • Expect to exceed original cost save target Announcement - $670 million after tax, fully realized in 2011 Now expected to be $900 million after tax, fully realized in 2011 Cost saves equal 13% of combined legacy consumer real estate and insurance base • Merger related expense still targeted at $1.2 billion after tax 2/3rds expected to impact the income statement 1/3rd expected to be capitalized in purchase accounting Incurred through 2010 with bulk in 2009 32
- 33. Preliminary Countrywide Results ($ in millions) Quarters ended Six months ended June 30, 2008 June 30, 2007 March 31, 2008 June 30, 2008 June 30, 2007 Net interest income $ 656 $ 728 $ 731 $ 1,387 $ 1,459 Noninterest income: (Loss) gain on sale of loans (127) 1,494 289 162 2,727 Net loan servicing fees and other income (23) 100 456 433 199 Net insurance premiums 485 352 489 974 687 Loss on AFS securities (468) (5) (24) (492) (4) Other 185 172 239 424 331 Total noninterest income 52 2,113 1,449 1,501 3,940 Total Revenue 708 2,841 2,180 2,888 5,399 Provision for loan losses 2,331 293 1,501 3,832 445 Noninterest expense 2,193 1,884 2,171 4,364 3,589 Pre - tax income (loss) (3,816) 664 (1,492) (5,308) 1,365 Income tax expense (1,486) 179 (599) (2,085) 446 Net Income (loss) $ (2,330) $ 485 $ (893) $ (3,223) $ 919 Mortgage loan fundings $ 59,012 $ 130,163 $ 73,013 $ 132,025 $ 245,127 Non-purchase 33,818 74,916 52,319 86,137 146,714 Purchase 25,194 55,247 20,694 45,888 98,413 Mortgage loan pipeline 25,727 68,533 45,529 Loan servicing portfolio (1) 1,485,285 1,415,472 1,484,157 MSR portfolio (2) 1,365,869 1,304,250 1,361,945 MSR Value 18,402 20,087 17,155 (1) Includes loans held for sale, loans held for investment and loans serviced for others, including those under subservicing agreements (2) Represents loan servicing portfolio reduced for loans held for sale, loans held for investment and subservicing 33
- 34. Preliminary Countrywide Balance Sheet ($ in billions) June 30, 2008 March 31, 2008 Loans: Held for sale $ 11.8 $ 15.7 Held for investment 99.3 98.6 Total Loans 111.1 114.3 Allowance for loan losses (5.1) (3.4) Securites purchased under agreement to resell, securities borrowed and fed funds sold 6.6 7.8 Investments in other financial instruments 18.8 20.9 MSR, at estimated fair value 18.4 17.2 Other assets 22.3 42.2 Total assets $ 172.1 $ 199.0 Deposits $ 62.8 $ 63.3 Securities sold under agreement to repurchase 3.5 17.9 Notes payable 82.3 87.7 Other liabilities 13.1 16.9 Total liabilities 161.7 185.8 Shareholders' equity 10.4 13.2 Total liabilities and shareholders' equity $ 172.1 $ 199.0 34
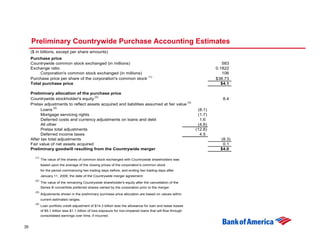
- 35. Preliminary Countrywide Purchase Accounting Estimates ($ in billions, except per share amounts) Purchase price Countrywide common stock exchanged (in millions) 583 Exchange ratio 0.1822 Corporation's common stock exchanged (in millions) 106 (1) Purchase price per share of the corporation's common stock $38.73 Total purchase price $4.1 Preliminary allocation of the purchase price (2) Countrywide stockholder's equity 8.4 (3) Pretax adjustments to reflect assets acquired and liabilities assumed at fair value (4) Loans (8.1) Mortgage servicing rights (1.7) Deferred costs and currency adjustments on loans and debt 1.6 All other (4.6) Pretax total adjustments (12.8) Deferred income taxes 4.5 After tax total adjustments (8.3) Fair value of net assets acquired 0.1 Preliminary goodwill resulting from the Countrywide merger $4.0 (1) The value of the shares of common stock exchanged with Countrywide shareholders was based upon the average of the closing prices of the corporation's common stock for the period commencing two trading days before, and ending two trading days after January 11, 2008, the date of the Countrywide merger agreement. (2) The value of the remaining Countrywide shareholder's equity after the cancellation of the Series B convertible preferred shares owned by the corporation prior to the merger. (3) Adjustments shown in the preliminary purchase price allocation are based on values within current estimated ranges. (4) Loan portfolio credit adjustment of $14.3 billion less the allowance for loan and lease losses of $5.1 billion less $1.1 billion of loss exposure for non-impaired loans that will flow through consolidated earnings over time, if incurred. 35
- 36. Preliminary Countrywide Asset Quality – 2Q08 (Loans in billions, other $ in millions) Mortgage and Home Equity Loans 30+ and Loans % Loans Net C/O C/O Ratio performing NPL Prime Firsts $ 29.6 32 % $ 107 1.45 % 3.8 % 6.3 % Prime Pay Options 26.4 29 259 3.92 7.7 12.7 HELOCs 14.5 16 290 7.99 3.2 3.5 Fixed Rate Seconds 18.9 20 182 3.86 3.1 2.1 Sub-prime 2.4 3 91 14.92 18.4 26.7 Total $ 91.8 100 % $ 929 4.05 % 5.1 % 7.4 % Mortgage and Home Equity Loans Loans Refreshed Refreshed Refreshed Loans % Loans % CA /FL Avg. CLTV (1) >90 CLTV (1) Avg. FICO (1) Prime Firsts $ 29.6 32 % 53 % 71 % 26 % 723 Prime Pay Options 26.4 29 66 95 62 680 HELOCs 14.5 16 45 88 50 697 Fixed Rate Seconds 18.9 20 29 91 66 716 Sub-prime 2.4 3 37 90 53 574 Total $ 91.8 100 % 50 % 85 % 48 % 703 Defaulted FHA-insured and VA- guaranteed loans eligible for repurchase from securities 2.8 Mortgage loans held in SPEs 3.4 Other 1.3 Total Loans Held for Investment $ 99.3 (1) Excludes $6 billion of loans serviced by others. CLTV computed off remaining balances. If computed from values after purchase accounting adjustments the average CLTV percentage for the portfolio would be in the low 70's. 36
- 37. Appendix 37
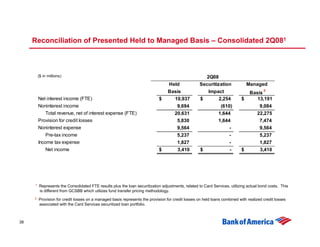
- 38. Reconciliation of Presented Held to Managed Basis – Consolidated 2Q081 ($ in millions) 2Q08 Held Securitization Managed Basis Impact 2 Basis Net interest income (FTE) $ 10,937 $ 2,254 $ 13,191 Noninterest income 9,694 (610) 9,084 Total revenue, net of interest expense (FTE) 20,631 1,644 22,275 Provision for credit losses 5,830 1,644 7,474 Noninterest expense 9,564 - 9,564 Pre-tax income 5,237 - 5,237 Income tax expense 1,827 - 1,827 Net income $ 3,410 $ - $ 3,410 1 Represents the Consolidated FTE results plus the loan securitization adjustments, related to Card Services, utilizing actual bond costs. This is different from GCSBB which utilizes fund transfer pricing methodology. 2 Provision for credit losses on a managed basis represents the provision for credit losses on held loans combined with realized credit losses associated with the Card Services securitized loan portfolio. 38
- 39. Reconciliation of Presented Held to Managed Basis – Consolidated 2Q071 ($ in millions) 2Q07 Held Securitization Managed Basis Impact 2 Basis Net interest income (FTE) $ 8,784 $ 1,952 $ 10,736 Noninterest income 11,236 (690) 10,546 Total revenue, net of interest expense (FTE) 20,020 1,262 21,282 Provision for credit losses 1,810 1,262 3,072 Noninterest expense 9,155 - 9,155 Pre-tax income 9,055 - 9,055 Income tax expense 3,294 - 3,294 Net income $ 5,761 $ - $ 5,761 1 Represents the Consolidated FTE results plus the loan securitization adjustments, related to Card Services, utilizing actual bond costs. This is different from GCSBB which utilizes fund transfer pricing methodology. 2 Provision for credit losses on a managed basis represents the provision for credit losses on held loans combined with realized credit losses associated with the Card Services securitized loan portfolio. 39
- 40. Reconciliation of Presented Held to Managed Basis – Consolidated 1Q081 ($ in millions) 1Q08 Held Securitization Managed Basis Impact 2 Basis Net interest income (FTE) $ 10,291 $ 2,090 $ 12,381 Noninterest income 7,012 (674) 6,338 Total revenue, net of interest expense (FTE) 17,303 1,416 18,719 Provision for credit losses 6,010 1,416 7,426 Noninterest expense 9,195 - 9,195 Pre-tax income 2,098 - 2,098 Income tax expense 888 - 888 Net income $ 1,210 $ - $ 1,210 1 Represents the Consolidated FTE results plus the loan securitization adjustments, related to Card Services, utilizing actual bond costs. This is different from GCSBB which utilizes fund transfer pricing methodology. 2 Provision for credit losses on a managed basis represents the provision for credit losses on held loans combined with realized credit losses associated with the Card Services securitized loan portfolio. 40
