SEM Days 2015: Growth hacking your digital marketing
- 1. Andraž Štalec @andrazstalec GROWTH HACKING YOUR DIGITAL MARKETING
- 7. 1 2 3 4
- 8. The Plan 1. Build a website 2. Put ecommerce on it 3. Get tons of free traffic 4. Get rich 5. Party with 3 sexy ladies 6. Party some more 7. Get even richer 8. Move to Dracula castle 9. Transform to vampire 10. Live forever long
- 10. 100 VISITS - 1 PURCHASE - 100 € IT SUCKS
- 13. WE NEED MORE TRAFFIC LET‘S START TO ADVERTISE 2.500 € investment | CPC = 0,25 € | 10.000 clicks
- 14. 10.000 VISITS - 5 PURCHASES - 500 € IT STILL SUCKS
- 15. ROI -80 %
- 16. PAUSE ALL ADVERTISING CAMPAIGNS IT‘S NOT WORKING … BUT AT LEAST WE BUILT SOME BRAND AWARENESS
- 17. 100 VISITS - 1 PURCHASE - 100 € WTF*?!
- 19. WTF SERIOUSLY
- 20. HOW THE F***??? How to increase revenue and profits?
- 21. INCREASE AVERAGE PURCHASE VALUE INCREASE TRAFFIC DECREASE CPA INCREASE CONVER. RATE DECREASE BOUNCE RATE IT‘S WEATHER RELATED IT‘S ALL ABOUT THE PAY DAY ADD PRODUCT RATINGS INCREASE PER SESSION VALUE DAY OF THE WEEK IT‘S THE MOON INCREASE USER RETENTION ADD COMPARE PRODUCTS INCREASE AVERAGE QUANTITY INCREASE AVERAGE UNIT PRICE INCREASE TIME ON SITE INCREASE READ RATE ADD SOCIAL ACTIONS How to do it?
- 23. 5 MILLION SESSIONS 130 MILLION DATA POINTS 12 MONTHS OF DATA
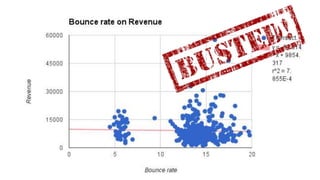
- 25. BOUNCE RATE Arrogant bastard, who‘s not as important as it seems.
- 27. WEATHER On the internet it is always sunny and 28°C.
- 29. THE MOON Sorry dear, I was moonwalking (and I was without € 100).
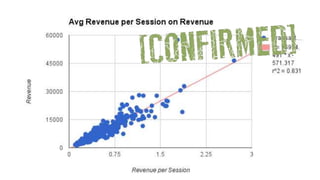
- 31. REVENUE PER SESSION You are worth 0,56 €.
- 33. NUMBER OF SESSIONS »Supersize me«.
- 35. AVERAGE ORDER VALUE Two pears and an apple.
- 37. CONVERSION RATE Everything is OK, but I won‘t buy it.
- 39. THE DAY OF THE MONTH Pay day. Let's go shopping!
- 41. REVIEWS COMPARE PRODUCTS SAVE TO WISH LIST CHECK STOCK Not really connected to Add to cart
- 42. REVENUE R2 = 0,947 R2 = 0,831 REVENUE PER VISITOR R2 = 0,961 R2 = 0,353 AVERAGE ORDER VALUE R2 = 0,754 CONVERSION RATE R2 = 0,570 ADD-TO-CART CONVERSION RATE R2 = 0,225 VISITORS USER AQUISITION USER RETENTION Ecommerce revenue streams
- 43. CONDUCT A BUSINESS OVERVIEW
- 44. REVENUE 2,0 M REVENUE PER VISITOR 1,00 € AVERAGE ORDER VALUE 50,00 € AVERAGE QUANTITY 2,00 AVERAGE PER UNIT PRICE 25,00 € CONVERSION RATE 2,00 % NUMBER OF STEPS AVERAGE COMPLETION RATE VISITORS 2,0 M USER AQUISITION 1,5 M USER RETENTION 33 % Ecommerce revenue streams
- 45. REVENUE 1.000 € REVENUE PER VISITOR 1,00 € AVERAGE ORDER VALUE 100,00 € AVERAGE QUANTITY AVERAGE PER UNIT PRICE CONVERSION RATE 1,00 % NUMBER OF STEPS AVERAGE COMPLETION RATE VISITORS 1.000 USER AQUISITION USER RETENTION Ecommerce revenue streams
- 46. MINIMAL SUCCESS VOLUME ~ 10.000 VISITORS
- 47. PROFIT REVENUE COSTS COGS CPA CPC CR OTHER COSTS Ecommerce profitability
- 48. PROFIT REVENUE 10 € COSTS COGS CPA 10 € CPC 0,10 € CR 1 % OTHER COSTS Ecommerce profitability
- 49. GROWTH HACKING
- 50. My ultimate success line (until now)
- 51. Dreaming about Growth hacking
- 52. Periods where progress is minimal Periods of significant progress Growth hacking in Real life
- 53. MEASURE ANALYZE OPTIMIZE DELIVER RESULTS How to do it?
- 54. FIND WEAK POINTS
- 55. REVENUE 2,0 M REVENUE PER VISITOR 1,00 € AVERAGE ORDER VALUE 50,00 € AVERAGE QUANTITY 2,00 AVERAGE PER UNIT PRICE 25,00 € CONVERSION RATE 2,00 % NUMBER OF STEPS AVERAGE COMPLETION RATE VISITORS 2,0 M USER AQUISITION 1,5 M USER RETENTION 33 % Ecommerce revenue streams
- 56. Why do so many users leave the cart? Are users changing the contents of the cart? How can we improve user experience? Funnel Visualization
- 57. Where should you spend your efforts?
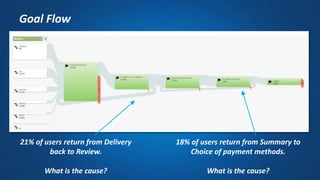
- 58. 21% of users return from Delivery back to Review. What is the cause? 18% of users return from Summary to Choice of payment methods. What is the cause? Goal Flow
- 59. REVENUE 2,0 M REVENUE PER VISITOR 1,00 € AVERAGE ORDER VALUE 50,00 € AVERAGE QUANTITY 2,00 AVERAGE PER UNIT PRICE 25,00 € CONVERSION RATE 2,00 % NUMBER OF STEPS AVERAGE COMPLETION RATE VISITORS 2,0 M USER AQUISITION 1,5 M USER RETENTION 33 % Ecommerce revenue streams
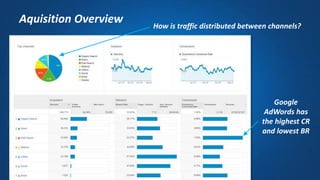
- 60. How is traffic distributed between channels? Google AdWords has the highest CR and lowest BR Aquisition Overview
- 61. Sessions - Ecommerce CR Treemap
- 63. Mobile Usage
- 64. REVENUE 2,0 M REVENUE PER VISITOR 1,00 € AVERAGE ORDER VALUE 50,00 € AVERAGE QUANTITY 2,00 AVERAGE PER UNIT PRICE 25,00 € CONVERSION RATE 2,00 % NUMBER OF STEPS AVERAGE COMPLETION RATE VISITORS 2,0 M USER AQUISITION 1,5 M USER RETENTION 33 % Ecommerce revenue streams
- 65. Top Exit Pages
- 66. The most visited page has a high Exit rateBehaviour Flow
- 67. Below average CTR Fold-line for 95% of users In-Page Analytics
- 68. Site Search
- 69. REVENUE 2,0 M REVENUE PER VISITOR 1,00 € AVERAGE ORDER VALUE 50,00 € AVERAGE QUANTITY 2,00 AVERAGE PER UNIT PRICE 25,00 € CONVERSION RATE 2,00 % NUMBER OF STEPS AVERAGE COMPLETION RATE VISITORS 2,0 M USER AQUISITION 1,5 M USER RETENTION 33 % Ecommerce revenue streams
- 70. Most valuable user category
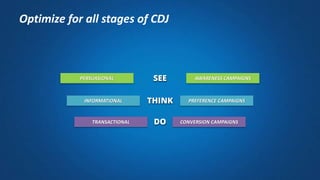
- 71. PERSUASIONAL AWARENESS CAMPAIGNS TRANSACTIONAL CONVERSION CAMPAIGNS PREFERENCE CAMPAIGNSINFORMATIONAL DO THINK SEE Optimize for all stages of CDJ
- 73. EXPERIMENT GOALS Increase advertising budget for high-end categories OPTIMIZATION GOALS Increase AOV BUSINESS UNIT GOALS Improve RPV COMPANY METRIC Increase revenue
- 74. Improve RPV Change CPC bids Ad Group #1 Ad Group #2 Ad Group #3 Change AvgPos Ad Group #1 Ad Group #2 Ad Group #3 Change LP Ad Group #1 Ad Group #2 Ad Group #3 Split Ad Groups Ad Group #1 Ad Group #2 Ad Group #3 Change targeting Ad Group #1 Ad Group #2 Ad Group #3 Change copy Ad Group #1 Ad Group #2 Ad Group #3 Change KW Ad Group #1 Ad Group #2 Ad Group #3 Add negative KW Ad Group #1 Ad Group #2 Ad Group #3 Add bid adjustments Ad Group #1 Ad Group #2 Ad Group #3 Building Improvement Plan
- 75. Analytics & Benchmarking Technical & „Political“ Visits & Costs EASE IMPORTANCE POTENTIAL Ad Group #1 Ad Group #2 Ad Group #3 PIE Framework
- 76. Improve RPV Change CPC bids Ad Group #1 Ad Group #2 Ad Group #3 Change AvgPos Ad Group #1 Ad Group #2 Ad Group #3 Change LP Ad Group #1 Ad Group #2 Ad Group #3 Split Ad Groups Ad Group #1 Ad Group #2 Ad Group #3 Change targeting Ad Group #1 Ad Group #2 Ad Group #3 Change copy Ad Group #1 Ad Group #2 Ad Group #3 Change KW Ad Group #1 Ad Group #2 Ad Group #3 Add negative KW Ad Group #1 Ad Group #2 Ad Group #3 Add bid adjustments Ad Group #1 Ad Group #2 Ad Group #3 Building Improvement Plan
- 77. BEING A CASH MACHINE
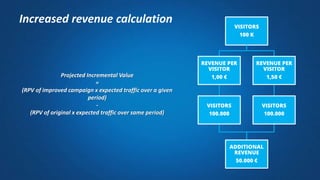
- 78. Projected Incremental Value = (RPV of improved campaign x expected traffic over a given period) - (RPV of original x expected traffic over same period) VISITORS 100 K REVENUE PER VISITOR 1,00 € REVENUE PER VISITOR 1,50 € VISITORS 100.000 VISITORS 100.000 ADDITIONAL REVENUE 50.000 € Increased revenue calculation
Editor's Notes
- So we did some advanced analysis and data mining. We took all this metrics and data (130 millions data points), calculated correlations, did some regresion and multiple regression analysis.
- Even in the prehistoric time of digital (in the 90s of the last millennium) bounce rate was considered to be one of the most important digital metrics. It turns out that this is not the case. If a bounce rate is within the normal range (below 30%), a few % changes have no impact on revenue. Struggling to reduce a bounce rate from 23% to 17% is therefore meaningless. This does not mean that we can afford a website with a bounce rate of 50% or more. R-squared is a statistical measure of how close the data are to the fitted regression line. It is also known as the coefficient of determination, or the coefficient of multiple determination for multiple regression. 0% indicates that the model explains none of the variability of the response data around its mean.
- Weather and temperature at the actual location of the user do not have a drastic impact on online behavior. It is wrong to think that the rain brings higher revenue, because we are all in the safe shelter of home on the computer - and vice versa. Local weather is supposed to affect the emotional state of users, but it not true on the web. This does not mean that the same applies to seasonal or large scale weather changes like heat waves.
- Moon rises oceans, moves rocks, shapes space-time and therefore we could conclude that it has impact on users' behavior online as well. But our analysis showed that people are harder to bend than our cosmos and the moon has no effect on our purchasing behavior. Even if it's a blue moon.
- Yes, I know. This one is quite obvious. The average visitor value (calculated by dividing the total revenue divided by the number of visitors) has one of the biggest impacts on revenue (R2 = 0.831). Why do I even mention it? First, because this metric is often overlooked and, secondly, because it gives us an excellent basis for the calculation of the profitability of individual digital channels. If the cost of acquisition on each user channel is greater than the value of the user obtained through this channel, then something is wrong.
- I'm not sure whether this is the result of capitalism or something else, but the belief that, if I drive more traffic to the website all our financial problems will be solved, does not apply at all. Number of visitors, while it is important, has a weak correlation with revenue (R2 = 0.225).
- It seems that the fact how much an average user spends online, is quite important - and indeed it is. Even more interesting is that the average number of products in the shopping cart has no significant correlation with revenue. Hint: rather to focus on how to presuade users to add another product to a cart, we should focus on how to enable better user experience to finish the purchase as quickly as possible.
- Conversion rate has a strong correlation with revenue per session. I believe that this is something that everyone has long known, and that is why I wonder why the progress in this field so minimal. Testing customer shopping experience is still science fiction.
- I get my salary on the 15th of the month, then I immediately go shopping and, consequently, the number of transactions rises. Probably true. But pay day could be on 1, 8, 15, pensions can be on 31 etc. Fact: day of the month does not have any connection with revenues on the website.
- Even in this case you would need good margin 10.000 visitors with 1 % CR results in 100 transactions. If APV is 30 € your profit is 3.000 €. Hardly enough to survive
- Find the bottlenecks and improvement areas in your conversion funnel Learn: - Which steps drive users to leave your website - Which steps have users leave for other pages - Where users enter your funnel from
- Funnels are non-linear, users move backwards and forwards. See when users move back through your funnel and try to find out why. Learn: - Which steps do users skip? - Which steps do users redo? - What are the top funnel paths?
- Understand where customers are coming from and which acquisition channels to optimize for Learn: - The user split between acquisition channels - How performance differs between channels
- Quickly see which campaigns are performing well
- See which campaigns bring most of users Learn: What‘s the New Sessions ratio What‘s the bounce rate What‘s the reach of the specific campaign Which campaigns are costing us most of our money Can you optimize the costs What‘s the CPC of this specific campaign What‘s the AvgPos
- See where your users land/leave. Learn: - How your overall landing/exit pages perform over time - How individual pages perform by time on site, exit rate, and more
- See the devices users use and how adoption changes over time Learn: - The split between device types, specific smartphone types or operating systems, screen sizes Learn which segments you are performing well for How well are your campaigns performing on different devices Are you reaching users on mobile as well How are they behaving and converting compared to desktop users
- See how your users behave in relation to key shopping goals. Segment results to see which user groups are underperforming. Learn: - How many users you lose per step - How individual user groups perform - Which functionalities you need to improve urgently
- See where your users land/leave. Learn: - How your overall landing/exit pages perform over time - How individual pages perform by time on site, exit rate, and more
- Understand your users most common navigation paths Learn: - How users move through your website - Where users land - Which pages have high exit rates
- See where users click on your pages, as well as what their scroll-depth is Learn: - Which elements get the best CTR (note: when multiple buttons share the same URL they share CTR’s here) - What the scroll-depth of your users is - What content underperforms for the amount of screen real estate it has
- See how often site search is used and how much value it adds to your business Learn: - The percentage of users who do or do not use site search, segment by user types Understand how important site search is to conversion rates and business revenue Add search keywords to your Google Search campaigns
- See which campaigns are more effective in awareness phase and which in purchase phase Learn: - Are we targeting the right part of CDJ - Are we using the right targeting - How effective are my GDN campaigns
- See which campaigns have the highest AOV. Filter out campaigns with few transactions. Learn: Which type of campaign has the highest AOV Calculate profitability based on CR, AOV and CPC
- Value Proposition – kakšen Value Proposition aktivira uporabnika Relevance – naredi stran bolj relevantno za uporabnika (glede na STD oz. source in customer need) Clarity – eyeflow & grafični izgled/preglednost Anxiety – znižuje CR (gradnja zaupanja) Distraction – preveč opcij, upsales, cross sales Urgency – zakaj rabim za izdelek sedaj takoj http://www.widerfunnel.com/conversion-rate-optimization/the-six-landing-page-conversion-rate-factors


