


Shell Q2 2008 Qra
- 1. Royal Dutch Shell plc 2ND QUARTER 2008 UNAUDITED RESULTS • Royal Dutch Shell’s second quarter 2008 earnings, on a current cost of supplies (CCS) basis, were $7.9 billion compared to $7.6 billion a year ago. Basic CCS earnings per share increased by 7% versus the same quarter a year ago. • A second quarter 2008 dividend has been announced of $0.40 per share, an increase of 11% over the US dollar dividend for the same period in 2007. • Cash flow from operating activities for the second quarter 2008, excluding net working capital movements, was $15.9 billion. Net capital investment for the quarter was $5.7 billion. Total distribution to shareholders, in the form of dividends and share repurchases, was $3.8 billion and gearing was 14.5% at the end of the second quarter. • On July 17, 2008, Royal Dutch Shell, through its wholly owned subsidiary Shell Canada Limited, launched an offer to acquire all of the outstanding shares of Duvernay Oil Corp. at a total price of C$5.9 billion, including debt. The offer is subject to certain conditions and regulatory approvals. Royal Dutch Shell Chief Executive Jeroen van der Veer commented: quot;This is another set of competitive earnings for Shell shareholders. Good operating performance, combined with increased oil and gas prices, offset the impact of weaker downstream conditions in the second quarter 2008. Shell is making substantial, targeted investments to grow the company for shareholders and help ensure that energy markets remain well supplied. Spending is increasing on new acreage and selective acquisitions as we refresh the portfolio with new options for future growth. Our strategy is on track.quot; SUMMARY UNAUDITED RESULTS $ million Quarters Six Months %1 2007 2008 Q2 2008 Q1 2008 Q2 2007 % 9,083 8,667 +33 15,948 +29 11,556 Income attributable to shareholders 20,639 Less: Estimated CCS adjustment for Oil Products and 1,307 1,111 Chemicals (see note 2) 1,460 3,654 4,961 CCS earnings 7,776 7,556 14,488 7,902 +5 15,678 +8 1.47 1.38 +36 2.54 +31 1.87 3.34 Basic earnings per share ($) 0.21 0.18 0.23 0.59 0.80 Less: Estimated CCS adjustment per share ($) Basic CCS earnings per share ($) +7 2.31 +10 1.26 1.20 1.28 2.54 0.40 0.36 +11 0.40 Dividend per ordinary share ($) 0.72 +11 0.80 1 Q2 on Q2 change The information in these quarterly results reflects the consolidated financial position and results of Royal Dutch Shell plc (“Royal Dutch Shell”). All amounts shown throughout this report are unaudited. Registered Office: England, Company No. 4366849, Shell Centre, London, SE1 7NA, UK
- 2. Royal Dutch Shell plc 2 KEY FEATURES OF THE SECOND QUARTER 2008 • Second quarter 2008 CCS earnings were $7,902 million or 5% higher than in the same quarter a year ago. • Second quarter 2008 reported income was $11,556 million or 33% higher than in the same quarter a year ago. • As a result of strong increases in oil and related product prices during the second quarter 2008, Oil Products earnings were reduced by some $450 million of non-cash charges related to fair value accounting of commodity derivatives. In addition, strong increases in natural gas and power prices resulted in Gas & Power earnings being reduced by non-cash charges of some $300 million related to fair value accounting of commodity derivatives associated with long-term contracts. (see Note 8) • Basic CCS earnings per share increased by 7% versus the same quarter a year ago. • Total cash returned to shareholders in the form of dividends and share repurchases in the second quarter 2008 was $3.8 billion. • Cash flow from operating activities, excluding net working capital movements, was $15.9 billion compared to $10.6 billion for the same quarter last year. Including net working capital movements, cash flow from operating activities was $4.2 billion compared to $8.8 billion in the second quarter 2007. • Capital investment for the second quarter 2008 was $8.0 billion, with net capital investment (capital investment, less divestment proceeds) of $5.7 billion. As the portfolio focus continues, asset sales proceeds in 2008 are expected to increase from around $4 billion to some $5 billion. Acquisitions in 2008 are estimated at around $10 billion, including new growth positions such as new exploration and Australia coal bed methane assets and the offer to acquire Duvernay Oil Corp. Net capital investment for the full year 2008 is expected to be in the range of $35-36 billion, including these acquisitions. • Return on average capital employed (ROACE), on a reported income basis (see note 3), was 25.8%. • Gearing (see Note 5) was 14.5% at the end of the second quarter 2008 versus 12.0% at the end of the second quarter 2007. • Oil and gas production, including oil sands bitumen production, for the second quarter 2008 was 3,126 thousand barrels of oil equivalent per day (boe/d), compared to 3,178 thousand boe/d in the same quarter last year. Excluding the impact of divestments and production sharing contracts (PSC) pricing effects, second quarter 2008 production was in line with the same quarter last year. • Liquefied Natural Gas (LNG) sales volumes of 3.08 million tonnes were 5% lower than in the same quarter a year ago. • Oil Products refinery availability was 92%, at the same level as in the second quarter 2007. Chemicals manufacturing plant availability increased to 95% from 93% in the second quarter 2007. Oil Sands upgrader availability was 96%, unchanged compared to the same quarter last year. • Oil Products sales volumes in the second quarter 2008 increased by 2% compared to the same quarter last year. Chemical product sales volumes decreased by 5% compared to the second quarter 2007. SUMMARY UNAUDITED RESULTS $ million Quarters Six Months %1 2007 2008 Q2 2008 Q1 2008 Q2 2007 % Exploration & Production2 5,143 3,099 6,492 5,881 11,024 948 Gas & Power 779 1,582 625 1,573 Oil Sands2 249 202 317 351 600 1,194 Oil Products (CCS basis) 2,936 4,424 1,075 2,269 201 Chemicals (CCS basis) 494 974 (142) 59 146 Corporate 177 978 201 347 (105) Minority interest (131) (279) (89) (194) CCS earnings 7,776 7,556 14,488 +8 7,902 +5 15,678 1 Q2 on Q2 change 2 As from the fourth quarter 2007, the earnings of the Oil Sands operations, which were previously reported as part of the Exploration & Production segment, are disclosed as a separate business segment. For comparison purposes, the Exploration & Production earnings up to the third quarter 2007 have been reclassified by the amounts reported under the Oil Sands segment.
- 3. Royal Dutch Shell plc 3 SUMMARY OF IDENTIFIED ITEMS Earnings in the second quarter 2008 reflected the following items, which in aggregate amounted to a net gain of $73 million (compared to a net gain of $660 million in the second quarter 2007), as summarised in the table below: • Exploration & Production earnings included a net gain of $98 million, reflecting a gain from divestments of $487 million, which was partly offset by a charge of $312 million related to the mark- to-market valuation of certain UK gas contracts and net tax charges of $77 million. Earnings for the second quarter 2007 included a net gain of $153 million reflecting a gain from divestment of $226 million and a gain of $19 million related to the mark-to-market valuation of certain UK gas contracts, which were partly offset by tax charges of $92 million. • Gas & Power earnings for the second quarter 2007 included a gain from divestments of $247 million. • Oil Products earnings included a gain of $181 million, reflecting a divestment gain of $167 million and a tax credit of $14 million. Earnings for the second quarter 2007 included a divestment gain of $205 million. • Chemicals earnings included a net charge of $206 million, reflecting asset impairments and provisions of $265 million, which were partly offset by a divestment gain of $59 million. • Corporate earnings for the second quarter 2007 included a gain of $55 million related to the sale of property in the United Kingdom. SUMMARY OF IDENTIFIED ITEMS $ million Quarters Six Months 2007 2008 Q1 2008 Q2 2007 Q2 2008 Segment earnings impact of identified items: (66) 153 257 98 32 Exploration & Production (11) 247 286 - (11) Gas & Power - - - - - Oil Sands - 205 29 181 181 Oil Products (CCS basis) - - - (206) (206) Chemicals (CCS basis) - 55 459 - - Corporate - - - - - Minority interest (77) 660 1,031 73 CCS earnings impact (4) These identified items generally relate to events with an impact of greater than $50 million on Royal Dutch Shell’s earnings and are shown to provide additional insight into its segment earnings, CCS earnings and income attributable to shareholders. Further additional comments on the business segments are provided in the section ‘Earnings by business segment’ on page 4 and onwards. Commodity price effects During the second quarter 2008 worldwide oil and gas related commodity marker prices significantly increased. As a consequence, net working capital increased by $11.8 billion during the second quarter 2008, mainly due to the higher cost-valued inventory in Oil Products and increased net accounts receivable. Second quarter 2008 Gas and Power marketing and trading earnings were reduced by non-cash charges of around $300 million as a result of fair value accounting of commodity derivatives associated with long-term contracts, as required under the International Financial Reporting Standards (IFRS). Second quarter 2008 Oil Products marketing and trading earnings were reduced by non-cash charges of around $450 million as a result of fair value accounting of commodity derivatives. As required under IFRS, physical crude oil and oil products inventories were recorded at cost although their market value was higher. Commodity derivatives were recorded at market prices (see Note 8).
- 4. Royal Dutch Shell plc 4 EARNINGS BY BUSINESS SEGMENT EXPLORATION & PRODUCTION $ million Quarters Six Months %1 2007 2008 Q2 2008 Q1 2008 Q2 2007 % Segment earnings2 5,143 3,099 +90 6,492 +70 5,881 11,024 Crude oil production (thousand b/d) 3 1,756 1,817 -6 1,841 1,711 1,733 -6 8,170 8,772 +7 9,755 7,367 +6 Natural gas production available for sale (million scf/d) 7,789 Barrels of oil equivalent (thousand boe/d) 3 3,438 3,087 -1 3,250 3,054 3,246 - 1 Q2 on Q2 change 2 As from the fourth quarter 2007, the earnings of the Oil Sands operations, which were previously reported as part of the Exploration & Production segment, are disclosed as a separate business segment. For comparison purposes, the Exploration & Production earnings up to the third quarter 2007 have been reclassified by the amounts reported under the Oil Sands segment. 3 Excludes oil sands bitumen production Second quarter Exploration & Production segment earnings were $5,881 million compared to $3,099 million a year ago. Earnings included a net gain of $98 million related to identified items, compared to a net gain of $153 million in the second quarter 2007 (see page 3 for details). Earnings compared to the second quarter 2007 reflected higher gas production volumes and the benefit of higher oil and gas prices on revenues, which were partly offset by lower oil production volumes, higher royalty expenses and higher operating costs. Global liquids realisations were 74% higher than in the second quarter 2007, compared with marker crudes Brent and WTI increases of 76% and 91% respectively. Global gas realisations were 54% higher than a year ago. Outside the USA gas realisations increased by 57% whereas in the USA gas realisations increased by 53%. Second quarter 2008 production (excluding oil sands bitumen production) was 3,054 thousand barrels of oil equivalent per day (boe/d) compared to 3,087 thousand boe/d a year ago. Crude oil production was down 6% and natural gas production was up 6% compared to the second quarter 2007. Production compared to the second quarter 2007 included additional volumes principally from Ormen Lange (Shell share 17%) in Norway, West Salym (Shell share 50%) in Russia, Stybarrow (Shell share 17.1%) in Australia, Changbei (Shell share 50%) in China, Deimos (Shell share 71.5%) in the USA, Starling (Shell share 28%), Caravel (Shell share 71%) and Shamrock (Shell share 100%) in the United Kingdom and Champion West Phase 3B/C (Shell share 50%) in Brunei. Second quarter portfolio developments In Australia, Shell signed a preliminary agreement with Arrow Energy Ltd. to acquire a 30% stake in Arrow's coal bed methane acreage in Queensland, and a 10% stake in Arrow International, for a cost of up to $0.7bn . Shell and Arrow plan to jointly develop projects to extract clean-burning natural gas from coal deposits. Completion of a definitive agreement is expected by the end of 2008. In Peru, Shell signed a preliminary agreement with BPZ Energy Inc. to jointly explore for oil and gas in the northern part of the country. During the first half of 2008, Shell had four notable exploration discoveries in offshore Nigeria, Australia and Brunei and onshore USA. Shell also significantly increased its overall acreage position through acquisitions of new exploration licences offshore northwest Australia, in the Chukchi Sea and the Gulf of Mexico in the USA.
- 5. Royal Dutch Shell plc 5 GAS & POWER $ million Quarters Six Months Q2 2008 Q1 2008 Q2 2007 %1 2007 2008 % 948 779 -20 Segment earnings 1,582 625 1,573 -1 -5 LNG sales volumes (million tonnes) 3.51 3.25 6.55 3.08 6.59 +1 1 Q2 on Q2 change Second quarter Gas & Power segment earnings were $625 million compared to $779 million a year ago. Earnings for the second quarter 2007 included a gain of $247 million related to an identified item (see page 3 for details). In addition, second quarter 2008 marketing and trading earnings were reduced by non-cash charges of around $300 million as a result of fair value accounting of commodity derivatives associated with long-term contracts (see Note 8). Gas & Power earnings compared to the second quarter 2007 reflected strong LNG prices, which were partly offset by lower LNG sales volumes and lower marketing and trading contributions. LNG related earnings for the second quarter 2008 were approximately 50% higher than in the same quarter a year ago, mainly reflecting strong LNG prices. LNG sales volumes of 3.08 million tonnes were 5% lower than in the same quarter a year ago, mainly as a consequence of lower feedgas supplies, planned maintenance shutdowns and changed lifting schedules of cargoes compared to the same quarter last year. Marketing and trading earnings, non-LNG related, were lower than in the same quarter a year ago, reflecting lower earnings in North America, which was partly offset by higher European contributions. Second quarter portfolio developments In the Middle East, an agreement was reached with Qatargas 4 and the Dubai Government for the supply of LNG during the summer months for 15 years. The LNG will be delivered from Qatargas 4 and Shell’s portfolio of other LNG volumes. In Germany, the sale of the BEB Erdgas und Erdoel GmbH gas transport business (Shell share 50%) to NV Nederlandse Gasunie was closed on July 1, 2008, with all required approvals in place. Proceeds have been mainly received in July 2008, with a remaining payment expected by the end of the year.
- 6. Royal Dutch Shell plc 6 OIL SANDS $ million Quarters Six Months %1 2007 2008 Q2 2008 Q1 2008 Q2 2007 % 249 202 +74 351 317 +89 Segment earnings 600 84 91 -21 Bitumen production (thousand b/d) 93 72 78 -16 144 141 -26 Sales volumes (thousand b/d) 141 104 124 -12 94 96 Upgrader availability (%) 95 96 94 1 Q2 on Q2 change Second quarter Oil Sands segment earnings were $351 million compared to $202 million in the same quarter last year. Earnings compared to the second quarter 2007 reflected the impact of higher oil prices on revenues, which were partly offset by lower production volumes and higher operating costs. Bitumen production decreased by 21% compared to the same quarter last year mainly as a consequence of the execution of the mine tailings management plan which has temporarily led to lower ore grade being mined and due to planned and unplanned maintenance. Upgrader availability was 96%, unchanged compared to the same quarter last year. OIL PRODUCTS $ million Quarters Six Months %1 2007 2008 Q2 2008 Q1 2008 Q2 2007 % 2,367 3,928 5,730 4,539 6,906 Segment earnings Less: Estimated CCS adjustment (see note 2) 1,173 992 1,306 3,464 4,637 1,194 2,936 -63 Segment CCS earnings 4,424 1,075 2,269 -49 3,694 3,806 -9 Refinery intake (thousand b/d) 3,707 3,464 3,579 -3 6,831 6,490 +2 Total Oil Products sales (thousand b/d) 6,449 6,642 6,737 +4 92 92 Refinery availability (%) 89 92 92 1 Q2 on Q2 change Second quarter Oil Products segment earnings were $4,539 million compared to $3,928 million for the same period last year. Second quarter Oil Products CCS segment earnings were $1,075 million compared to $2,936 million in the second quarter 2007. Earnings included a gain of $181 million related to identified items, compared to a gain of $205 million in the second quarter 2007 (see page 3 for details). In addition second quarter 2008 marketing and trading earnings were reduced by a non-cash charge of around $450 million as a result of fair value accounting of commodity derivatives (See Note 8). CCS earnings compared to the second quarter 2007 reflected substantially lower realised refining margins, higher operating costs, mainly as a result of exchange rate movements, and lower trading contributions.
- 7. Royal Dutch Shell plc 7 Industry refining margins compared to the same quarter a year ago were lower in Europe, declined significantly in the US Gulf Coast and US West Coast and were higher in the Asia-Pacific region. Refinery availability remained at 92%, the same level as in the second quarter of 2007. Marketing earnings compared to the same period a year ago declined due to higher operating costs and lower lubricants margins. In addition, retail margins, net of exchange rate movements, declined, which were partly offset by higher B2B margins. Oil Products (marketing and trading) sales volumes increased by 2% compared to the same quarter last year. Marketing sales volumes were 1% lower than in the second quarter 2007 and excluding the impact of divestments were 2% higher mainly because of increased aviation, marine and commercial fuels sales. Second quarter portfolio developments In Qatar, a Letter of Intent was signed with Qatar Petroleum International and PetroChina to build an integrated refinery and petrochemical manufacturing complex in China. CHEMICALS $ million Quarters Six Months %1 2007 2008 Q2 2008 Q1 2008 Q2 2007 % 348 626 1,153 157 505 Segment earnings Less: Estimated CCS adjustment (see note 2) 179 147 132 299 446 201 494 Segment CCS earnings 974 -94 (142) - 59 5,459 5,653 Sales volumes (thousand tonnes) 11,220 5,396 -5 10,855 -3 95 93 Manufacturing plant availability (%) 92 95 95 1 Q2 on Q2 change Second quarter Chemicals segment earnings were $157 million compared to $626 million for the same period last year. Second quarter Chemicals CCS segment earnings were a loss of $142 million compared to a profit of $494 million in the same quarter last year. Earnings for the second quarter 2008 included a net charge of $206 million related to identified items (see page 3 for details). CCS earnings compared to the second quarter 2007 reflected lower realised margins, higher operating costs and lower income from equity-accounted investments. In addition, identified items reflecting provisions and asset impairments, which were partly offset by a divestment gain, impacted earnings. Chemicals manufacturing plant availability increased to 95%, some 2% higher than in the second quarter 2007.
- 8. Royal Dutch Shell plc 8 CORPORATE $ million Quarters Six Months 2007 2008 Q1 2008 Q2 2007 Q2 2008 146 177 Segment earnings 978 201 347 Second quarter Corporate segment earnings were $201 million compared to $177 million for the same period last year. Earnings for the second quarter 2007 included a gain of $55 million related to an identified item (see page 3 for details). Earnings compared to the second quarter 2007 reflected higher tax credits and lower shareholder costs, which were partly offset by lower net underwriting income and lower net interest income.
- 9. Royal Dutch Shell plc 9 PRICE AND MARGIN INFORMATION OIL & GAS Quarters Six Months 2007 2008 Q1 2008 Q2 2007 Q2 2008 Realised oil prices – Exploration & Production1 $/bbl $/bbl (period average) 64.88 World outside USA 90.40 59.94 110.96 101.15 61.06 USA 92.55 56.34 118.07 105.02 64.27 Global 90.72 59.36 111.92 101.70 $/bbl $/bbl Realised oil prices – Oil Sands (period average) 59.94 Canada 85.08 55.49 116.20 98.12 $/thousand scf $/thousand scf Realised gas prices (period average) 9.00 5.95 Europe 6.93 9.19 9.38 5.85 4.01 World outside USA (including Europe) 4.36 6.09 6.31 9.52 7.78 USA 7.48 10.69 11.89 6.52 4.74 Global 4.98 6.91 7.30 Oil and gas marker industry prices (period average) Brent ($/bbl) 96.66 68.86 63.31 121.26 108.96 123.81 110.83 WTI ($/bbl) 97.86 64.89 61.47 125.18 111.58 66.21 Edmonton Par ($/bbl) 97.91 61.96 11.36 9.95 Henry Hub ($/MMBtu) 8.55 7.56 7.36 60.41 56.73 UK National Balancing Point (pence/therm) 53.05 20.20 21.25 Japanese Crude Cocktail – JCC ($/bbl)2 100.96 95.09 64.76 61.16 93.13 REFINING & CRACKER INDUSTRY MARGINS3 Quarters Six Months 2007 2008 Q1 2008 Q2 2007 Q2 2008 Refining marker industry gross margins $/bbl $/bbl (period average) ANS US West Coast coking margin 8.75 23.10 22.65 11.55 10.10 10.55 9.60 WTS US Gulf Coast coking margin 8.70 27.05 19.95 5.85 4.70 Rotterdam Brent complex 3.55 6.30 5.00 3.95 2.85 Singapore 80/20 Arab light/Tapis complex 1.80 3.60 3.35 $/tonne $/tonne Cracker industry margins (period average) US ethane 359.00 320.00 326.00 484.00 422.00 423.00 474.00 346.00 390.00 Western Europe naphtha 433.00 138.00 328.00 92.00 74.00 North East Asia naphtha 55.00 1 As from the fourth quarter 2007, the Oil Sands operations, which were previously reported as part of the Exploration & Production segment, are disclosed as a separate business segment. For comparison purposes, the Exploration & Production realised oil prices up to the third quarter 2007 have been reclassified. 2 JCC prices for the second quarter and six months 2008 are based on available market data up to the end of April 2008. Prices for these periods will be updated when full market data are available. 3 The refining and cracker industry margins shown above do not represent actual Shell realised margins for the periods. These are estimated industry margins based on available market information at the end of the quarter.
- 10. Royal Dutch Shell plc 10 OIL & GAS – OPERATIONAL DATA Quarters Six Months %1 Q2 2008 Q1 2008 Q2 2007 2007 2008 % thousand b/d thousand b/d Crude oil production 416 442 Europe 445 390 402 322 305 Africa 322 314 318 208 235 Asia Pacific 233 196 202 428 428 Middle East, Russia, CIS 425 434 431 301 328 USA 335 293 297 81 79 Other Western Hemisphere 81 84 83 1,756 1,817 Total crude oil production excluding oil sands 1,841 1,711 -6 1,733 -6 84 91 Bitumen production – oil sands 93 72 78 1,840 1,908 Total crude oil production including oil sands 1,934 1,783 -7 1,811 -6 million scf/d2 million scf/d2 Natural gas production available for sale 4,894 2,496 Europe 3,299 2,930 3,912 619 601 Africa 560 549 584 2,438 2,414 Asia Pacific 2,435 2,512 2,475 232 251 Middle East, Russia, CIS 255 230 231 1,105 1,091 USA 1,126 1,096 1,101 467 514 Other Western Hemisphere 495 472 469 9,755 7,367 +6 8,170 7,789 8,772 +7 thousand boe/d3 thousand boe/d3 Total production in barrels of oil equivalent 1,260 872 Europe 1,014 895 1,077 429 409 Africa 419 409 419 628 651 Asia Pacific 653 629 628 468 471 Middle East, Russia, CIS 469 474 471 492 516 USA 529 482 487 161 168 Other Western Hemisphere 166 165 164 3,438 3,087 Total production excluding oil sands 3,250 3,054 -1 3,246 - 84 91 Bitumen production – oil sands 93 72 78 3,522 3,178 Total production including oil sands 3,343 3,126 -2 3,324 -1 1 Q2 on Q2 change 2 scf/d = standard cubic feet per day; 1 standard cubic foot = 0.0283 cubic metre 3 Natural gas converted to oil equivalent at 5.8 million scf/d = thousand boe/d
- 11. Royal Dutch Shell plc 11 OIL PRODUCTS AND CHEMICALS – OPERATIONAL DATA Six Months Quarters 2007 2008 1 Q2 2008 Q1 2008 Q2 2007 % % thousand b/d thousand b/d Refinery processing intake 1,741 1,713 Europe 1,651 1,498 1,619 756 810 Other Eastern Hemisphere 785 741 749 845 905 USA 899 874 859 352 378 Other Western Hemisphere 372 351 352 3,694 3,806 -9 3,707 3,464 3,579 -3 Oil sales 2,083 2,224 Gasolines 2,244 2,067 2,076 814 731 Kerosenes 726 816 815 2,337 2,238 Gas/diesel oils 2,176 2,225 2,281 839 667 Fuel oil 673 776 807 758 630 Other products 630 758 758 6,831 6,490 +2 6,449 6,642 Total oil products * 6,737 +4 *Comprising: 1,959 1,826 Europe 1,830 1,781 1,870 1,245 1,238 Other Eastern Hemisphere 1,241 1,276 1,260 1,396 1,518 USA 1,460 1,436 1,416 755 679 Other Western Hemisphere 666 704 730 1,476 1,229 Export sales 1,252 1,445 1,461 Chemical sales volumes by main product category 2** thousand tonnes thousand tonnes 3,119 3,222 Base chemicals 6,502 3,061 6,180 2,338 2,429 First line derivatives 4,711 2,333 4,671 2 2 Other 7 2 4 5,459 5,653 -5 11,220 5,396 10,855 -3 **Comprising: 2,289 2,220 Europe 4,493 2,189 4,478 1,228 1,380 Other Eastern Hemisphere 2,633 1,294 2,522 1,784 1,873 USA 3,744 1,760 3,544 158 180 Other Western Hemisphere 350 153 311 1 Q2 on Q2 change 2 Excluding volumes sold by equity-accounted investments, chemical feedstock trading and by-products.
- 12. Royal Dutch Shell plc 12 NOTE All amounts shown throughout this Report are unaudited. In this announcement, excluding in the financial statements, we have aggregated our equity position in projects for both direct and indirect interest (for example, we have aggregated our indirect interest in North West Shelf LNG via our 34% shareholding in Woodside Energy Ltd). Third quarter results are expected to be announced on October 30, 2008 and fourth quarter results are expected to be announced on January 29, 2009. There will be a Shell strategy update on March 17, 2009. In this document “Shell”, “Shell group” and “Royal Dutch Shell” are sometimes used for convenience where references are made to Royal Dutch Shell and its subsidiaries in general. Likewise, the words “we”, “us” and “our” are also used to refer to subsidiaries in general or to those who work for them. These expressions are also used where no useful purpose is served by identifying the particular company or companies. ‘‘Subsidiaries’’, “Shell subsidiaries” and “Shell companies” as used in this document refer to companies in which Royal Dutch Shell either directly or indirectly has control, by having either a majority of the voting rights or the right to exercise a controlling influence. The companies in which Shell has significant influence but not control are referred to as “associated companies” or “associates” and companies in which Shell has joint control are referred to as “jointly controlled entities”. In this document, associates and jointly controlled entities are also referred to as “equity- accounted investments”. This document contains forward-looking statements concerning the financial condition, results of operations and businesses of Royal Dutch Shell. All statements other than statements of historical fact are, or may be deemed to be, forward-looking statements. Forward-looking statements are statements of future expectations that are based on management’s current expectations and assumptions and involve known and unknown risks and uncertainties that could cause actual results, performance or events to differ materially from those expressed or implied in these statements. Forward-looking statements include, among other things, statements concerning the potential exposure of Royal Dutch Shell to market risks and statements expressing management’s expectations, beliefs, estimates, forecasts, projections and assumptions. These forward-looking statements are identified by their use of terms and phrases such as “anticipate”, “believe”, “could”, “estimate”, “expect”, “intend”, “may”, “plan”, “objectives”, “outlook”, “probably”, “project”, “will”, “seek”, “target”, “risks”, “goals”, “should” and similar terms and phrases. There are a number of factors that could affect the future operations of Royal Dutch Shell and could cause those results to differ materially from those expressed in the forward-looking statements included in this document, including (without limitation): (a) price fluctuations in crude oil and natural gas; (b) changes in demand for Shell’s products; (c) currency fluctuations; (d) drilling and production results; (e) reserve estimates; (f) loss of market and industry competition; (g) environmental and physical risks; (h) risks associated with the identification of suitable potential acquisition properties and targets, and successful negotiation and completion of such transactions; (i) the risk of doing business in developing countries and countries subject to international sanctions; (j) legislative, fiscal and regulatory developments including potential litigation and regulatory effects arising from recategorisation of reserves; (k) economic and financial market conditions in various countries and regions; (l) political risks, including the risks of expropriation and renegotiation of the terms of contracts with governmental entities, delays or advancements in the approval of projects and delays in the reimbursement for shared costs; and (m) changes in trading conditions. All forward-looking statements contained in this document are expressly qualified in their entirety by the cautionary statements contained or referred to in this section. Readers should not place undue reliance on forward-looking statements. Each forward-looking statement speaks only as of the date of this document, July 31, 2008. Neither Royal Dutch Shell nor any of its subsidiaries undertake any obligation to publicly update or revise any forward-looking statement as a result of new information, future events or other information. In light of these risks, results could differ materially from those stated, implied or inferred from the forward-looking statements contained in this document. Please refer to the Annual Report and Form 20-F for the year ended December 31, 2007 for a description of certain important factors, risks and uncertainties that may affect Shell's businesses. Cautionary Note to US Investors: The United States Securities and Exchange Commission (SEC) permits oil and gas companies, in their filings with the SEC, to disclose only proved reserves that a company has demonstrated by actual production or conclusive formation tests to be economically and legally producible under existing economic and operating conditions. We may use certain terms in this announcement that the SEC's guidelines strictly prohibit us from including in filings with the SEC. US Investors are urged to consider closely the disclosure in our Form 20-F, File No 001-32575 and disclosure in our Forms 6-K, File No 001-32575, available on the SEC’s website www.sec.gov. You can also obtain these forms from the SEC by calling 1-800-SEC-0330. July 31, 2008
- 13. -13- APPENDIX: ROYAL DUTCH SHELL FINANCIAL REPORT AND TABLES STATEMENT OF INCOME (SEE NOTE 1) $ million Quarters Six Months %1 Q2 2008 Q1 2008 Q2 2007 2007 2008 % Revenue2 131,419 114,302 84,896 245,721 158,376 96,780 68,715 Cost of sales 206,041 129,381 109,261 17,522 16,181 28,995 +37 22,158 +37 Gross profit 39,680 3,969 4,120 Selling, distribution and administrative expenses 7,898 4,444 8,413 325 450 Exploration 722 408 733 2,425 2,138 Share of profit of equity-accounted investments 3,946 2,671 5,096 (53) (477) Net finance costs and other (income)/expense (1,378) (140) (193) 15,706 14,226 25,699 +39 20,117 +41 Income before taxation 35,823 6,505 5,415 Taxation 9,447 8,363 14,868 9,201 8,811 16,252 +29 11,754 +33 Income for the period 20,955 118 144 Income attributable to minority interest 304 198 316 Income attributable to shareholders of Royal Dutch 9,083 8,667 15,948 +29 11,556 +33 20,639 Shell plc 1 Q2 on Q2 change 2 Revenue is stated after deducting sales taxes, excise duties and similar levies of $25,462 million in Q2 2008, $22,920 million in Q1 2008, $18,993 million in Q2 2007 and $17,305 million in Q1 2007. BASIC EARNINGS PER SHARE (SEE NOTES 1, 2 AND 7) Six Months Quarters Q1 2008 Q2 2007 2007 Q2 2008 2008 1.47 1.38 Earnings per share ($) 2.54 1.87 3.34 1.26 1.20 CCS earnings per share ($) 2.31 1.28 2.54 DILUTED EARNINGS PER SHARE (SEE NOTES 1, 2 AND 7) Six Months Quarters Q1 2008 Q2 2007 2007 Q2 2008 2008 1.46 1.38 Earnings per share ($) 2.53 1.87 3.33 1.25 1.20 CCS earnings per share ($) 2.30 1.28 2.53
- 14. -14- EARNINGS BY BUSINESS SEGMENT (SEE NOTES 2 AND 4) $ million Quarters Six Months %1 Q2 2008 Q1 2008 Q2 2007 2007 2008 % Exploration & Production2: 3,540 2,183 +81 - World outside USA 4,724 +59 3,952 7,492 1,603 916 +111 - USA 1,768 +100 1,929 3,532 5,143 3,099 +90 6,492 +70 5,881 11,024 Gas & Power: 933 494 +60 - World outside USA 1,176 788 1,721 +46 15 285 - - USA 406 (163) (148) - 948 779 1,582 625 -20 1,573 -1 +74 Oil Sands2: 249 202 317 351 600 +89 Oil Products (CCS basis): 978 1,827 -58 - World outside USA 2,985 765 1,743 -42 216 1,109 -72 - USA 1,439 310 526 -63 1,194 2,936 4,424 1,075 -63 2,269 -49 Chemicals (CCS basis): 304 454 -75 - World outside USA 923 112 416 -55 (103) 40 - USA 51 (254) (357) - 201 494 974 (142) - 59 -94 7,735 7,510 13,789 7,790 +4 Total operating segments 15,525 +13 Corporate: 110 158 - Interest and investment income/(expense) 741 81 191 (62) 20 - Currency exchange gains/(losses) 66 27 (35) 98 (1) - Other - including taxation 171 93 191 146 177 978 201 347 (105) (131) (279) (89) Minority interest (194) 7,776 7,556 14,488 7,902 +5 CCS earnings 15,678 +8 Estimated CCS adjustment for Oil Products and 1,307 1,111 1,460 3,654 4,961 Chemicals Income attributable to shareholders of Royal Dutch 9,083 8,667 15,948 11,556 +33 20,639 +29 Shell plc 1 Q2 on Q2 change 2 As from the fourth quarter 2007, the earnings of the Oil Sands operations, which were previously reported as part of the Exploration & Production segment, are disclosed as a separate business segment. For comparison purposes, the Exploration & Production earnings up to the third quarter 2007 have been reclassified by the amounts reported under the Oil Sands segment.
- 15. -15- SUMMARISED BALANCE SHEET (SEE NOTES 1 AND 6) $ million Mar 31, 2008 Jun 30, 2007 Jun 30, 2008 Assets Non-current assets: Intangible assets 5,282 5,126 5,336 Property, plant and equipment 105,806 90,584 109,191 Investments: - equity-accounted investments 31,198 27,185 32,514 - financial assets 3,333 2,954 2,975 Deferred tax 3,409 3,108 4,089 Pre-paid pension costs 5,878 4,772 6,215 Other 6,406 5,548 6,504 161,312 139,277 166,824 Current assets: Inventories 32,184 26,497 39,624 Accounts receivable 87,507 60,649 127,241 Cash and cash equivalents 14,417 15,117 8,990 134,108 102,263 175,855 295,420 241,540 Total assets 342,679 Liabilities Non-current liabilities: Debt 11,378 12,236 11,072 Deferred tax 13,473 13,159 13,994 Retirement benefit obligations 6,304 6,282 6,162 Other provisions 14,016 10,877 14,086 Other 4,189 3,784 4,857 49,360 46,338 50,171 Current liabilities: Debt 5,684 5,266 5,352 Accounts payable and accrued liabilities 89,531 61,978 126,246 Taxes payable 14,412 11,214 15,895 Retirement benefit obligations 455 324 419 Other provisions 2,815 2,076 2,687 112,897 80,858 150,599 162,257 127,196 Total liabilities 200,770 131,130 112,621 Equity attributable to shareholders of Royal Dutch Shell plc 139,809 Minority interest 2,033 1,723 2,100 133,163 114,344 Total equity 141,909 295,420 241,540 Total liabilities and equity 342,679
- 16. -16- SUMMARISED STATEMENT OF CASH FLOWS (SEE NOTE 1) Six Months $ million Quarters Q1 2008 Q2 2007 2007 Q2 2008 2008 Cash flow from operating activities: 9,201 8,811 Income for the period 16,252 11,754 20,955 Adjustment for: 6,405 5,460- Current taxation 9,727 8,701 15,106 178 130- Interest (income)/expense 328 269 447 3,146 3,238- Depreciation, depletion and amortisation 6,498 3,439 6,585 (281) (1,133)- (Profit)/loss on sale of assets (1,495) (757) (1,038) 2,784 (1,704)- Decrease/(increase) in net working capital (2,103) (11,751) (8,967) (2,425) (2,138)- Share of profit of equity-accounted investments (3,946) (2,671) (5,096) 1,752 1,519- Dividends received from equity-accounted 3,106 2,447 4,199 investments 322 214 - Deferred taxation and other provisions 62 (152) 170 94 (676) - Other (1,123) 10 104 21,176 13,721 Cash flow from operating activities (pre-tax) 27,306 11,289 32,465 (4,314) (4,873) Taxation paid (7,277) (7,121) (11,435) 16,862 8,848 Cash flow from operating activities 20,029 4,168 21,030 Cash flow from investing activities: (7,429) (5,652) Capital expenditure (11,013) (7,352) (14,781) (616) (319) Investments in equity-accounted investments (689) (521) (1,137) 445 6,270 Proceeds from sale of assets 6,650 2,026 2,471 61 279 Proceeds from sale of equity-accounted investments 394 272 333 10 585 Proceeds from sale of /(additions to) financial assets 1,140 275 285 285 295 Interest received 580 269 554 (7,244) 1,458 (2,938) (5,031) Cash flow from investing activities (12,275) Cash flow from financing activities: (863) (1,185) Net increase/(decrease) in debt with maturity period (844) 839 (24) within three months 185 1,634 Other debt: New borrowings 4,396 131 316 (664) (274) Repayments (1,887) (1,479) (2,143) (298) (290) Interest paid (641) (369) (667) (7) (3,585) Change in minority interest (6,695) 34 27 (1,073) (900) Net issue/(repurchase) of shares (1,386) (1,350) (2,423) Dividends paid to: (2,329) (2,300) - Shareholders of Royal Dutch Shell plc (4,400) (2,489) (4,818) (51) (77) - Minority interest (119) (115) (166) Treasury shares: 200 568 - Net sales/(purchases) and dividends received 552 242 442 (4,900) (6,409) Cash flow from financing activities (11,024) (4,556) (9,456) 43 36 Currency translation differences relating to cash and 48 (8) 35 cash equivalents 4,761 3,933 Increase/(decrease) in cash and cash equivalents 6,115 (5,427) (666) 9,656 11,184 Cash and cash equivalents at beginning of period 9,002 14,417 9,656 14,417 15,117 Cash and cash equivalents at end of period 15,117 8,990 8,990
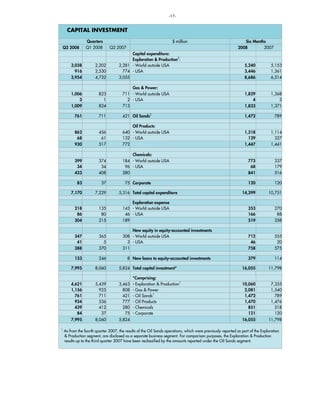
- 17. -17- CAPITAL INVESTMENT $ million Quarters Six Months Q1 2008 Q2 2007 2007 Q2 2008 2008 Capital expenditure: Exploration & Production1: 2,202 2,281 - World outside USA 5,153 3,038 5,240 2,530 774 - USA 1,361 916 3,446 4,732 3,055 6,514 3,954 8,686 Gas & Power: 823 711 - World outside USA 1,368 1,006 1,829 1 2 - USA 3 3 4 824 713 1,371 1,009 1,833 421 Oil Sands1 711 789 761 1,472 Oil Products: 456 640 - World outside USA 1,114 862 1,318 61 132 - USA 327 68 129 517 772 1,441 930 1,447 Chemicals: 374 184 - World outside USA 337 399 773 34 96 - USA 179 34 68 408 280 516 433 841 37 75 Corporate 120 83 120 7,229 5,316 Total capital expenditure 10,751 7,170 14,399 Exploration expense 135 143 - World outside USA 270 218 353 80 46 - USA 88 86 166 215 189 358 304 519 New equity in equity-accounted investments 365 308 - World outside USA 555 347 712 5 3 - USA 20 41 46 370 311 575 388 758 246 8 New loans to equity-accounted investments 114 133 379 8,060 5,824 Total capital investment* 11,798 7,995 16,055 *Comprising: - Exploration & Production1 5,439 3,463 7,355 4,621 10,060 925 808 - Gas & Power 1,540 1,156 2,081 - Oil Sands1 711 421 789 761 1,472 536 777 - Oil Products 1,476 934 1,470 412 280 - Chemicals 518 439 851 37 75 - Corporate 120 84 121 8,060 5,824 11,798 7,995 16,055 1 As from the fourth quarter 2007, the results of the Oil Sands operations, which were previously reported as part of the Exploration & Production segment, are disclosed as a separate business segment. For comparison purposes, the Exploration & Production results up to the third quarter 2007 have been reclassified by the amounts reported under the Oil Sands segment.