Six sigma
- 1. "THERE IS A BETTER WAY TO RUN YOUR ORGANIZATION."
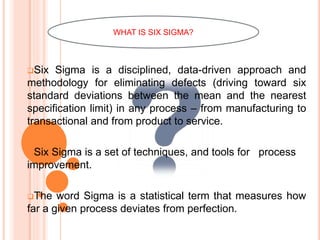
- 2. Six Sigma is a disciplined, data-driven approach and methodology for eliminating defects (driving toward six standard deviations between the mean and the nearest specification limit) in any process – from manufacturing to transactional and from product to service. Six Sigma is a set of techniques, and tools for process improvement. The word Sigma is a statistical term that measures how far a given process deviates from perfection. WHAT IS SIX SIGMA?
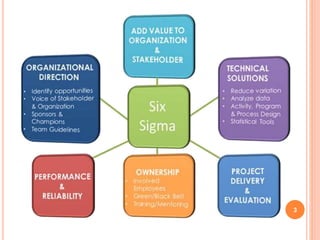
- 3. 3
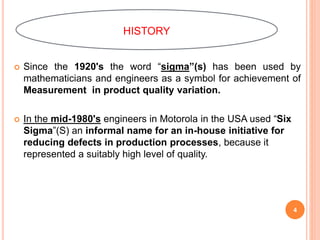
- 4. Since the 1920's the word “sigma”(s) has been used by mathematicians and engineers as a symbol for achievement of Measurement in product quality variation. In the mid-1980's engineers in Motorola in the USA used “Six Sigma”(S) an informal name for an in-house initiative for reducing defects in production processes, because it represented a suitably high level of quality. HISTORY 4
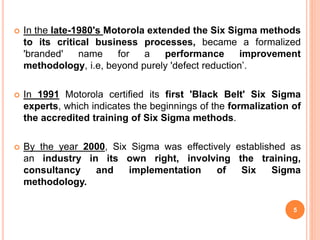
- 5. In the late-1980's Motorola extended the Six Sigma methods to its critical business processes, became a formalized 'branded' name for a performance improvement methodology, i.e, beyond purely 'defect reduction’. In 1991 Motorola certified its first 'Black Belt' Six Sigma experts, which indicates the beginnings of the formalization of the accredited training of Six Sigma methods. By the year 2000, Six Sigma was effectively established as an industry in its own right, involving the training, consultancy and implementation of Six Sigma methodology. 5
- 6. A six sigma process is one in which 99.9999966% of the products manufactured are statistically expected to be free of defects (3.4 defects per million). Six Sigma's aim is to eliminate waste and inefficiency, thereby increasing customer satisfaction by delivering what the customer is expecting. Six Sigma is a data driven methodology, and requires accurate data collection for the processes being analyzed. Six Sigma is about putting results on Financial Statements. FEATURES OF SIX SIGMA 6
- 7. Six Sigma follows a structured methodology, and has defined roles for the participants. Six Sigma is a business-driven, multi-dimensional structured approach for: -Improving Processes - Lowering Defects - Reducing process variability - Reducing costs - Increasing customer satisfaction - Increased profits 7
- 8. FATHER OF SIX SIGMA Sir Bill Smith “ the Father of six sigma” 8
- 9. KEY CONCEPTS OF SIX SIGMA CRITICAL TO QUALITY: Attributes most important to the customer. PROCESS CAPABILITY: What your process can deliver. DEFECT: Failing to deliver what the customer wants. VARIATION: What the customer sees and feels. STABLE OPERATIONS: Ensuring consistent, predictable processes to improve what the customer sees and feels. DESIGN FOR SIX SIGMA: Designing to meet customer needs and process capability. 9
- 10. KEY ELEMENTS OF SIX SIGMA CUSTOMERS PROCESSES EMPLOYEES Customers define quality. They expect performance, reliability, competitive prices, on-time delivery, service, clear and correct transaction processing and more. By understanding the transaction lifecycle from the customer's needs and processes, we can discover what they are seeing and feeling. Company must provide opportunities and incentives for employees to focus their talents and ability to satisfy customers. 10
- 11. ORGANIZATION OF SIX SIGMA Leadership Sponsor Implementation Leader Coach Team Leader Team member Process Owner 11
- 12. EXTENDED DEFINITIONS OF ROLES IN SIX SIGMA(BELT COLORS) Black Belt Green BeltMaster Black Belt The individual designated as a Black Belt has completed a thorough internal training program and has the experience of working on several projects. The Master Black Belt is available to answer procedural questions and to resolve the technical issues that come up. A Green Belt is less experienced than a Black Belt but is cast in a key role within the team. 12
- 13. IS SIX SIGMA RIGHT FOR AN ORGANIZATION? Is the strategic course clear for the company? What other change efforts or activities might conflict with or support Six Sigma initiative? Is there a strong theme or vision for the future of the organization that is well understood and consistently communicated? How effective are your current improvement and change management systems? Is the organization good at responding effectively and efficiently to new circumstances? Is the business healthy enough to meet the expectations of analysts and investors? 13
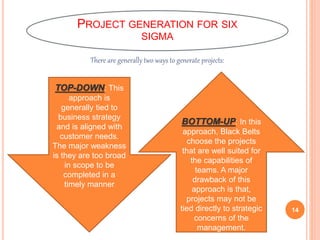
- 14. There are generally two ways to generate projects: PROJECT GENERATION FOR SIX SIGMA TOP-DOWN: This approach is generally tied to business strategy and is aligned with customer needs. The major weakness is they are too broad in scope to be completed in a timely manner BOTTOM-UP: In this approach, Black Belts choose the projects that are well suited for the capabilities of teams. A major drawback of this approach is that, projects may not be tied directly to strategic concerns of the management. 14
- 15. METHODOLOGY OF SIX SIGMA DMAIC: It refers to a data- driven quality strategy for improving processes. This methodology is used to improve an existing business process. DMADV: It refers to a data-driven quality strategy for designing products and processes. This methodology is used to create new product designs or process designs in such a way that it results in a more predictable, mature and defect free performance. Six Sigma has two key methodologies: 15
- 16. DMAIC METHODOLOGY This methodology consists of the following five steps. Define Measure Analyze ImproveControl 16
- 17. DEFINE: Define the problem or project goal that needs to be addressed. MEASURE: Measure the problem and process from which it was produced. ANALYZE: Analyze data and process to determine root cause of defects and opportunities. IMPROVE: Improve the process by finding solutions to fix, diminish, and prevent future problems. CONTROL: Implement, control, and sustain the improvement solutions to keep the process on the new course. 17
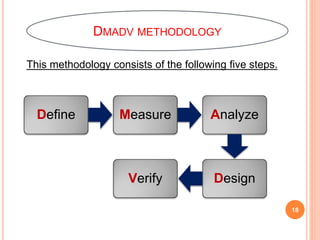
- 18. DMADV METHODOLOGY This methodology consists of the following five steps. Define Measure Analyze DesignVerify 18
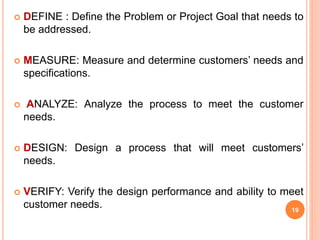
- 19. DEFINE : Define the Problem or Project Goal that needs to be addressed. MEASURE: Measure and determine customers’ needs and specifications. ANALYZE: Analyze the process to meet the customer needs. DESIGN: Design a process that will meet customers’ needs. VERIFY: Verify the design performance and ability to meet customer needs. 19
- 20. The first step is Define. During the Define phase four major tasks are undertaken. DEFINE PHASE 1- Project Team Formation 4- Develop The SIPOC Process Map3- Develop A Project Charter 2- Document Customers Core Business Processes 20
- 21. During the Measure Phase, the overall performance of the Core Business Process is measured. There are three important parts of Measure Phase: MEASURE PHASE Data Collection Plan And Data Collection Data Evaluation FMEA 21
- 22. A data collection plan is prepared to collect the required data. This plan includes what type of data needs to be collected, what are the sources of data, etc. You collect data from three primary sources: Data Collection Plan And Data Collection INPUT OUTPUTPROCESS 22
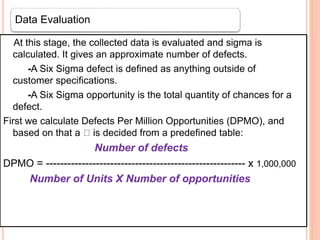
- 23. At this stage, the collected data is evaluated and sigma is calculated. It gives an approximate number of defects. -A Six Sigma defect is defined as anything outside of customer specifications. -A Six Sigma opportunity is the total quantity of chances for a defect. First we calculate Defects Per Million Opportunities (DPMO), and based on that a is decided from a predefined table: Number of defects DPMO = -------------------------------------------------------- x 1,000,000 Number of Units X Number of opportunities Data Evaluation 23
- 24. The food ordering delivery project team examines 50 deliveries and finds out the following: -Delivery is not on time (13) -Ordered food is not according to the order (3) -Food is not fresh (0) So now, DPMO will be as follows: 13 + 3 DPMO = ----------- x 1,000,000 = 103,666.7 50 x 3 EXAMPLE According to the Yield to Sigma Conversion Table, 106,666.7 defects per million opportunities is equivalent to a sigma performance of between 2.7 and 2.8. This is the method used for measuring results as we proceed through a project. This beginning point enables us to locate the cause and effect of those processes. 24
- 25. 25
- 26. EXAMPLE It refers to preventing defects before they occur. The FMEA process usually includes rating possible defects, or failures, in three ways: The likelihood that something might go wrong. The ability to detect a defect. The level of severity of the defect. Failure Mode And Effects Analysis (FMEA) Rate each of these three areas from 1 to10, with 1 being the lowest FMEA level and 10 being the highest. The higher the level ,the more severe the rating. Hence, a high FMEA indicates the need to devise and implement improved measuring steps within the overall process. This would have the effect of preventing defects. 26
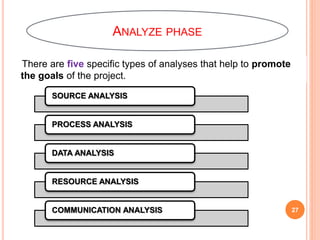
- 27. There are five specific types of analyses that help to promote the goals of the project. ANALYZE PHASE SOURCE ANALYSIS PROCESS ANALYSIS DATA ANALYSIS RESOURCE ANALYSIS COMMUNICATION ANALYSIS 27
- 28. This is also called root cause analysis. It attempts to find defects that are derived from the sources of information or work generation. After finding the root cause of the problem, attempts are made to resolve the problem before we expect to eliminate defects from the product. SOURCE ANALYSIS 28
- 29. PROCESS ANALYSIS -Analyzing the numbers to find out how well or poorly the processes are working, compared to what's possible and what the competition is doing. -Process analysis includes creating a more detailed process map, and analyzing the more detailed map, where the greatest inefficiencies exist. -The process refers to the precise movement of materials, information, or requests from one place to another. 29
- 30. DATA ANALYSIS -Many a times the data itself may have defect. -There may be a case when products or delivery do not provide all the needed information. -Data is analyzed to find out defects and attempts are made to resolve the problem before it is expected to eliminate defects from the product. 30
- 31. RESOURCE ANALYSIS -It is also needed to ensure that employees are properly trained in all departments that affect the process. -Resources include raw materials needed to manufacture, process, and deliver the goods. For example, If the Accounting Department is not paying vendor bills on time and, consequently, the vendor holds up a shipment of shipping supplies, it becomes a resource problem. 31
- 32. COMMUNICATION ANALYSIS -One problem common to most processes high in defects is poor communication. -The classic interaction between a customer and a retail store is worth studying because many of the common communication problems are apparent. For example, A vendor wants payment according to agreed-upon terms, but the Accounting Department wants to make its batch processing uniform and efficient. Between these types of groups, such disconnects demonstrate the importance of communication analysis. 32
- 33. IMPROVE PHASE • Improvement breakthroughs, •Identify high gain alternatives, •Select preferred approach, •Design the future state, •Determine the new sigma level, •Perform cost/benefit analysis, •Design dashboards/scorecards, and •Create a preliminary implementation plan. The objective of Improve phase is to identify: 33
- 34. CONTROL PHASE -This is the phase where one ensures that the processes continues to work well, produce desired output results, and maintain quality levels. -This phase is concerned with four specific aspects of control, which are as follows. Quality control Standardization Control methods and alternatives Responding when defects occur 34
- 35. TECHNICAL TOOLS The technical tools are those tools which a Six Sigma team member needs to master as they progress through any one of the methodology. The Cause-Effect Diagram The Scatter Diagram The Affinity Diagram The Run Chart The Control Chart Critical to Quality CTQ tree The Process Map The Histogram The Pareto Chart The Process Summary Worksheet 35
- 36. Tool #1 – The Critical to Quality (CTQ) Tree · Identify the customer of the process targeted for improvement. · Identify the need of the customer. · Identify the first level of requirements of the need. · Drill down to more detailed level(s) of the requirement if necessary. The steps in creating a CTQ tree are as follows: 36
- 37. CTQ TREE 37
- 38. Tool #2 – The Process Map -A process map is a picture of the current steps in the process targeted for improvement. A process map has five major categories of work: The identification of the suppliers of the process, The inputs the suppliers provide, The name of the process, The output of the process, The customers of the process. 38
- 39. Tool #3 – Histogram Data is of two types - Discrete data (go/no go, fail or pass) and Continuous data(time, height etc.). The data should be organized into graphs or charts, which makes it easier to understand, what the data is saying about the process. 39
- 40. Tool #4 – The Pareto Chart When the data is discrete, Pareto chart is used. PARETO PRINCIPLE: An Italian economist Vilfredo Pareto, in the sixteenth century proved mathematically that 80 percent of the world's wealth was controlled by 20 percent of the population. This 80-20 rule eventually proved applicable in arenas other than economics. 40
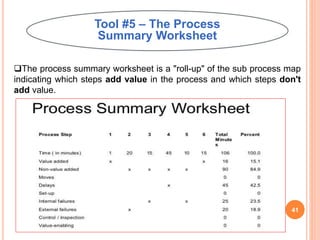
- 41. Tool #5 – The Process Summary Worksheet The process summary worksheet is a "roll-up" of the sub process map indicating which steps add value in the process and which steps don't add value. 41
- 42. Tool #6 – The Cause-Effect Diagram This tool captures all the ideas of the project team relative to what they feel are the root causes behind the current sigma performance and finally help in finding a root cause of the problem. FISH-BONE DIAGRAM 42
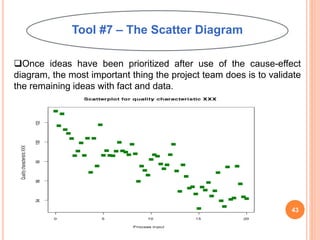
- 43. Tool #7 – The Scatter Diagram Once ideas have been prioritized after use of the cause-effect diagram, the most important thing the project team does is to validate the remaining ideas with fact and data. 43
- 44. Tool #8– The Affinity Diagram An affinity diagram is used to help sort and categorize a large number of ideas into major themes or categories. It is especially useful when the team is ready to brainstorm solutions. 44
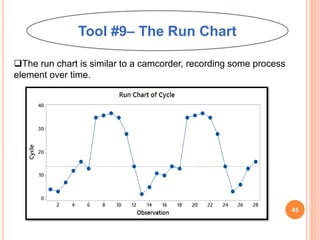
- 45. Tool #9– The Run Chart The run chart is similar to a camcorder, recording some process element over time. 45
- 46. Tool #10– The Control Chart Similar to a run chart, a control chart uses the data from a run chart to determine the upper and lower control limits. These limits are mathematically calculated and indicated by dotted lines. 46
- 47. BENEFITS OF SIX SIGMA( ) .Generates sustained success · Sets a performance goal for everyone · Enhances value to customers · Accelerates the rate of improvement · Promotes learning and cross-pollination · Executes strategic change 47
- 48. MYTHS ABOUT SIX SIGMA( ) · Six Sigma is only concerned with reducing defects. · Six Sigma is a process for production or engineering. · Six Sigma cannot be applied to engineering activities. · Six Sigma uses difficult-to-understand statistics. · Six Sigma is just training. 48
- 49. “COMPANIES” WHO HAVE IMPLEMENTED SIX SIGMA( ) 3M. Amazon.com. BAE Systems. Bank of America. BD Medical. Bechtel Corporation. Boeing. Caterpillar Inc. Telco Tisco Ford Visteon Wipro and many more…….!!! 49
- 50. 50
Editor's Notes
- Why we should implement six sigma into any organization………….
- William B. Smith, Jr. (1929 – 1993) is the "Father of Six Sigma". Born in Brooklyn, New York, Smith graduated from the U.S. Naval Academy in 1952 and studied at the University of Minnesota School of Management In 1987, after working for nearly 35 years in engineering and quality assurance, he joined Motorola, serving as vice president and senior quality assurance manager for the Land Mobile Products Sector. died of a heart attack in the Motorola cafeteria in 1993, never knowing the scope of the craze and controversy he had touched off.
- At its core, Six Sigma revolves around a few key concepts.-------
- 2- This gives a chance to identify weak areas with in a process and then we can improve them. 3-It is important to Six Sigma that all the team members should have a well-defined role with measurable objectives.
- Under a Six Sigma program, the members of an organization are assigned specific roles to play, each with a title. This highly structured format is necessary in order to implement Six Sigma throughout the organization. Leadership: just as a corporate leader sets a tone and course to achieve an objective, the Six Sigma council sets the goals to be met by the team. Here is the list of Leadership Council Responsibilities: Defines the purpose of the Six Sigma program Explains how the result is going to benefit the customer Sets a schedule for work and interim deadlines Sponsor: Sponsors are the owners of processes and systems, who help initiate and coordinate Six Sigma improvement activities in their areas of responsibilities. Implementation Leader: The person responsible for supervising the Six Sigma team effort Coach: Coach is a Six Sigma expert or consultant who sets a schedule, defines result of a project, and who mediates conflict, or deals with resistance to the program. Team leader: It is an individual responsible for overseeing the work of the team and for acting as a go-between with the sponsor and the team members. Team member: An employee who works on a Six Sigma project, given specific duties within a project, and has deadlines to meet in reaching specific project goals. Process owner: The individual who takes on responsibility for a process after a Six Sigma team has completed its work.
- If you are the owner of the certain organization, than how would you decide whether the six sigma is right for your organization or not … So to decide this one must ask these questions to his organization.
- For these already explained methodolgy ,we will now try to elaborate each phase seperately.! Project Team Formation: Perform two activities: Determine who needs to be on the team. What roles will each person perform? Document Customers Core Business Processes: A set of business processes is documented. These processes will be executed to meet customer's requirements and to resolve their Critical to Quality issues. Develop a Project Charter: This is a document that names the project, summarizes the project by explaining the business case in a brief statement, and lists the project scope and goals. Develop the SIPOC Process Map :SIPOC is a process map that identifies all the following elements of a project: Suppliers Input Process Output Customers SIPOC map helps us to improve the processes at later stages of any methodology adopted.
- The input source is where the process is generated. Process data refers to tests of efficiency: the time requirements, cost, value, defects or errors, and labor spent on the process. Output is a measurement of efficiency.
- Number of defects is the total number of defects found, Number of Units is the number of units produced, and number of opportunities means the number of ways to generate defects.
- Quality Control The ultimate purpose is the overall assurance that a high standard of quality is met. Customer's expectations depend on this, so control is inherently associated with quality. Standardization Standardization enables processes to go as smoothly as possible. In a manufacturing environment, the value of standardization has been proven over and over. Control Methods and Alternatives The development of a new process of any change to an existing process requires the development of procedures to control work flow. Responding when Defects Occur The weak links in the procedure, where defects are most likely to occur, can and should be monitored carefully so that defects can be spotted and fixed before the process continues.
- -It is used to brainstorm and validate the needs and requirements of the customer of the process, targeted for improvement.
- And the validation of these data is done with the help of the scatter diagram
- A run chart, also known as a run-sequence plot is a graph that displays observed data in a time sequence. Often, the data displayed represent some aspect of the output or performance of a manufacturing or other business process.
- Control limits are the expected limits of variation above and below the average of the data
- Six Sigma offers six major benefits that attract companies:
- There are several myths and misunderstandings surrounding Six Sigma. Some of them are given below:


