


Social Media Planning
- 1. B Y : D E R R I C K W A L K E R F O R : S O C I A L I N K ! Creating a Social Media Plan
- 2. Overview Social Media Channels 6 Steps to Creating a Social Media Plan Budgeting for Social Media Getting Started Questions
- 3. What is Social Media Social media is media designed to be disseminated through social interaction, created using highly accessible and scalable publishing techniques. - wikipedia.org
- 4. What is Social Media? An ongoing conversation that’s happening RIGHT NOW A promotional channel for content distribution A long-term return on investment A steady stream of information for: Research Feedback Building Relationships with customers, clients, contacts
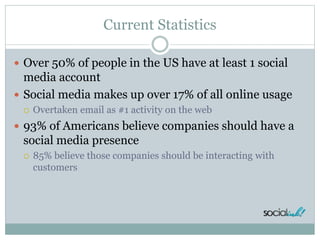
- 5. Current Statistics Over 50% of people in the US have at least 1 social media account Social media makes up over 17% of all online usage Overtaken email as #1 activity on the web 93% of Americans believe companies should have a social media presence 85% believe those companies should be interacting with customers
- 6. Social Media Facts- Facebook 1.5 Billion active users worldwide 819 Million on mobile devices Mobile users are twice as active as non-mobile users 53% female, 46% male 300 Million Photo uploads per day Thursdays and Fridays, engagement is 18% higher Average time spent on Facebook is 20 minutes 4.75 Billion pieces of content shared daily Largest segment is 25-34 years old
- 7. Social Media Facts- Twitter 1 Billion registered users 500 million tweets sent daily 100 Million active users daily 170 minute spent per user on Twitter Monthly Peak days to tweet are Tuesday & Wednesday Millennials and Teens are most active segment
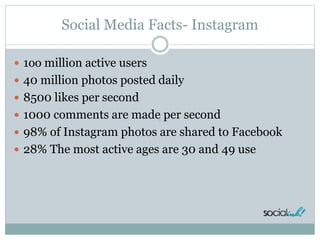
- 8. Social Media Facts- Instagram 1oo million active users 40 million photos posted daily 8500 likes per second 1000 comments are made per second 98% of Instagram photos are shared to Facebook 28% The most active ages are 30 and 49 use
- 9. Social Media Facts- YouTube 1 Billion unique visits each month Over 6 billion hours of video are watched each month on YouTube Almost an hour for every person on Earth, and 50% more than last year 100 hours of video are uploaded to YouTube every minute 70% of YouTube traffic comes from outside the US According to Nielsen, YouTube reaches more US adults ages 18-34 than any cable network
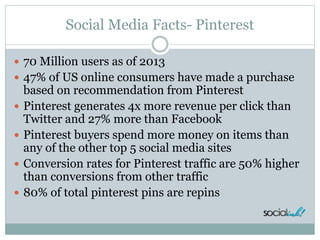
- 10. Social Media Facts- Pinterest 70 Million users as of 2013 47% of US online consumers have made a purchase based on recommendation from Pinterest Pinterest generates 4x more revenue per click than Twitter and 27% more than Facebook Pinterest buyers spend more money on items than any of the other top 5 social media sites Conversion rates for Pinterest traffic are 50% higher than conversions from other traffic 80% of total pinterest pins are repins
- 11. Social Media Facts– Google+ Over 350M Users Google plus has great SEO benefits Google plus links are all “dofollow”, meaning they pass valuable link juice Posts are crawled and indexed immediately Bots crawl 2,500 words on a + page, vs 275 on Facebook Google Plus for business offers more integrated analytics on your business page
- 12. How is Social Media Used? Customer Service Product/Service Feedback Networking and Job Searching Lead Generation/Sales Promotions News Internal communication
- 13. Creating a Social Media Plan Steps: 1. Preplanning 2. Listen to the Conversation 3. Create Your Target Profiles 4. Set Specific Goals 5. Join the Conversation 6. Measure ROI
- 14. Step 1 - Preplanning Questions to ask internally: Where do our customers get their information What influences our customers? How does information flow in our industry? What promotional channels are we currently using? What is currently working the best/worst? What is my sales funnel? How are leads qualified? Asking questions indicates how social media can be used to complement your business goals.
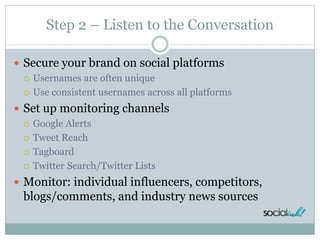
- 15. Step 2 – Listen to the Conversation Secure your brand on social platforms Usernames are often unique Use consistent usernames across all platforms Set up monitoring channels Google Alerts Tweet Reach Tagboard Twitter Search/Twitter Lists Monitor: individual influencers, competitors, blogs/comments, and industry news sources
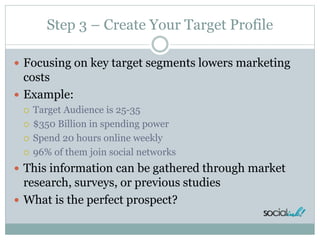
- 16. Step 3 – Create Your Target Profile Focusing on key target segments lowers marketing costs Example: Target Audience is 25-35 $350 Billion in spending power Spend 20 hours online weekly 96% of them join social networks This information can be gathered through market research, surveys, or previous studies What is the perfect prospect?
- 17. Step 3 – Create Your Target Profile Find key attributes from monitoring channels Chart presence on social media Determine Market Segmentation Demographic Geographic Psychographic Behavioralistic Continue gathering customer data at each step of your plan
- 18. Step 4 – Set Specific Social Goals Increase brand awareness Generate Leads Increase traffic/Opt-ins Develop relationships with current customers Boost SEO/SEM results Reduce CRM costs Increase Revenue
- 19. Step 5 – Join the Conversation 3 Phases of Social Equity Awareness Qualify fans and followers as leads Engagement Increase long-term communication Exclusive promotions will help turn advocates into customers Social Commerce Determine small data set to introduce products to Gather product reviews
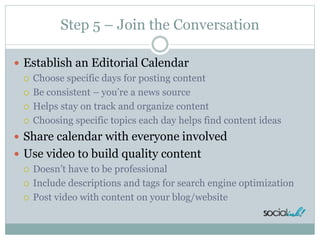
- 20. Step 5 – Join the Conversation Establish an Editorial Calendar Choose specific days for posting content Be consistent – you’re a news source Helps stay on track and organize content Choosing specific topics each day helps find content ideas Share calendar with everyone involved Use video to build quality content Doesn’t have to be professional Include descriptions and tags for search engine optimization Post video with content on your blog/website
- 21. Step 5 – Join the Conversation Be Transparent and Authentic Don’t be evasive Offer your name, title, experience Admit your interests in the topic Define your credibility (Use LinkedIn to build your credible profile) Contribute quality input on topics of interest Strive to answer questions about your authenticity Don’t focus on selling, focus on engagement Earn a reputation, build trust, then sell to qualified leads
- 22. Step 5 – Join the Conversation Be the expert in your industry Write about what you know Offer insights to those who ask for it Share links to resources you think add to the conversation Use topics you monitor to start conversation Articles/blog posts Community Forum Threads Conversation from social media groups When customers trust your content, they’ll trust what you’re selling
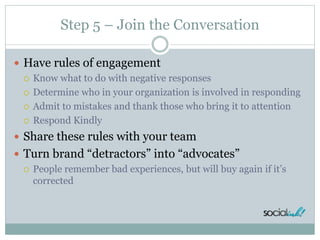
- 23. Step 5 – Join the Conversation Have rules of engagement Know what to do with negative responses Determine who in your organization is involved in responding Admit to mistakes and thank those who bring it to attention Respond Kindly Share these rules with your team Turn brand “detractors” into “advocates” People remember bad experiences, but will buy again if it’s corrected
- 24. Step 6 – Measure Your Returns What is a Return? Non-financial Visitors, word of mouth, page views, fans, followers, referrals Financial Sales, Transactions, Coupons ROI Not all returns have to be $$ to bring value
- 25. Step 6 – Measure Your Returns Qualitative Are we part of our industry’s conversation? How do our customers perceive us versus our competitors? Did we build key relationships? Are we moving from monologue to dialogue? Quantitative Website Analytics Social Mentions SEO Rankings Linkbacks Subscribers
- 26. Step 6 – Measure Your Returns Establish before/after baseline What did our online environment look like before social media? What online channels were we using? What does it look like now? Determine hard numbers here 5.5% conversion rate before 8.5% conversion rate now This baseline should track at least 6 months
- 27. Step 6 – Measure Your Returns Develop Activity Timeline along same baseline Diagram exact dates in which key SM activities occurred 8/11 blog started 8/13 Facebook page started 9/15 FB ad campaign begins 9/17 FB ad ended Note Milestones on diagram 500/1000/10,000 fans 100 clicks back to blog link
- 28. Step 6 – Measure Your Returns Look at Key Performance Indicators (KPI) Transactions New Customers Sales Revenue Average Order Size E-mail list size Use Google Analytics to determine exact numbers What are the transaction precursors? Brand mentions Loyalty metrics In-Store traffic (Online/Off-Line) Free sample offers
- 29. Step 6 – Measure Your Returns Overlay all timelines and look for patterns SM Activities Web Analytics Store Metrics Loyalty Metrics Circle areas where increases occur How were specific numbers achieved? Facebook promotion Product launch Press release Coupon offer
- 30. Budgeting for Social Media Allocation vs. Addition Do you raise new funds or borrow from existing budgets? How to determine Allocation or Addition What are your goals? How much is your existing marketing budget? Which current tactics work? Which are most expensive? What internal resources are available?
- 31. Budgeting for Social Media What to budget for: Time Design and Branding Analytics Tools Social Monitoring Automation Applications Social Media Advertising Outsources/Consulting
- 32. How to Get Started Start with platforms you can actively maintain What outsourcing is needed? Design, development, content management, market research Plan your content flow Will you push content through all channels? Find tools to automate processes Tweetdeck (now by Twitter) Hootsuite Sprout Social Mailchimp Tweetreach
- 33. Additional Resources Blogs Mashable.com Inc. Tools Tweetdeck Hootsuite
- 34. Questions? Contact me at: Twitter.com/socialinkdfw Facebook.com/socialinkdfw Instagram.com/socialinkdfw