Social media report - European String Teachers Association
- 1. 11 Social Media Report December 2019 to June 2020
- 2. Creative Single Image Portfolio Options Bear claw croissant apple pie. Croissant cake tart liquorice tart pastry. Tiramisu apple pie biscuit sweet oat cake sweet icing brownie. Chocolate bar brownie carrot cake bear claw muffin. Chocolate macaroon lollipop
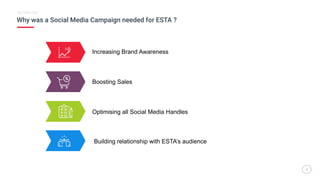
- 3. Why was a Social Media Campaign needed for ESTA ? 3 SECTION ONE 3 Increasing Brand Awareness Boosting Sales Optimising all Social Media Handles Building relationship with ESTA’s audience
- 4. Platforms Used and Why? 4 SECTION ONE 4 The best place to kick start your business owing to the reach of over 1 billion people Facebook The musical your tweet is, the faster people get in touch with you. The only place you can be offered to be funded within a month and video content works splendidly Gaining followers is the easiest ever. Build a consistent user base. The place where you went to search for every other thing would help people find YOU. Twitter LinkedIn Instagram Google Ads
- 5. Tasks Undertaken 5 SECTION TWO 5 Social Media Consistency Graphic Designing Content Marketing & Optimisation Selling Memberships Managing and Creating the Google Ads Campaigns
- 6. ESTA’s Google Ads Journey The growth across various platforms has been steady and consistent with user appreciation growing by the increased number of posts. 5 Dec 2019We started The first few weeks were focused planning the campaigns which were to be made content specific. We had to work on the Keywords suggested by Phil and Steve with a Goal to increase the memberships. Market Research and Strategising After studying and researching about ESTA and its goals we needed to create our campaigns, the initial phase was tough than anticipated yet we achieved and are performing much better than competitors Google Ads Campaign 124 K 166 K Mobile User Desktop/ Laptop User From our campaigns, we grew users across the given platforms Device Based User Analytics Our Google Ads strategy for an Ads grant program has one of the highest click through rate ever across all organisations. 78% Impressions 10% Click Rate
- 7. ESTA needed to grow the members the on the platform for which each instrument and the age group has a campaign of its own. Our Business Strategy 8.5 9.2 9.8 Violin Classical Instruments Violin Teachers Google ranks the keywords you have used for campaigning your sales across its database and gives you a score based on the competitor analysis. Most Prominent Keywords and their Rating Add more wider user oriented content on which Ads can run more successfully. Sales Booster Techniques... Improve the UI of the landing pages. ✓ ESTA website gets about 18% of its daily traffic from Google Ads. ✓ At least 72% of the new ESTA member have used Google Ads to join. ✓ We utilize about 3% of our monthly Google Ads budget. Stats Focussing to the needs of the Niche Changing the font would increase the number of people that stay on the page.
- 8. This shows that our ads were shown to over 1600 people each day proving more and more people are searching for us. Facts Over 8000 users from the African Subcontinent People who reached out to buy the membership from Google Ads 7000 Over 30% of people signed up through Google Ads 983 Business Impacts Over 300K impressions of our ads 24 June 2020
- 9. Membership Sign Ups 9 SECTION TWO 9 Retired (life membership) Retired Students 31 56 277 Full Professional Full young professional Overseas Professional 421 138 60 Total Sales : £83,555
- 10. Facebook Impact 10 SECTION TWO 10 ● 3.5K people are reached with each post on an average. ● About 11 people respond to each post in the form of Likes, Shares and Comments. Customer Data Analysis Reach Share & Comments Likes Followers ● Posts with images got the most number of likes, comments and shares. ● Google analytics shows that this is the highest ever traffic from Facebook. 890 K 45 K 240K 2K
- 11. The increased number of profile visits ensure that about 5% of those people would end up following our page and engaging with out tweets Profile Visits 85 % 90 K This is the proof of our Social Media impact that people actually like our posts and want to know more about it. New Followers 10 % 733 Twitter Tally 11 SECTION TWO 11 Efficient and tweets with Images/ Links/ Vidoes show an increase in our presence among the users and higher engagement rate. Tweets 40 % 285 A significant amount of people saw our post giving them a chance to engage with our page and posts at a much higher rate. Impressions 130 % 674 K
- 12. Instagram and LinkedIn Picturesque 12 SECTION TWO 12 0 Followers Likes Reach August to October had a very successful marketing campaign in comparison to November - December, though, each month had increased analytics as compared to the last quarter by a margin of over 50%. December to June 0 0 80 2.4 K 8 K
- 13. Google Analytics 13 SECTION TWO 13 213 165K+ THOUSAND page views with new and distinguished page views having 6+minutes spent by user on average on the website Increased the number of users by With over 223.7% 70 %traffic coming through social media platforms and Google Ads
- 14. Major Impact for European String Teachers Association(ESTA) 14 SECTION THREE 14 FollowersLikes Reach MembersImpressionsEngagement/ Click Rate %Increase in 220 420 800 360 530 248
- 15. The Social Media Report on European String Teachers Association By Achin Gupta
- 16. 16


