Sp log - Well logging
- 1. Asst. Lecturer: Amir I. Abdelaziz Helwan University
- 2. Asst. Lecturer: Amir I. Abdelaziz Helwan University
- 3. Tools Electrodes A galvanometer Small 1.5 V battery 3
- 4. Spontaneous potential Galvanometer: Record the difference in voltage between a moving electrode in the borehole and a reference electrode at the surface usually located at the mud pit.
- 5. Application Two principal uses of Sp Logs : QUANTITATIVE USES Formation Water Resistivity (Rw)determination Shale Volume Indicator QUALITATIVE USES Detecting permeable beds Correlation from well to well Facies 5
- 6. Operation An electrode (usually lead) is lowered down the well and an electrical potential is registered at different points in the hole with respect to surface electrode. In order to record a potential the hole must contain conductive mud, as it cannot be recorded in air or oil-base mud. Logging rate is approximately 1500m per hour and recordings are continuous. 6
- 7. Log Presentation SP is presented in : •Track 1 •SP currents measured in milli volts. •Scale is in +ve or –ve mili volts •-ve deflection to left and +ve to the right •It is usually run with Gamma ray or Caliper Log 7
- 8. Factors affect the Sp 1. The Rmf / Rw ratio 2. Fresh mud Rmf < Rw - Ve SP 3. Saline mud Rmf > Rw + Ve 4. If Rmf = Rw No SP deflection 8 ESP = -K log (Rmf) /(Rw) ESP = -K log (Rmf) /(Rw) • Kc = (61+0.133 T (f) ) • Kc = (65 + 0.24 T (c ) ) • 1 C = 33.8 F
- 9. How to read a log In sand A, Rw is less than Rmf; i.e., formation water is saltier than the mud filtrate. In sand B, the SP deflection is less than in sand A, indicating a fresher formation water. In sand C, the SP is reversed, indicating formation water that is fresher than the mud filtrate (Rw > Rmf). We may guess that, at about 7000 ft, Rmf and Rw are equal. 9
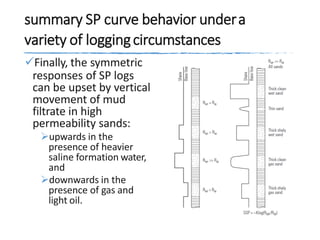
- 10. shale and clean sand beds alongwith the idealized response of SPlogging deflections to the left correspond to increasingly negative values. In the first sand zone, there is no SP deflection since this case represents equal salinity in the formation water and in the mud filtrate. The next two zones show a development of the SP which is largest for the largest contrast in mud filtrate and formation water resistivity. In the last zone, the deflection is seen to be to the right of the shale baseline and corresponds to the case of a mud filtrate which is saltier than the original formation fluid. 10
- 11. Shale Volume Calculation Shale Base Line Th definition of s.p zero is made on thick shale intervals where s.p does not move to the left or right is called shale base line. Static sp: (ssp) The theoretical maximum deflection of s.p opposite permeable beds is called static s.p or ssp. It is maximum possible s.p opposite a permeable water bearing formation with no shale. Pseudo SP: (PSP) Any deflection less than (SSP) 11
- 12. 12
- 13. Shale Volume Calculation: V shale = (SPclean – SPlog)/(SPclean-SPshale) Vshale: shale volume SPclean: maximum Sp deflection from clean wet zone SPlog: Sp in the zone of interest (read from the log) Spshale: SP value at the shale baseline (often considered to be zero) 13
- 14. summary SP curve behavior undera variety of loggingcircumstances Finally, the symmetric responses of SP logs can be upset by vertical movement of mud filtrate in high permeability sands: upwards in the presence of heavier saline formation water, and downwards in the presence of gas and light oil.
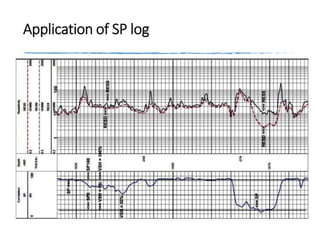
- 15. Application of SP log
- 16. Application of SP log Freshwatersand Rw=10Ohm T=50c FreshwaterRw=1Ohm T=60c SaltwaterRw=0.05Ohm T=70c Fresh mud Rmf = 1 Ohm Fresh mud Rmf = 1 Ohm
- 17. Q2-(B) A number of factors affects the shape and amplitude of SP log as Rmf/Rw ratio, bed thickness, bed resistivity and Porosity. If there is a succession of shale and sand in a well where the Rw was = 10 ohm in the sand layer (1) and Rw= 0.5 at sand layer (2) and Rmf = 1 ohm at Temp. 60 0 C and fresh water exists, Calculate 1- Kc and Esp 2- Show the deflection direction of SP log. -SP+ Shale Sand (2) Shale Sand (1) Application of SP log
- 18. Application of SP log
- 19. General Log responses Lithology DensityGR ResistivityAcousticNeutron Sandstone 2.65Low (Unless RA min) high55-4 Salt 2.1Low (Unless K salt) V.high670 Anhydrite 2.95V.low V.high50-1 Dolomite 2.85Low (higher if U) high42.5+4 Shale 2.2-2.7 (water content) high low (water content) 50-150 (water content) High (water content) Limestone 2.71low high47.50 Gas 0.2-0.5 (pressure) 0 V.high~100010-50 (H2 index) Oil 0.6-1.0 (api) 0 V.high210-240 (api) 70-100 (H2 index) Water 1-1.1 (salt and Temp) 0 0 - infinite (salt and Temp) 180-190100


