Location via proxy:   [ UP ]  
[Report a bug]   [Manage cookies]                
SlideShare a Scribd company logo
e                                                    Pitch

    “We want to help people create smart uses of space
                      everywhere”
                Franki Chamaki, Cofounder Spaceble
…
       , I’m … from
     Hi


Hi, I’m Franki Chamaki from Spaceble:
 a peer-to-peer marketplace for space


                                        2   2
g…
                     ar e solvin
             le m we
  Th   e prob


We help people utilize their unused space

and generate income by finding and
connecting with those who are in need of

space.


                                            3   3
n   is…
        Our solutio


Our solution enables space owners to list,
find and connect with space seekers and
turn any space in to rentable income

1. space to use: i.e. space for artist brand practice
2. space to store: i.e. physical stuff
3. space to park: i.e. car, boat etc.


                                                        4   4
ity   …
             ig o p por tun
           ab
 This is


This is a BIG opportunity because the
current Australian market for storage alone
is undersupplied
this includes some major cities in the USA – and
does not take into account space for use or
space to park


                                                   5   5
…
                 ma rket is
   O   ur target


Our target market focuses on populated
and urban communities starting with:
universities, public transport and social,
sport & recreation hubs

Example: Randwick (University hub),
Ultimo (University/Transport hub)
Annandale NSW (Social hub)


                                             6   6
er   by…
            ire c ustom
          qu
    We ac


Spaceble is considered a “blue ocean” business.
We are experimenting with small marketing pilots
to determine effective communication channels
and will acquire customers by organic as well as
targeted social media and search engine
marketing (e.g. Facebook and Google).

We also are engaging with “likeminded”
customers – AirBnB, Gumtree and invite them to
list.

                                            7    7
y…
         ke m oney b
    We ma


Primary revenue source is pay to connect
model:


                                           8   8
….
                            comp etitors
                    y
              Our ke

                We are “blue ocean” and there is no direct

                                                          Peer
                                                                                       competitors

                                                                            Spaceble


                                                            craigs   Gum
                                                             list    tree
       Storage                                                                                       Space
   (i.e. storage sizes,                                 Space   cracker                       (i.e. no standard sizes,
fix location, conditions)                                out                              fixed location, physical/non-
                                                                                         physical or standard conditions)
                            Kennard's       Storage
                               Self          King
                             Storage

                                    Grace Self
                                     Storage


                                                      Commercial


                                                                                                            9      9
s…
         Our t e am i


!   Co-founder: Franki Chamaki
  !   20 years plus corporate experience & business
      design, strategy and innovation
  !   Serial start up entrepreneur: mockupmytattoo.com,
      shakeyourlove.com

!   Co-founder: Johnny Chamaki
  !   30 years plus architecture and design experience
  !   Multi awarding furniture and architect design


                                                          10   10
…
             o next is
  Wh at we d


Our focus is to build a sustainable
community membership through
marketing and accessibility.
This means continuing with our marketing
experiments and establishing a mobile
presence


                                           11   11
g…
                     rrent seekin
              c  u
       We are

        We are seeking $150,000 funding angel funding
NOW   Private beta

      Build core relationships

      Develop strategies
                                      $150,000 will achieve:
                                      •    6,600+ users
      Receive capital injection
                                      •    Spaceble as market leader for
      ($150,000)                           “space” market in two cities –
                                           Australia only
      Activate segment strategy

      Launch viral campaign

      Stage 1 – formal campaign

      TV/Media Campaign
                                      $500,000 will achieve:
      Commerce round A capital        •    30,000+ users
      raising ($0.5 million)          •    Spaceble as market leader for
                                           “space” market in four cities -
      Capital injection ($500,000)         Australia and US


                                                                             12   12
ar     ies
    To summ

                           To summaries…
!   Spaceble is changing the way people think about space and its use
!   The intent is to revolutionize the way empty space is used by
    transforming into rentable space
!   We are experiment with different cost-effective ways to market this
    space movement
!   Current players sell storage. That’s it.
!   They lack discovery. They lack social. They limit opportunity and use
    current paradigm when looking at storage rather ‘space’.
!   Opportunity is big and real.
!   Spaceble wants to “Make more out of space”


                                                                      13    2
e                                       Appendix


    “We want to help people create smart uses of space
                      everywhere”
                Franki Chamaki, Cofounder Spaceble
Overview
!   Spaceble is a peer-to-peer marketplace for space.

!   Sydney startup recently launched an interesting concept to sell "space". With the tag
    line "Spaceble. Make more out of space" Spaceble aim to commercialize the spare.

!   Spaceble is changing the way people think about space and use its used. The intent
    is to revolutionize the way empty space is used by transforming, i.e. garages, yards,
    rooms, offices, driveways, etc., into rentable space - space to use (i.e. space for artist
    brand practice, art creation), space to storage (i.e. physical stuff), space to park (i.e.
    car, boat etc).

!   Spaceble is more than just disrupting the self-storage and parking market, it seeks to
    brings new space supply while changing the way people think about and use their
    space.

!   Spaceble makes more out of space and is currently live in Sydney, Australia.


                                                                                           15    15
Business Highlights
!   Core competency:
   Platform that find and connects space owners and space seekers

!   Market Segment:
   Self storage and Packing


!   Customer base:
   Businesses & Consumers - Student Storage, Household Storage, Business Storage, Relocation, Auto, Boat


!   Primary revenue source:
   Pay to Connect

!   Overhead:
   System enhancement and marketing

!   Exit strategy:
   Primary: Remain Private & Profitable
   Secondary: Buyout


                                                                                                           16   16
Market Summary
!   Market for space
   !   Current Australia market for storage is undersupplied
       (see next slide) this includes some major cities in USA – and does not
       take into account the parking segment.
   !   Spaceble market is considered “blue ocean” it does not exist unlike
       traditional incumbent like self storage providers.
   !   Its focus is more than just on storage or any physical items but space in
       its widest sense:
     !   Space to use (i.e. space for artist band practice gigs, art creation),
     !   Space to store (i.e. physical stuff),
     !   Space to park (i.e. car, boat etc.).
   !   Spaceble is a member site dedicated to space.


                                                                                  17   17
Market Summary (2)
                        Total Rentable (storage only) capacity per city 2008/09

                  Perth (WA)                           Undersupplied              Oversupplied
            Melbourne (Vic)
               Sydney (NSW)
               Auckland (NZ)
             Brisbane (QLD)
        New York (NY-NJ-PA)
                Honolulu (HI)
         Chicago (IL-IN-WI)
           Philadelphia (PA)
          Minneapolis (MN)
          Minneapolis (MN)
           Los Angeles (CA)
              Richmond (VA)
             San Diego (CA)
         San Francisco (CA)
                  Tampa (FL)
                Phoenix (AZ)
              Charlotte (NC)
                 Seattle (WA)
               Nashville (TN)
          New Orleans (LA)
         Salt Lake City ((UT)

                                0   0.1      0.2       0.3      0.4       0.5      0.6       0.7      0.8       0.9       1

                     Supply and Population Comparison Table - Australia & N.Z. Versus Selected U.S.Cities
Based on average USA and the Forecast Demand and Conclusion figures sourced from Cushman & Wakefield (California, USA). We
 observed, that If "Rental area per person" is greater 0.51 we can consider that storage market as oversupplied, if 0.51 or less we
    consider that market undersupplied, else equilibrium. This takes only storage perspective not parking. See appendix (1).


                                                                                                                              18      18
Market Summary (2)
                 Total Rentable (storage only) per week value per city 2008/09
                                         Supply vs. total market available

              New York (NY-NJ-PA)                                      $13,041,172.90
                 Los Angeles (CA)                                   $14,554,722.39
                                                                                                      Market undersupplied
               Chicago (IL-IN-WI)                                    $9,278,400.82
       Philadelphia (PA-NJ-DE-MD)                                    $5,912,187.49
                Minneapolis (MN)                                     $3,510,486.69                    Total market pw sqm
                Minneapolis (MN)                                     $3,510,486.69
                    Sydney (NSW)                                        $1,765,294.66
                 Melbourne (Vic)                                        $1,470,077.98
                  Brisbane (QLD)                                        $1,053,632.73
                   Auckland (NZ)                                         $716,349.39
                     Honolulu (HI)                                      $702,958.91
                       Perth (WA)                                         $550,726.67
                   Richmond (VA)                                $1,580,145.94
                   San Diego (CA)                             $4,126,062.77
               San Francisco (CA)                             $5,825,455.86
                       Tampa (FL)                         $3,978,458.54
                   Charlotte (NC)                     $2,476,675.89
                New Orleans (LA)                   $1,738,293.96
                    Nashville (TN)                  $2,277,269.25
                     Phoenix (AZ)                       $6,301,565.92
               Salt Lake City ((UT)           $1,602,068.39
                      Seattle (WA)                   $5,044,081.28

-40%        -20%                  0%    20%             40%                   60%       80%   100%

                   Supply and Population Comparison Table - Australia & N.Z. Versus Selected U.S.Cities
              Assuming modest rate of $2.6 per week, SQM (commercial storage only and does not include parking).


                                                                                                                      19     19
Market Summary (3)
!   The storage market for Sydney metro alone, at modest rate
    of $2.6 per week SQM, is estimate to be just around $1.7
    million per week.
!   This is represents commercial storage rental area only and
    does not include the opportunity of peer to peer
    residential spaces, work spaces or parking as sought by
    Spaceble. If we assume 30% additional for this segment,
    this equates to around $2.2 million per week opportunity
!   If we further assume Spaceble attaining 10%, that is
    $230,000 per week market opportunity for Sydney metro
    alone.


                                                           20    20
Competition
!   There are no direct competitors to Spaceble.com other than the closest
    being www.spaceout.com.au but this sites usability is poor, not
    engaging and fundamentally focus on “storage” rather “space”.

!   Summary of competitive differences

   !   Existing online marketplace are not built with the requirement or
       understanding of “space” in mind
   !   They are are place to sell: storage. That’s it.
   !   They lack discovery. They lack social. They limit opportunity and use
       current paradigm when looking at storage rather ‘space’.
   !   We’ve spoken to users selling and seeking space on existing places.
       They use it because they have to.
Product
            architecture
                      Social connection

                           Search facility

  Space demand                                Space Supply
    Space listings                            Wanted Listings


 Communication                               Trust & Safety
   Message system,
                                             Nickname, privacy
notification, suggestion


      Desktop                                    Mobile


                                                                 22   22
Summary of projections
                                                      Sydney and Melbourne only
                                 Year 1                     Year 2                Year 3                  Year 4          Year 5
          Revenue                    $29,700                      $59,400             $118,800                $237,600          $475,200
            Burn                    $150,000                     $150,000             $150,000                $150,000        $150,0000
         Headcount                         2                            2                    2                        2                2
         Customers                      6600                        13200                26400                    52800           105600
                       Net         $-120,300                    $-120,300             $-31,200                  $87,600         $325,200
                     Notes
1.   Assuming 550 new customers per month on average for Sydney and Melbourne only
2.   Assuming $7.5 credit purchases on average
3.   Assuming 60% "pay to connect" purchases
4.   Assuming double customer growth per year from previous year

                                                                 Burn break up:	
  
                                          Operations	
                                     $25,000 	
  

                                          Legal	
                                          $10,000 	
  

                                          Marketing	
                                      $65,000 	
  

                                                                                           $10,000 	
  
                                          Maintenance	
  
                                          Consultants	
                                    $10,000 	
  

                                                                                           $30,000	
  
                                          Salaries $15K	
  
                                          Total	
                                         $150,000 	


                                                                                                                               23     23
Summary of projections
                                  Sydney, Melbourne, New York, Los Angels only	
  
                                  Year 1	
                   Year 2	
                Year 3	
                     Year 4	
          Year 5	
  
         Revenue	
              $135,000 	
                $270,000 	
             $540,000 	
                $1,080,000 	
     $2,160,000 	
  
           Burn	
               $500,000 	
                $500,000 	
             $500,000 	
                  $500,000 	
       $500,000 	
  
        Headcount	
                    2	
                        2	
                     3	
                          3	
               4	
  
        Customers	
               30,000	
                   60,000	
               120,000	
                    240,000	
         480,000	
  
           Net	
               $-365,000 	
               $-230,000 	
              $40,000 	
                  $580,000 	
     $1,660,000 	
  
                     Notes	
  
1.   Assuming 2500 new customers per month on average for Sydney, Melbourne, New York, Los Angels only	
  
2.   Assuming $7.5 credit purchases on average	
  
3.   Assuming 60% "pay to connect" purchases	
  
4.   Assuming double customer growth per year from previous year	
  

                                                              Burn break up:	
  

                                      Operations	
                                             $50,000 	
  

                                      Legal	
                                                  $20,000 	
  

                                      Marketing	
                                             $340,000 	
  

                                      Maintenance	
                                            $10,000 	
  

                                      Consultants	
                                            $20,000 	
  

                                      Salaries $15K	
                                          $60,000 	
  

                                      Total	
                                                $500,000 	


                                                                                                                                  24       24
Marketing Considerations

!   Target Market/Demographics: Universities and
    transport hubs
!   Distribution and sales channels
!   Branding and strategic position
!   Media Mix: [Web Ads/Billboards/TV/Radio]
!   Marketing and sales team development


                                                   25   25
Appendix (1)
           Supply and Population Comparison Table - Australia & N.Z. Versus Selected U.S.Cities (This table has been assembled by Kennards Self Storage using data from Blackwell Consulting and Cushman and Wakefield) 2008/9


                       City                         # of Self Storage Facilities       Population                 Total Rentable Area (SQM)                   Rentable Area Per Person (SQM)                        Conclusion (1)

                                                                                                                Australia & NZ
                  Sydney (NSW)                                  111                     3,641,422                          494,030m²                                        0.13                                    Undersupplied
                 Melbourne (Vic)                                119                     3,371,888                          406,978m²                                        0.12                                    Undersupplied
                 Brisbane (QLD)                                 100                     1,676,389                          305,162m²                                        0.18                                    Undersupplied
                    Perth (WA)                                  48                      1,256,035                          152,547m²                                        0.12                                    Undersupplied
                  Auckland (NZ)                                 64                      1,303,068                          203,513m²                                        0.16                                    Undersupplied
                                                                                                                     USA
                   Phoenix (AZ)                                 555                     4,365,443                          2,692,978m²                                      0.61                                     Equilibrium
                   Seattle (WA)                                 495                     3,388,994                          2,365,893m²                                      0.69                                    Oversupplied
                  San Diego (CA)                                354                     3,072,574                          1,602,978m²                                      0.52                                     Equilibrium
                Minneapolis (MN)                                256                     3,318,028                          115,4007m²                                       0.34                                    Undersupplied


       San Francisco-Oakland-Fremont, CA                        485                     4,331,321                       2286286.679m²                                       0.53                                    Oversupplied


 Philadelphia-Camden-Wilmington, PA-NJ-DE-MD                    434                     5,919,740                       1927050.225m²                                       0.33                                    Undersupplied
                Minneapolis (MN)                                256                     3,318,028                          115,4007m²                                       0.34                                    Undersupplied
                    Tampa (FL)                                  371                     2,808,971                          1,645,352m²                                      0.58                                     Equilibrium
                  Charlotte (NC)                                258                     1,687,342                          1,120,669m²                                      0.66                                    Oversupplied
                  Nashville (TN)                                261                     1,534,899                          1,108,701m²                                      0.72                                    Oversupplied
                  Richmond (VA)                                 118                     1,229,109                          590,048m²                                        0.48                                    Undersupplied
                New Orleans (LA)                                201                     1,165,440                          868,280m²                                        0.74                                     Equilibrium
                Salt Lake City ((UT)                            205                     1,100,372                          947,971m²                                        0.86                                    Oversupplied
                   Honolulu (HI)                                48                       917,673                           209,589m²                                        0.22                                    Undersupplied
               New York (NY-NJ-PA)                              899                    19,099,625                          3828883m²                                        0.20                                    Undersupplied
                Los Angeles (CA)                               1075                    13,350,826                          4867801m²                                        0.36                                    Undersupplied
                Chicago (IL-IN-WI)                              671                     9,804,475                          2949270m²                                        0.30                                    Undersupplied

1 . This based on average USA and the Forecast Demand figure is sourced from Cushman & Wakefield (California, USA) conclusion. We can conclude, as estimate, that If "Rental area per person" is greater 0.51 we can consider that storage
market as oversupplied, if 0.51 or less we consider that market undersupplied, else equilibrium. This takes only storage perspective not parking.


                                                                                                                                                                                                                          26           26

More Related Content

Spaceble. Make more out of space. Pitch Document

  • 1. e Pitch “We want to help people create smart uses of space everywhere” Franki Chamaki, Cofounder Spaceble
  • 2. , I’m … from Hi Hi, I’m Franki Chamaki from Spaceble: a peer-to-peer marketplace for space 2 2
  • 3. g… ar e solvin le m we Th e prob We help people utilize their unused space and generate income by finding and connecting with those who are in need of space. 3 3
  • 4. n is… Our solutio Our solution enables space owners to list, find and connect with space seekers and turn any space in to rentable income 1. space to use: i.e. space for artist brand practice 2. space to store: i.e. physical stuff 3. space to park: i.e. car, boat etc. 4 4
  • 5. ity … ig o p por tun ab This is This is a BIG opportunity because the current Australian market for storage alone is undersupplied this includes some major cities in the USA – and does not take into account space for use or space to park 5 5
  • 6. ma rket is O ur target Our target market focuses on populated and urban communities starting with: universities, public transport and social, sport & recreation hubs Example: Randwick (University hub), Ultimo (University/Transport hub) Annandale NSW (Social hub) 6 6
  • 7. er by… ire c ustom qu We ac Spaceble is considered a “blue ocean” business. We are experimenting with small marketing pilots to determine effective communication channels and will acquire customers by organic as well as targeted social media and search engine marketing (e.g. Facebook and Google). We also are engaging with “likeminded” customers – AirBnB, Gumtree and invite them to list. 7 7
  • 8. y… ke m oney b We ma Primary revenue source is pay to connect model: 8 8
  • 9. …. comp etitors y Our ke We are “blue ocean” and there is no direct Peer competitors Spaceble craigs Gum list tree Storage Space (i.e. storage sizes, Space cracker (i.e. no standard sizes, fix location, conditions) out fixed location, physical/non- physical or standard conditions) Kennard's Storage Self King Storage Grace Self Storage Commercial 9 9
  • 10. s… Our t e am i !   Co-founder: Franki Chamaki !   20 years plus corporate experience & business design, strategy and innovation !   Serial start up entrepreneur: mockupmytattoo.com, shakeyourlove.com !   Co-founder: Johnny Chamaki !   30 years plus architecture and design experience !   Multi awarding furniture and architect design 10 10
  • 11. o next is Wh at we d Our focus is to build a sustainable community membership through marketing and accessibility. This means continuing with our marketing experiments and establishing a mobile presence 11 11
  • 12. g… rrent seekin c u We are We are seeking $150,000 funding angel funding NOW Private beta Build core relationships Develop strategies $150,000 will achieve: •  6,600+ users Receive capital injection •  Spaceble as market leader for ($150,000) “space” market in two cities – Australia only Activate segment strategy Launch viral campaign Stage 1 – formal campaign TV/Media Campaign $500,000 will achieve: Commerce round A capital •  30,000+ users raising ($0.5 million) •  Spaceble as market leader for “space” market in four cities - Capital injection ($500,000) Australia and US 12 12
  • 13. ar ies To summ To summaries… !   Spaceble is changing the way people think about space and its use !   The intent is to revolutionize the way empty space is used by transforming into rentable space !   We are experiment with different cost-effective ways to market this space movement !   Current players sell storage. That’s it. !   They lack discovery. They lack social. They limit opportunity and use current paradigm when looking at storage rather ‘space’. !   Opportunity is big and real. !   Spaceble wants to “Make more out of space” 13 2
  • 14. e Appendix “We want to help people create smart uses of space everywhere” Franki Chamaki, Cofounder Spaceble
  • 15. Overview !   Spaceble is a peer-to-peer marketplace for space. !   Sydney startup recently launched an interesting concept to sell "space". With the tag line "Spaceble. Make more out of space" Spaceble aim to commercialize the spare. !   Spaceble is changing the way people think about space and use its used. The intent is to revolutionize the way empty space is used by transforming, i.e. garages, yards, rooms, offices, driveways, etc., into rentable space - space to use (i.e. space for artist brand practice, art creation), space to storage (i.e. physical stuff), space to park (i.e. car, boat etc). !   Spaceble is more than just disrupting the self-storage and parking market, it seeks to brings new space supply while changing the way people think about and use their space. !   Spaceble makes more out of space and is currently live in Sydney, Australia. 15 15
  • 16. Business Highlights !   Core competency: Platform that find and connects space owners and space seekers !   Market Segment: Self storage and Packing !   Customer base: Businesses & Consumers - Student Storage, Household Storage, Business Storage, Relocation, Auto, Boat !   Primary revenue source: Pay to Connect !   Overhead: System enhancement and marketing !   Exit strategy: Primary: Remain Private & Profitable Secondary: Buyout 16 16
  • 17. Market Summary !   Market for space !   Current Australia market for storage is undersupplied (see next slide) this includes some major cities in USA – and does not take into account the parking segment. !   Spaceble market is considered “blue ocean” it does not exist unlike traditional incumbent like self storage providers. !   Its focus is more than just on storage or any physical items but space in its widest sense: !   Space to use (i.e. space for artist band practice gigs, art creation), !   Space to store (i.e. physical stuff), !   Space to park (i.e. car, boat etc.). !   Spaceble is a member site dedicated to space. 17 17
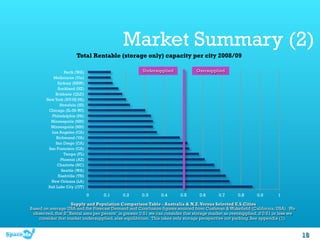
  • 18. Market Summary (2) Total Rentable (storage only) capacity per city 2008/09 Perth (WA) Undersupplied Oversupplied Melbourne (Vic) Sydney (NSW) Auckland (NZ) Brisbane (QLD) New York (NY-NJ-PA) Honolulu (HI) Chicago (IL-IN-WI) Philadelphia (PA) Minneapolis (MN) Minneapolis (MN) Los Angeles (CA) Richmond (VA) San Diego (CA) San Francisco (CA) Tampa (FL) Phoenix (AZ) Charlotte (NC) Seattle (WA) Nashville (TN) New Orleans (LA) Salt Lake City ((UT) 0 0.1 0.2 0.3 0.4 0.5 0.6 0.7 0.8 0.9 1 Supply and Population Comparison Table - Australia & N.Z. Versus Selected U.S.Cities Based on average USA and the Forecast Demand and Conclusion figures sourced from Cushman & Wakefield (California, USA). We observed, that If "Rental area per person" is greater 0.51 we can consider that storage market as oversupplied, if 0.51 or less we consider that market undersupplied, else equilibrium. This takes only storage perspective not parking. See appendix (1). 18 18
  • 19. Market Summary (2) Total Rentable (storage only) per week value per city 2008/09 Supply vs. total market available New York (NY-NJ-PA) $13,041,172.90 Los Angeles (CA) $14,554,722.39 Market undersupplied Chicago (IL-IN-WI) $9,278,400.82 Philadelphia (PA-NJ-DE-MD) $5,912,187.49 Minneapolis (MN) $3,510,486.69 Total market pw sqm Minneapolis (MN) $3,510,486.69 Sydney (NSW) $1,765,294.66 Melbourne (Vic) $1,470,077.98 Brisbane (QLD) $1,053,632.73 Auckland (NZ) $716,349.39 Honolulu (HI) $702,958.91 Perth (WA) $550,726.67 Richmond (VA) $1,580,145.94 San Diego (CA) $4,126,062.77 San Francisco (CA) $5,825,455.86 Tampa (FL) $3,978,458.54 Charlotte (NC) $2,476,675.89 New Orleans (LA) $1,738,293.96 Nashville (TN) $2,277,269.25 Phoenix (AZ) $6,301,565.92 Salt Lake City ((UT) $1,602,068.39 Seattle (WA) $5,044,081.28 -40% -20% 0% 20% 40% 60% 80% 100% Supply and Population Comparison Table - Australia & N.Z. Versus Selected U.S.Cities Assuming modest rate of $2.6 per week, SQM (commercial storage only and does not include parking). 19 19
  • 20. Market Summary (3) !   The storage market for Sydney metro alone, at modest rate of $2.6 per week SQM, is estimate to be just around $1.7 million per week. !   This is represents commercial storage rental area only and does not include the opportunity of peer to peer residential spaces, work spaces or parking as sought by Spaceble. If we assume 30% additional for this segment, this equates to around $2.2 million per week opportunity !   If we further assume Spaceble attaining 10%, that is $230,000 per week market opportunity for Sydney metro alone. 20 20
  • 21. Competition !   There are no direct competitors to Spaceble.com other than the closest being www.spaceout.com.au but this sites usability is poor, not engaging and fundamentally focus on “storage” rather “space”. !   Summary of competitive differences !   Existing online marketplace are not built with the requirement or understanding of “space” in mind !   They are are place to sell: storage. That’s it. !   They lack discovery. They lack social. They limit opportunity and use current paradigm when looking at storage rather ‘space’. !   We’ve spoken to users selling and seeking space on existing places. They use it because they have to.
  • 22. Product architecture Social connection Search facility Space demand Space Supply Space listings Wanted Listings Communication Trust & Safety Message system, Nickname, privacy notification, suggestion Desktop Mobile 22 22
  • 23. Summary of projections Sydney and Melbourne only Year 1 Year 2 Year 3 Year 4 Year 5 Revenue $29,700 $59,400 $118,800 $237,600 $475,200 Burn $150,000 $150,000 $150,000 $150,000 $150,0000 Headcount 2 2 2 2 2 Customers 6600 13200 26400 52800 105600 Net $-120,300 $-120,300 $-31,200 $87,600 $325,200 Notes 1. Assuming 550 new customers per month on average for Sydney and Melbourne only 2. Assuming $7.5 credit purchases on average 3. Assuming 60% "pay to connect" purchases 4. Assuming double customer growth per year from previous year Burn break up:   Operations   $25,000   Legal   $10,000   Marketing   $65,000   $10,000   Maintenance   Consultants   $10,000   $30,000   Salaries $15K   Total   $150,000   23 23
  • 24. Summary of projections Sydney, Melbourne, New York, Los Angels only   Year 1   Year 2   Year 3   Year 4   Year 5   Revenue   $135,000   $270,000   $540,000   $1,080,000   $2,160,000   Burn   $500,000   $500,000   $500,000   $500,000   $500,000   Headcount   2   2   3   3   4   Customers   30,000   60,000   120,000   240,000   480,000   Net   $-365,000   $-230,000   $40,000   $580,000   $1,660,000   Notes   1. Assuming 2500 new customers per month on average for Sydney, Melbourne, New York, Los Angels only   2. Assuming $7.5 credit purchases on average   3. Assuming 60% "pay to connect" purchases   4. Assuming double customer growth per year from previous year   Burn break up:   Operations   $50,000   Legal   $20,000   Marketing   $340,000   Maintenance   $10,000   Consultants   $20,000   Salaries $15K   $60,000   Total   $500,000   24 24
  • 25. Marketing Considerations !   Target Market/Demographics: Universities and transport hubs !   Distribution and sales channels !   Branding and strategic position !   Media Mix: [Web Ads/Billboards/TV/Radio] !   Marketing and sales team development 25 25
  • 26. Appendix (1) Supply and Population Comparison Table - Australia & N.Z. Versus Selected U.S.Cities (This table has been assembled by Kennards Self Storage using data from Blackwell Consulting and Cushman and Wakefield) 2008/9 City # of Self Storage Facilities Population Total Rentable Area (SQM) Rentable Area Per Person (SQM) Conclusion (1) Australia & NZ Sydney (NSW) 111 3,641,422 494,030m² 0.13 Undersupplied Melbourne (Vic) 119 3,371,888 406,978m² 0.12 Undersupplied Brisbane (QLD) 100 1,676,389 305,162m² 0.18 Undersupplied Perth (WA) 48 1,256,035 152,547m² 0.12 Undersupplied Auckland (NZ) 64 1,303,068 203,513m² 0.16 Undersupplied USA Phoenix (AZ) 555 4,365,443 2,692,978m² 0.61 Equilibrium Seattle (WA) 495 3,388,994 2,365,893m² 0.69 Oversupplied San Diego (CA) 354 3,072,574 1,602,978m² 0.52 Equilibrium Minneapolis (MN) 256 3,318,028 115,4007m² 0.34 Undersupplied San Francisco-Oakland-Fremont, CA 485 4,331,321 2286286.679m² 0.53 Oversupplied Philadelphia-Camden-Wilmington, PA-NJ-DE-MD 434 5,919,740 1927050.225m² 0.33 Undersupplied Minneapolis (MN) 256 3,318,028 115,4007m² 0.34 Undersupplied Tampa (FL) 371 2,808,971 1,645,352m² 0.58 Equilibrium Charlotte (NC) 258 1,687,342 1,120,669m² 0.66 Oversupplied Nashville (TN) 261 1,534,899 1,108,701m² 0.72 Oversupplied Richmond (VA) 118 1,229,109 590,048m² 0.48 Undersupplied New Orleans (LA) 201 1,165,440 868,280m² 0.74 Equilibrium Salt Lake City ((UT) 205 1,100,372 947,971m² 0.86 Oversupplied Honolulu (HI) 48 917,673 209,589m² 0.22 Undersupplied New York (NY-NJ-PA) 899 19,099,625 3828883m² 0.20 Undersupplied Los Angeles (CA) 1075 13,350,826 4867801m² 0.36 Undersupplied Chicago (IL-IN-WI) 671 9,804,475 2949270m² 0.30 Undersupplied 1 . This based on average USA and the Forecast Demand figure is sourced from Cushman & Wakefield (California, USA) conclusion. We can conclude, as estimate, that If "Rental area per person" is greater 0.51 we can consider that storage market as oversupplied, if 0.51 or less we consider that market undersupplied, else equilibrium. This takes only storage perspective not parking. 26 26