Splunk App for Stream for Enhanced Operational Intelligence from Wire Data
- 1. Copyright © 2015 Splunk Inc. The Splunk App for Stream Clayton Ching Sr. Product Manager
- 2. Agenda Introduction to Wire Data The Splunk App for Stream Overview Customer Success Examples Key Features in the Splunk App for Stream Architecture and Deployment FAQ and Summary 2
- 3. Copyright © 2015 Splunk Inc. Introduction to Wire Data
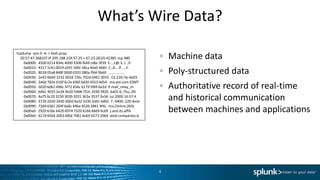
- 4. What’s Wire Data? Machine data Poly-structured data Authoritative record of real-time and historical communication between machines and applications 4 tcpdump -qns 0 -A -r blah.pcap 20:57:47.368107 IP 205.188.159.57.25 > 67.23.28.65.42385: tcp 480 0x0000: 4500 0214 834c 4000 3306 f649 cdbc 9f39 E....L@.3..I...9 0x0010: 4317 1c41 0019 a591 50fe 18ca 9da0 4681 C..A....P.....F. 0x0020: 8018 05a8 848f 0000 0101 080a ffd4 9bb0 ................ 0x0030: 2e43 6bb9 3232 302d 726c 792d 6461 3033 .Ck.220-rly-da03 0x0040: 2e6d 782e 616f 6c2e 636f 6d20 4553 4d54 .mx.aol.com.ESMT 0x0050: 5020 6d61 696c 5f72 656c 6179 5f69 6e2d P.mail_relay_in- 0x0060: 6461 3033 2e34 3b20 5468 752c 2030 3920 da03.4;.Thu,.09. 0x0070: 4a75 6c20 3230 3039 2031 363a 3537 3a34 Jul.2009.16:57:4 0x0080: 3720 2d30 3430 300d 0a32 3230 2d41 6d65 7.-0400..220-Ame 0x0090: 7269 6361 204f 6e6c 696e 6520 2841 4f4c rica.Online.(AOL 0x00a0: 2920 616e 6420 6974 7320 6166 6669 6c69 ).and.its.affili 0x00b0: 6174 6564 2063 6f6d 7061 6e69 6573 2064 ated.companies.d
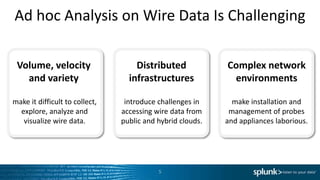
- 5. Ad hoc Analysis on Wire Data Is Challenging Volume, velocity and variety make it difficult to collect, explore, analyze and visualize wire data. Distributed infrastructures introduce challenges in accessing wire data from public and hybrid clouds. Complex network environments make installation and management of probes and appliances laborious. 5
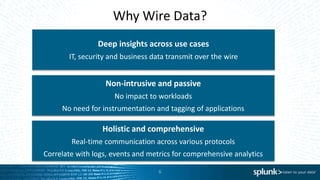
- 6. 6 Why Wire Data? Deep insights across use cases IT, security and business data transmit over the wire Non-intrusive and passive No impact to workloads No need for instrumentation and tagging of applications Holistic and comprehensive Real-time communication across various protocols Correlate with logs, events and metrics for comprehensive analytics
- 7. The Splunk App for Stream Overview
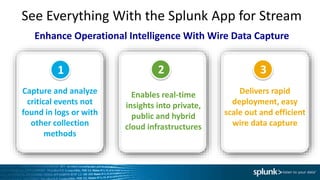
- 8. See Everything With the Splunk App for Stream Enables real-time insights into private, public and hybrid cloud infrastructures Delivers rapid deployment, easy scale out and efficient wire data capture Capture and analyze critical events not found in logs or with other collection methods 1 2 3 Enhance Operational Intelligence With Wire Data Capture
- 9. Examples of What’s Available From the Wire 9 Performance Metrics Round Trip Time Client Request Time Server Reply Time Server Send Time Total Time Taken Base HTML Load Time Page Content Load Time Total Page Load Time Application Data POST Content AJAX Data Section Sub-Section Page Title Session Cookie Proxied IP Address Error Message Business Data Product ID Customer ID Shopping Cart ID Cart Items Cart Values Discounts Order ID Abandoned?
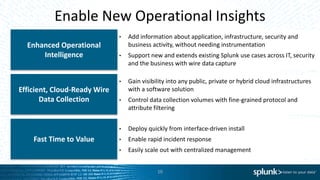
- 10. 10 Enable New Operational Insights • Add information about application, infrastructure, security and business activity, without needing instrumentation • Support new and extends existing Splunk use cases across IT, security and the business with wire data capture Enhanced Operational Intelligence Efficient, Cloud-Ready Wire Data Collection Fast Time to Value • Gain visibility into any public, private or hybrid cloud infrastructures with a software solution • Control data collection volumes with fine-grained protocol and attribute filtering • Deploy quickly from interface-driven install • Enable rapid incident response • Easily scale out with centralized management
- 11. Customer Success
- 12. Stream at CanDeal: Breaking the Silos Kris Laxdal, IT Manager & Security Analyst “You cannot show up with traditional packet captures tool in the boardroom. Stream and Splunk help us understand issues at the high level and if exec team wants to see the details we can drill down easily. That is what's great about Stream!” IT Operations • High level view with contextual drill-down ability • Easy access and visibility into production MySQL environment helps app developers troubleshoot issues and roll out releases quicker • Improved collaboration between teams: IT operations, QA (pre-production testing),security and development • Improved customer response times due to real-time visibility into app issues Security • Correlation against indicators of compromise helps investigate and mitigate APTs, potential data exfiltration & other risks Key Customer Benefits 12
- 13. Applications Visibility for Easy Capacity Planning AVP of Networks and Communications, Large National Bank “I enjoyed using the Splunk App for Stream as it's giving us a bunch of different perspectives on our traffic and better granularity compared to some of the other tools we used.” • Granular application and network visibility drives easy remediation • Proactive applications and network traffic monitoring enables better capacity reporting and planning • Powerful analytical engine enables data analyses by novice users Key Customer Benefits • Quick host-based deployment at critical network segments – Ability to observe both client and server traffic 13
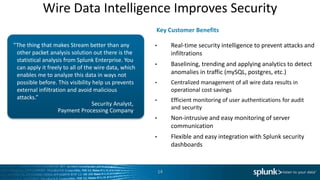
- 14. Wire Data Intelligence Improves Security Security Analyst, Payment Processing Company “The thing that makes Stream better than any other packet analysis solution out there is the statistical analysis from Splunk Enterprise. You can apply it freely to all of the wire data, which enables me to analyze this data in ways not possible before. This visibility help us prevents external infiltration and avoid malicious attacks.” • Real-time security intelligence to prevent attacks and infiltrations • Baselining, trending and applying analytics to detect anomalies in traffic (mySQL, postgres, etc.) • Centralized management of all wire data results in operational cost savings • Efficient monitoring of user authentications for audit and security • Non-intrusive and easy monitoring of server communication • Flexible and easy integration with Splunk security dashboards Key Customer Benefits 14
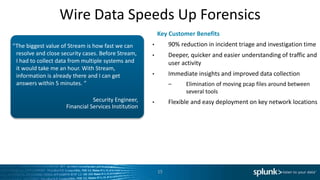
- 15. Wire Data Speeds Up Forensics Security Engineer, Financial Services Institution “The biggest value of Stream is how fast we can resolve and close security cases. Before Stream, I had to collect data from multiple systems and it would take me an hour. With Stream, information is already there and I can get answers within 5 minutes. “ • 90% reduction in incident triage and investigation time • Deeper, quicker and easier understanding of traffic and user activity • Immediate insights and improved data collection – Elimination of moving pcap files around between several tools • Flexible and easy deployment on key network locations Key Customer Benefits 15
- 16. Key Features: Splunk App for Stream 6.2
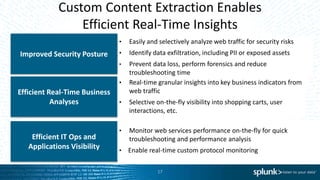
- 17. 17 Custom Content Extraction Enables Efficient Real-Time Insights • Easily and selectively analyze web traffic for security risks • Identify data exfiltration, including PII or exposed assets • Prevent data loss, perform forensics and reduce troubleshooting time Improved Security Posture Efficient Real-Time Business Analyses Efficient IT Ops and Applications Visibility • Real-time granular insights into key business indicators from web traffic • Selective on-the-fly visibility into shopping carts, user interactions, etc. • Monitor web services performance on-the-fly for quick troubleshooting and performance analysis • Enable real-time custom protocol monitoring
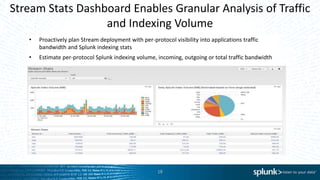
- 18. 18 Stream Stats Dashboard Enables Granular Analysis of Traffic and Indexing Volume • Proactively plan Stream deployment with per-protocol visibility into applications traffic bandwidth and Splunk indexing stats • Estimate per-protocol Splunk indexing volume, incoming, outgoing or total traffic bandwidth
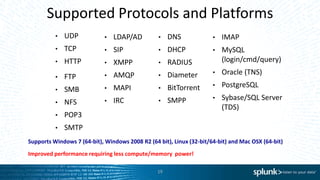
- 19. Supported Protocols and Platforms • UDP • TCP • HTTP • IMAP • MySQL (login/cmd/query) • Oracle (TNS) • PostgreSQL • Sybase/SQL Server (TDS) • FTP • SMB • NFS • POP3 • SMTP • LDAP/AD • SIP • XMPP • AMQP • MAPI • IRC Supports Windows 7 (64-bit), Windows 2008 R2 (64 bit), Linux (32-bit/64-bit) and Mac OSX (64-bit) • DNS • DHCP • RADIUS • Diameter • BitTorrent • SMPP 19 Improved performance requiring less compute/memory power!
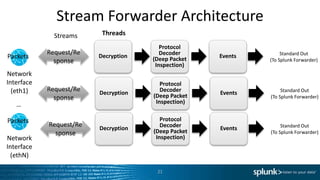
- 21. Stream Forwarder Architecture Protocol Decoder (Deep Packet Inspection) EventsDecryption Request/Re sponse Network Interface (eth1) Standard Out (To Splunk Forwarder) Packets Streams Request/Re sponse Request/Re sponse Protocol Decoder (Deep Packet Inspection) EventsDecryption Standard Out (To Splunk Forwarder) Protocol Decoder (Deep Packet Inspection) EventsDecryption Standard Out (To Splunk Forwarder) Network Interface (ethN) Packets … Threads 21
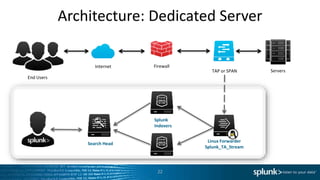
- 22. Architecture: Dedicated Server 22 End Users TAP or SPAN Firewall Splunk Indexers Search Head Linux Forwarder Splunk_TA_Stream Servers Internet
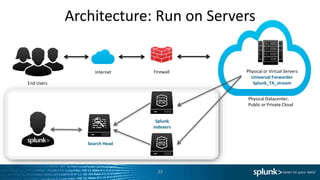
- 23. Architecture: Run on Servers 23 End Users Firewall Splunk Indexers Search Head Physical or Virtual Servers Universal Forwarder Splunk_TA_stream Internet Physical Datacenter, Public or Private Cloud
- 24. Summary
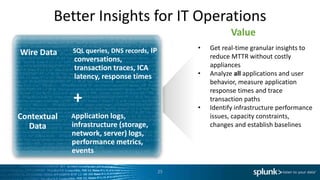
- 25. Better Insights for IT Operations • Get real-time granular insights to reduce MTTR without costly appliances • Analyze all applications and user behavior, measure application response times and trace transaction paths • Identify infrastructure performance issues, capacity constraints, changes and establish baselines Value + Contextual Data Application logs, infrastructure (storage, network, server) logs, performance metrics, events 25 SQL queries, DNS records, IP conversations, transaction traces, ICA latency, response times Wire Data
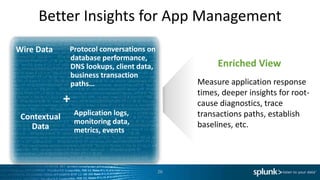
- 26. Better Insights for App Management Protocol conversations on database performance, DNS lookups, client data, business transaction paths… Measure application response times, deeper insights for root- cause diagnostics, trace transactions paths, establish baselines, etc. Enriched View Wire Data + Contextual Data Application logs, monitoring data, metrics, events 26
- 27. Better Insights for Security • Real-time DPI with analytics enables easier forensics analyses and quicker incident response • Analyze user and applications behavior • Respond timely to threats with cost-efficient real-time header and payload field extraction • Baseline network traffic and understand anomalies associated with APTs and insider threats • Quick install at endpoints, on-premises and cloud infrastructures without expensive appliances Value + Contextual Data Firewall logs, application logs, IDS logs, network logs, perf. metrics, events 27 User and application traffic, protocol identification (TCP, DNS, HTTP, etc.), protocol headers & payload extraction, SSL decryption Wire Data
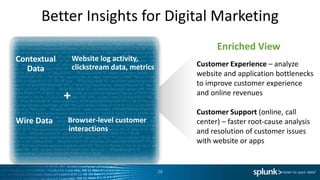
- 28. Better Insights for Digital Marketing Browser-level customer interactions Customer Experience – analyze website and application bottlenecks to improve customer experience and online revenues Customer Support (online, call center) – faster root-cause analysis and resolution of customer issues with website or apps Enriched View Wire Data + Contextual Data Website log activity, clickstream data, metrics 28
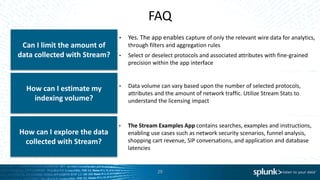
- 29. FAQ • Yes. The app enables capture of only the relevant wire data for analytics, through filters and aggregation rules • Select or deselect protocols and associated attributes with fine-grained precision within the app interface Can I limit the amount of data collected with Stream? • Data volume can vary based upon the number of selected protocols, attributes and the amount of network traffic. Utilize Stream Stats to understand the licensing impact How can I estimate my indexing volume? • The Stream Examples App contains searches, examples and instructions, enabling use cases such as network security scenarios, funnel analysis, shopping cart revenue, SIP conversations, and application and database latencies How can I explore the data collected with Stream? 29
- 30. Enables real-time insights into private, public and hybrid cloud infrastructures Delivers rapid deployment, easy scale out and efficient wire data capture Capture and analyze critical events not found in logs or with other collection methods 1 2 3 30 See Everything with Splunk App for Stream Enhance Operational Intelligence With Wire Data Capture
- 31. Thank You
Editor's Notes
- Please skip the first section “Intro to wire data’ if the customer is familiar with the wire data collection. Typically this section may not needed to be explained for network or security teams.
- If your customer is network engineer or admin or in network security and is familiar with wire data, please feel free to skip this segment
- Wire Data is machine data, recorded as events, that we capture from the network using packet sniffing technology from a host’s network interface for a variety of standard protocols. It is an authoritative record of what is happening with and to your operations in real-time. It is a record of all communication between machines and applications We say that wire data is poly structured since certain protocols are more rigid than others. For example, DNS has little to no variance within the fields/attributes within the protocol while HTTP may have a great degree of variance or additional information within its fields.
- While wire data is a golden source of operational performance information, it is very challenging to deal with. It is high-volume, running to petabytes of raw data a day; it is high-velocity, with 10Gb/s becoming the new standard capacity in datacenters and ever increasing capacity in the cloud; it is high-variety, with a multitude of application protocols and styles of transactions in use. Wire data can also be difficult to get tin a scalable and affordable manner. There are typically many of places (insturment) on the wire within a single data center where valuable application and operational data can be obtained. This easily extends to hundreds of points distributed across a global enterprise. Tap and SPAN ports can be expensive. And in some cases you may not even have the access to this data. Also you need accurate representation of the wire data is required to maximize its operational value. Finally you need to manage all these physical probes. And in some cases in complex network environments, this access can be limited to networking team. Which means often times the data is in silo and teams that need these data such as application owners may not have it readily available as it is within network operations ownership.
- When you capture this wire data, you can get very deep insights across various use cases including transaction payloads, application performance, infrastructure bottlenecks, security vulnerabilities, customer payloads and usage metrics, troubleshooting and analytics. Second, capturing wire data has no impact on workloads as it Is passive and non intrusive and it does not require semantic logging by customer or byte-code instrumentation. Finally it is comprehensive as we get real-time insights into everything where we can correlate it with log data, database, Hadoop and systems data.
- Splunk App for Stream is a free App that enables you to capture, visualize and analyze data in much more granular way then ever before. You can see everything – ALL user and applications behavior ],response times from every layer, DNS information, storage traffic, network traffic, your websites content, connections. Once this data is in Splunk you can correlate it with other data for much more comprehensive visibility. First Splunk App for Stream is a way of get wire data into Splunk Enterprise. By adding this comprehensive source of machine data, it enables you to extend Operational Intelligence use cases across IT security and the business. It is a software only solution with the ability that can be installed on VM on any host, it enables real-time insights into multi-cloud environments. And as such, it is easy to install anywhere on most of standard machines, it is a passive very efficient way to capture data.
- What can you get out of wire data that you don’t already get from other machine data? Many different things as shown here much more than what specific application chose to log. Anything from data that appeal to the admin level user – the things as how long it takes for this page to load or round trip time. Than application owners can get information valuable for them, what are the error messages we are getting from particular application so that they can further investigate the applications issues. Finally, wire data contains information relevent for business users, what are customers buying, are they abandoning carts, where are this purchases coming from. And this is just a small example….there is way more. There is a small amount of overlap between wire data and other data that we’ve captured so far but it requires deeper and more intrusive instrumentation Optional text For example, web server logs typically record status codes such as HTTP 200 response, indicating whether a web page was rendered properly to a client. However, what is missing is transaction payload information – that means, it will not be able to show which of these HTTP 200 responses were for pages with a “service unavailable” message. This information is contained in wire data or transaction payload and is not logged by the server. Can you get this from log data – yes, if you instrument the code. And that is the beauty of wire data – it does not require any instrumentation of the application.
- With this app users can capture application transaction times, transaction paths, network performance, and even database queries. Correlating wire data with other application and infrastructure data in Splunk software such as logs, metrics and events, As a result users are getting insights about app, service or network availability, performance and usage of their services. IT admins can pinpoint root-cause, proactively monitor the performance and availability of their individual technology silos, map dependencies of infrastructure to applications and trend performance to establish baselines. For security, wire data extends itself into rapid incident investigation. more complete threat detection, expanded monitoring and compliance. For business, wire data also captures user interactions and process insights for a deeper understanding of the user experience to support multiple business analytics use cases. The Splunk App for stream enables efficient, cloud-ready wire data collection with a single software solution. This provides real-time visibility into any public, private or hybrid cloud infrastructure through insights from wire data. Additionally, customers can now securely decrypt SSL encrypted data for data completeness. Capture only the relevant wire data for analytics, through filters and aggregation rules. The app provides the ability to control and manage wire data volumes with fine-grained precision by selecting or deselecting protocols and associated attributes within the App interface Lastly, can be rapidly deployed to collect wire data in real time to gain network visibility that is otherwise unavailable from cloud implementations and hard to achieve with traditional datacenters. Now, customers can quickly respond to any issue with a simple interface-driven installation, centralized deployment and configuration across IT environments of all sizes.
- Let me go over Splunk Stream utilization in CanDeal. CanDeal is a Canadian online exchange for Canadian dollar debt securities. They provides their investors access to liquidity for Canadian Government Bonds and money market instruments. Stream is deployed at CanDeal across variety of different use cases – security, IT operations even application development. Their teams can collaborate together at CanDeal – in the past, due to strict restriction to who has access to financial data, developers could not get to production MySQL environment as raw visibility for packet data was something they never had access before. Now security team gives them visibility and they can control and they can access any time without the need to wait which significantly improves turnaround times and visibility into issues. preprod testing can also be quickly done. As a result they have improved collaboration among all different teams. In the past, they spent hours just collecting data, shuttling pcap files which created tremendous lag time. Customer satisfaction: In real time they can detect proxy issues, SSL mismatching, misconfigured routes, [Security]Splunk Stream helps Candeal to get huge value in their security practice. They now able to get indicators of compromise by bringing data from STIX into Splunk (utilizing Splice) and cross-correlate against data they are getting from Stream (HTTP, DNS, etc).Since they have a full user and applications behavior, they are now able to quickly investigate and mitigate ATS, analyze potential data exfiltration and other risks in their environment. In the past it was very hard and time consuming to grab data from various pcap and it was fragmented and further it was not indexed in Splunk. [Executive] They are able to create executive reports and present to executives which they could not do with tools they had in practice in the past.
- In this example, the Stream is deployed in of the large national banks out of Texas. They had acquired branches around the country and in the process integrating them with the hq datacenters. They have several months to do the integration. They are using Stream to better understand the traffic that is going across key links not only within the country but also international. Stream gives them very granular visibilty into any traffic, they can understadn top talkers vs top communicators. They can apply analysis to trigger an alert if the traffic utilization is over specific threshold. And the data is used by new IT personnel. What they are getting from Stream that they cannot get from these other tools Is Splunk analytics behind. With other tools they can get some data but the granularity is not there. And many of the tools don’t look at client perspective. Example: With Stream and Splunk this customer can perform granular analytics they could not do with other tools. “ With other tools I can look at my conversations or all my bytes coming across are, you know, 50 percent of that is, you know, one host, you have thrown a load on that. I can alert when the bandwidth is 85 percent, right? I can do that all day long with other tools But I can't necessarily go look at the traffic and alert on, "Hey, this is I.P. address is taking all the bandwidth. That and much more I can do with Stream”.
- This is a company that has deployed Splunk in financial industry and specifically in SaaS based payment processing. They are deploying Stream to monitor wire data traffic in their internal communication as they can easily detect anomalies in traffic. For example, they are able to look into database traffic mySQL and postgres traffic and detect issues with user authentication and more. They are looking at what type of data is being sent at their SQL and postgres servers. One of the biggest value for them is that they are able to apply Splunk statistical analysis on wire data and normalize the quiries so that they can prevent external infiltration and avoid malicious attacks. Both in real-time and historically, they are able to set baselines in the amount and type of their database communication . By doing that they were able prevent injection of malicious queries, ensuring there were no attacks on their servers. They were able to integrate wire data in existing security dashboards and proactively look for any abnormalities in communication. They are also able to look for unexpected traffic such as IRC communication or look for exposed passwords in the user authentication. Protocols: MySQL, postgres , LDAP, RADIUS, IRC, SMB, FTP.
- This is a customer from one of the banking institutions in US. They have deployed Stream to monitor data on DMZ and on egress at the points where there is visibility across all the traffic. They wanted to simplify the data collection for forensics purposes. They did not want to search multiple tools to get the data they are looking for. The value for Stream is how fast can they resolve and close security cases. They got Stream because they wanted to get to the so called “higher level” data. For example, logs from firewalls offered them a very basic info example such as this user tried to connect to this or that external website or that external user wanted to connect to this resource from the outside. They get IP destination port and that is it. From Stream we are getting better understanding of the traffic. Now they can answer these question: This user from the outside tried to issue an SQL injection. Once they have the IP address from firewall they can search the Stream and they can get the better view of what the user did. [The way they did it before was to get the pcap from the user based on the firewall log IP information. Now they don’t need to go and get the pcap to get into very minor detail. We can just look into Splunk and see that is actually what happened.] They are looking into lots of things from their IDS including alerts and things . SQL injection, exploit attempt, etc. If it is something new, we go and check Stream out for more details. Before Stream one example would be as we would be going into IDS alert and bring that into a pcap and then look at pcap into another tool to see what happened, it would take me an hour. With Stream, if get data, enter source and destination IP the get this instantly. Then they can further determine whether I need to investigate more or not. With Stream it goes down to 5 min which is 90% reduction. It is much easier to get data now. ” For them the ability to look at meta data for HTTP level data, and see the things such as the user agent, the response is valuable and very useful for someone in security domain
- New functionality: Custom Content Extraction Enables extraction, A simple GUI to create and apply rules to extract valuable insights on-the-fly without storgint complete payload or manually parsing the payload data Security: Quickly and easily analyze web traffic for potential security risks with a rules-based GUI extraction –Look for potential data exfiltration, including exposed assets, user credentials such as clear text passwords, or personal identifiable information such as credit card numbers –Prevent data loss, provide easier forensics and reduce troubleshooting times Digital Intelligence: Get real-time granular insights into key business indicators from web traffic payload for efficient business analytics, including marketing and transactional data –Visibility into shopping carts, user interactions, and other important business IT Operations/Applications Visibility: Monitor web services performance through protocols such as SOAP or JSON-RPC by extracting per-API response times or other information from payload data in real time
- Here is the current list of protocols that are supported. We also now support Windows OS and also have improved performance. Here we see currently supported protocols and platforms. Talk with your customers and them if there is any other protocol they find extremely useful that they would like to be added. And also ask them why would need particular protocol to be added.
- And finally, events are generated based on the Stream configuration from “App for Stream” and passed on to the UF as modular input data (streaming standard output) in JSON format.
- We can get wire data directly from the “wire” by installing our wire data collector (the TA) on a dedicated, physical server. This server then receives a passive network copy from a SPAN/(TAP) or packet broker which would transport the “real” wire data of interest to the software.
- Alternatively, the data collector can live directly on the systems of interest as a lightweight agent, where the systems can be either physical or virtual. In both cases the data collectors are actually TAs and therefore need to cohabitate with a forwarder.
- Thank you. Open up for Questions
- So let’s start with IT Operations – You can capture IT relevant data set from network and enrich it with existing data in Splunk such as infrastructure and application logs and events .You capture the content of database queries, granular IP conversations, transaction traces, applications response times. As a result, they will have granular visibility into infrastructure performance, resources utilization, or solve capacity bottlenecks. They can have visibility into applications availability, performance and usage and relation of it to underlying infrastructure components. IT admins can establish better baselines and trending for application performance and usage, and enable better IT and business decision making. This all results in faster resolutions of problems with fewer people.
- With the Splunk App for Stream, customers can now unlock the full potential of their machine data by adding wire data to the Splunk software platform. Correlate application and infrastructure data such as logs, events, metrics with wire data to gain valuable insights into application and infrastructure performance, find the root cause of operational issues, understand transaction paths, resolve system downtime, identify infrastructure relationships, assess security threats and understand customer behavior. Enhance operational intelligence for IT, security and the business with wire data analytics, enabled by Splunk software. The Splunk App for Stream captures wire data from endpoints and key network locations to provide additional insight into how applications are performing, without requiring any instrumentation. Wire data collected by the Splunk App for Stream provides granular data on transaction response times, transaction traces, transaction paths, network performance and even database queries. Wire data effectively complements the kind of metrics often gathered by traditional APM tools, which often focus on specific transaction components. Also, the Splunk App for Stream does not require instrumentation of the application itself, so you can gather performance information across the application without developers instrumenting the application or modifying application logs.
- Stream brings huge benefits for your security practitioners.. It is particularly interesting as you are most likely used to packet sniffing for forensic and real time analysis. Data captured contains all user activity and behavior as well as applications behavior. With Stream security customers can perform deep protocol inspection understanding at a very granular level what is going in. This can be used both in real time to understand risks or to perform response to an incident. In addition, security investigators can observe daily or seasonal traffic patterns so that they can immediately react when these become anomalous– they can respond to insider threats. See when someone is emailing IP out or if someone is trying to mimic the database queries to trying to gain access to your internal databases. Stream extracts both header and payload information for very deep granular insights for incident response and threat prevention. It is very important to mention that it can be deployed anywhere into end points, without you need to buy having to by expensive appliances. Very important when customer is a breach conditions. Backup Protocol header and data decoding: HTTP, DNS and email protocols (e.g. IMAP, POP3 and SMTP) are the dominant attack and exfiltration vectors for some of the most damaging breaches. Streams can be deployed to acquire header information (HTTP and email) and payload information (DNS) to drive sophisticated analytics for threat detection, incident response, intelligence gathering and threat prevention. Rapid deployment and response: When incident investigation or analysis or tracking down malware requires additional real-time information from network traffic, threat responders can leverage Stream’s simple and rapid deployment via Splunk to start getting wire data from the system of interest to Splunk. This is useful under breach conditions – where a known infiltration may be in progress.
- Customer Experience & Digital Analytics: The Splunk App for Stream allows organizations to capture all web interactions for a deeper understanding of user experience, to improve customer satisfaction, prevent drop-offs, improve conversions and boost online revenues. Wire data provides insights into key metrics such as time spent on page, bounce rates, time on site, navigation paths, product performance etc., without the need to tag individual pages. This is especially valuable to ensure the success of marketing campaigns. Business Process Analytics: Business processes such as order management in retail, provisioning in telecoms, trade execution in financial services etc. span many different applications. Collecting relevant data across applications and correlating it is critical for end-to-end process visibility. Wire data implicitly has this information, without requiring specific instrumentation. With the Splunk App for Stream, business operations teams can easily access this data and use Splunk Enterprise to gain real-time business insights across the complete process.
- FaQ: The first, Explosion in the data volume We have built in filters and aggregation rules in the app so that our customers can fine tune data gathering Indexing volume can vary depending on the enabled protocols and uses and the amount of network traffic. To address that, our customers should try out the app on smaller environments and understand the usage types and what kind of data is useful to them. OK. We got that one sorted out. But hey, it is still lots of data. How will I know what is useful to me.As part of the App, we built the Stream Examples App which contains prebuilt sets of sample searches that will portray several scenarios. This includes, security scenario, shopping cart, application latencies. And as customers start using the app, we will add more.
- \
- Thank you. Open up for Questions

