Splunk for IT Operations
- 2. 2 Session Agenda • Splunk for ITOps - Introduction • Splunk Apps • Introducing Splunk IT Service Intelligence • Customer Stories • Wrap Up
- 3. Splunk for ITOps - Intro
- 4. 4 Escalating IT Complexity… SERVERS STORAGE NETWORKING VITUALIZATION INFRASTRUCTURE APPLICATIONS PACKAGED APPLICATIONS CUSTOM APPLICATIONS Identity VPN IP Phone HR Email Finance App Svr DB Web Svr SaaS/PaaS IaaS
- 5. 5 … Plaguing IT Operations SERVERS STORAGE NETWORKING VITUALIZATION INFRASTRUCTURE APPLICATIONS PACKAGED APPLICATIONS CUSTOM APPLICATIONS Identity VPN IP Phone HR Email Finance App Svr DB Web Svr SaaS/PaaS IaaS Complex, silo-based technologies Disconnected and outdated point solutions Reactive brute-force problem resolution Over 80% of time on maintaining not innovating
- 6. 6 Industry Leading Platform for Machine Data Any Machine Data Online Services Web Services Servers Security GPS Location Storage Desktops Networks Packaged Applications Custom ApplicationsMessaging Telecoms Online Shopping Cart Web Clickstreams Databases Energy Meters Call Detail Records Smartphones and Devices RFID Datacenter Private Cloud Public Cloud Enterprise Scalability Search and Investigation Proactive Monitoring Operational Visibility Real-time Business Insights Operational Intelligence
- 7. 7 Industry Leading Platform for Machine Data Any Machine Data Online Services Web Services Servers Security GPS Location Storage Desktops Networks Packaged Applications Custom ApplicationsMessaging Telecoms Online Shopping Cart Web Clickstreams Databases Energy Meters Call Detail Records Smartphones and Devices RFID Datacenter Private Cloud Public Cloud Enterprise Scalability Search and Investigation Proactive Monitoring Operational Visibility Real-time Business Insights Operational Intelligence Any amount, any location, any source Schema- on-the-fly Universal indexing No back-end RDBMS No need to filter data
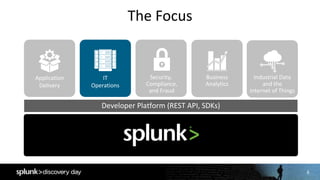
- 8. 8 Developer Platform (REST API, SDKs) The Focus Application Delivery IT Operations Security, Compliance, and Fraud Business Analytics Industrial Data and the Internet of Things
- 9. 9 Turning Machine Data Into Operational Intelligence Reactive Search and Investigate Proactive Monitoring and Alerting Operational Visibility Proactive Real-time Business Insight
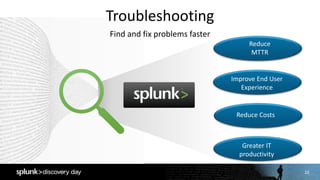
- 10. 10 Troubleshooting Find and fix problems faster Reduce MTTR Improve End User Experience Reduce Costs Greater IT productivity
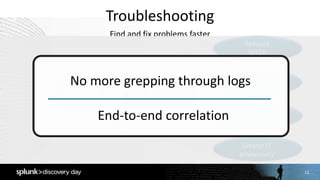
- 11. 11 Troubleshooting Find and fix problems faster Reduced MTTR Improve End User Experience Reduce Costs Greater IT productivity No more grepping through logs End-to-end correlation
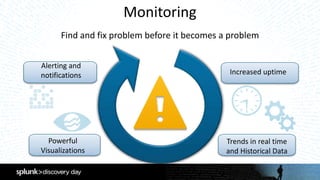
- 12. Monitoring Find and fix problem before it becomes a problem Increased uptime Trends in real time and Historical Data Powerful Visualizations Alerting and notifications
- 13. Copyright © 2016 Splunk Inc. Splunk Apps Accelerate Insights
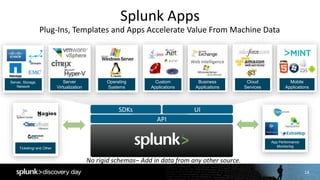
- 14. 14 Splunk Apps Plug-Ins, Templates and Apps Accelerate Value From Machine Data No rigid schemas– Add in data from any other source. API SDKs UI Server, Storage, Network Server Virtualization Operating Systems Custom Applications Business Applications Cloud Services App Performance Monitoring Ticketing/ and Other Web Intelligence Mobile Applications Stream
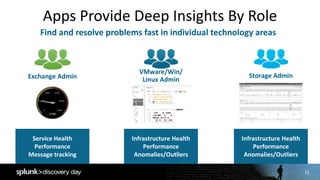
- 15. 15 Apps Provide Deep Insights By Role Find and resolve problems fast in individual technology areas Exchange Admin Service Health Performance Message tracking VMware/Win/ Linux Admin Infrastructure Health Performance Anomalies/Outliers Storage Admin Infrastructure Health Performance Anomalies/Outliers
- 16. Copyright © 2016 Splunk Inc. Splunk IT Service Intelligence
- 17. What We Hear From Our Customers! “My CIO is demanding we look at IT from a business service perspective.” “Splunk is great for break-fix, but I need to show we’re meeting SLAs.” “I need everyone to be able to see the same thing at the same time.” “I just want to throw data at Splunk and have it find problems for me.” “Show me what my data can do for me!”
- 18. Data-driven service insights for root-cause isolation and improved service operations INTRODUCING
- 19. 19 Splunk IT Service Intelligence
- 20. Copyright © 2016 Splunk Inc. Key Concepts
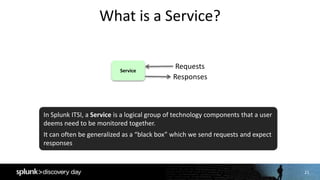
- 21. 21 What is a Service? Service Requests Responses In Splunk ITSI, a Service is a logical group of technology components that a user deems need to be monitored together. It can often be generalized as a “black box” which we send requests and expect responses
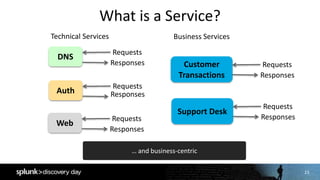
- 22. 22 What is a Service? DNS Requests Responses Technical Services Auth Requests Responses Web Requests Responses Services can be technology-centric…
- 23. 23 What is a Service? DNS Requests Responses Technical Services Customer Transactions Requests Responses Business Services Auth Requests Responses Web Requests Responses Support Desk Requests Responses … and business-centric
- 24. 24 What is a Service? Packet Network Hypervisor and Hosts RBMDBs Storage Tier API Services Web Services CustomerTransactions Mobile API/Middleware PartnerPortal DNS Services can encompass multiple tiers of the IT domain and may also depend upon other services/micro-services
- 25. 25 What is a KPI? DNS Requests Responses KPI: Number of requests KPI: Error rate KPI: Average response time KPI: Servicer CPU load KPI: Server network I/F errors Customer Transactions Requests Responses KPI: Number of transactions KPI: Error rate KPI: Average response time KPI: Count of Incident Tickets KPI: Synthetic Transx Health KPIs and Health scores constitute the means by which Services are monitored.
- 26. 26 Key Performance Indicators (KPIs) 26 KPI: A Splunk saved search defined in Splunk ITSI that helps monitor a specific field like CPU, Memory and so on. KPIs are contained within Services.
- 27. 27 Service Health Scores 27 A Health score is a score from 0-100 that helps determine the health of a Service. It is calculated based on all KPIs importance and its status once every minute.
- 28. Copyright © 2016 Splunk Inc. Capabilities & Features
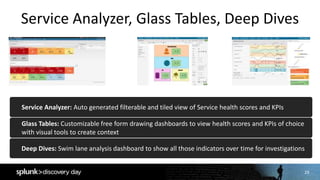
- 29. 29 Service Analyzer, Glass Tables, Deep Dives 29 Service Analyzer: Auto generated filterable and tiled view of Service health scores and KPIs Glass Tables: Customizable free form drawing dashboards to view health scores and KPIs of choice with visual tools to create context Deep Dives: Swim lane analysis dashboard to show all those indicators over time for investigations
- 30. 30 Multi KPI Alerts, Notable Events 30 Multi KPI Alerts: Correlation searches on service degradation Notable Events: Event framework for Multi KPI Alerts
- 31. ITSI Demo
- 32. 32 What Makes Splunk ITSI Different! Search-BasedKPIs • Easy to write, manage and change both services and KPIs • Reflects business and technology priorities • Benefit: Rapidly generate and change KPIs to align service health with business • Fiserv – 1000s in just weeks FullFidelityServiceHealth • Adaptable and flexible definitions of service health • One solution to go seamlessly from service reports to root cause, including raw data • Remains adaptable and yet still maintains complete historical context UniversalDataPlatform • Data driven: All IT data including events, metrics and logs • Schema on-the-Fly • Ask any question of the data • Fast time to value • Data fidelity
- 33. Copyright © 2016 Splunk Inc. Customers Leading The Way
- 34. 34 Why Enterprises Use Splunk for IT Operations Increased Uptime to 99.9% Availability Reduced MTTR from 2-3 days to few minutes Improved Margins by protecting millions in ad-revenue Consolidated Tools by retiring 27 monitoring solutions Optimized Capacity by saving $500K in SW, HW & licenses Drives Innovation with usage analytics on product features
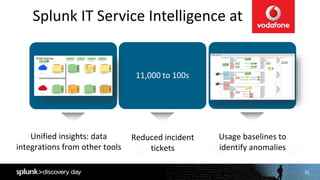
- 35. 35 Splunk IT Service Intelligence at Unified insights: data integrations from other tools 11,000 to 100s Reduced incident tickets Alerting on service KPI’s instead of server performance Usage baselines to identify anomalies
- 36. 36 Splunk IT Service Intelligence at Server-based to Services-based monitoring Top-down and deep- dive service insights 200+ services and 1500+ KPIs monitored Flexible creation and modification of services and KPIs Alerting on service KPIs instead of server performance Real-time, holistic and proactive “client” view
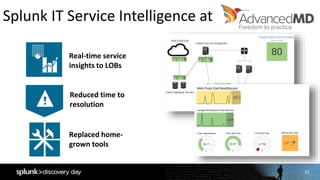
- 37. 37 Splunk IT Service Intelligence at Replaced home- grown tools Real-time service insights to LOBs Reduced time to resolution
- 38. Copyright © 2016 Splunk Inc. Wrap Up
- 39. Troubleshooting Continuous Deployment Application Management Service Monitoring Splunk is the Backbone of Modern IT Platform for Machine Data
- 40. 40 AVAILABLE NOW! Try it: SPLUNK.COM/ITSI Free. In Splunk Cloud.
- 41. Thank you
Editor's Notes
- There has been an explosion of growth of IT data center technologies, IoT mobile, distributed apps, virtualization. What this brought is increased efficiency and utilization, however at the same time there was escalating IT complexity. <click>
- Lots of disparate and complex and siloed based solutions If you need to find a solution to a problem you maybe need to get a war room ready, finger pointing and trying to debug an issue in production environment. You maybe using hours and hours trying to find a solution. Often times it is a brute force approach when you need to restart the system, so brute-force approach is something used. So IT is no longer spending time on innovating but losing valuable time on keeping the the lights on or fighting fires.
- Splunk Enterprise is fully featured, platform for collecting, searching, monitoring and analyzing machine data and getting operational intelligence. You can monitor both real-time (as the data is streaming) and historical data. Splunk collects machine data securely and reliably from wherever it’s generated in any formant. It stores and indexes the data in real time in a centralized location and protects it with role-based access controls. You can troubleshoot your network problems and investigate security incidents in minutes (not hours or days). Monitor your end-to-end infrastructure to avoid service degradation or outages. Gain real-time visibility and critical insights into customer experience, transactions and behavior.
- <click>We don’t require you to understand your data and have predefined schema and requirements. You don’t need to have expensive custom connecters to get data into Splunk. We have our own map reduced based high speed data index and retrieval mechanism. We can index the data from any part of your infrastructure. We scale from a single server to petabytes of data and you can use commodity x86 hardware. And you can store data in the cloud as well if you don’t want to manage your Splunk instance. So what you can start getting into the core of the problem, If you have a system that does not have proactive capabilities you can do that with Splunk Enterprise. And expand from there into security, capacity planning applications management – truly big gold mine of use cases from your data. And our customers once they start to gain that operational visibility they evolve to getting deeper insights from your data. No database in the backend as we apply schema on the fly. You need raw data to be able to re-use it. We are creating intelligence on top of the data therefore easy scaling.
- Most companies start using Splunk in one of these 5 areas, and typically as more teams use Splunk it traverses each of these 5 areas. Both IT and business professionals can analyze machine data to get real-time visibility and operational intelligence. With our platform for machine data, organizations can meaningfully improve their performance in a wide range of areas e.g. meet service levels, reduce costs, mitigate security risks, maintain compliance and gain insights. Today we are going to focus on some of the major use cases and values related to the IT Operations space.
- In IT Operations, this maturity model is a great template/mainstay when it comes to how Splunk is utilized. Most teams have downloaded Splunk on a laptop and from there it gets scaled to a server and to multiple server, etc. The idea from an ITOps maturity model is very much the same— Search and investigation. Using Splunk, organizations identify and resolve issues up to 70% faster and reduce costly escalations by up to 90%. Splunk is one place to find and fix problems, and investigate incidents across all your IT systems and infrastructure. Proactive monitoring. Monitor IT systems in real time to identify issues, problems and attacks before they impact your customers, services and revenue. Splunk keeps watch of specific patterns, trends and thresholds in your machine data so you don't have to. Trigger notifications in real-time via email or RSS, execute a script to take remedial actions, send an SNMP trap to your system management console or generate a service desk ticket. Operational visibility. See the whole picture, track performance and make better decisions. Visualize usage trends to better plan for capacity; spot SLA infractions, track how you are being measured by the business. Do all of this using your existing machine data without spending millions of dollars instrumenting your IT infrastructure. Real-time business insight. Make better-informed business decisions by understanding trends, patterns and gaining Operational Intelligence from your machine data. See the success of new online services by channel or demographic, reconcile 3rd-party service provider fees against actual use, find your heaviest users and heaviest abusers, and more. Because machine data captures every behavior, the possibilities are game changing. You'll find the lead times to get to this intelligence dramatically less than other solutions - measured in minutes/hours instead of months. Who is at Search and Investigate? Raise your Hands. Proactive Monitoring and Alerting? Raise your Hands. Operational Visibility? Raise your Hands. Real-time Business Insight? Raise your Hands. Who thinks it makes sense for all of us to have our business at Real-time Business Insight? Why? So how do we get there?
- Reduce MTTR Correlate data from all levels/layers of the stack Time series Flexible search and drill down No more grepping through logs
- Reduce MTTR Correlate data from all levels/layers of the stack Time series Flexible search and drill down No more grepping through logs
- Increase uptime See trends of realtime data and historical data Powerful visualizations Alerting
- Let’s take a look. [INTRODUCE DEMO PRESENTER] [HAND OFF AV TO DEMO MACHINE FEED]
- Over the last couple of years Splunk has evolved from an engine for machine data to a platform for machine data – nothing is a testimony of this more than our Apps store apps which range from plugins and templates to full fledged apps that help you collect, analyze and harness data from every layer of your technology stack. These apps are built by our customers, technology partners such as Cisco, NetApp, or others and Splunk employees. We are a platform as it is very easy to get data into Splunk and out of Splunk. We are complementing other solutions in the data center Two important things to remember: If a logo you have doesn't show up here, Splunk still doesn't’t limit you – you can always index data from that technology – Splunk extensions simply help you accelerate the process. We provide a full featured REST API and a variety of SDKs that help you build your own custom apps for technologies and insights custom to your business. This is to help you create a specific interface to your data in special format and development languages your team is used to. Lastly, each of the Splunk extensions is not comparable to point solutions in every silo, simply because your data from each silo is more valuable when in context of other data from other technology tiers. Splunk apps simply help you get to the point faster where you can see correlations and comparisons of machine data ACROSS silos. We also recently introduced the 2 new offerings – one to collect wire data, with the Splunk App for Stream (stemming from the acquisition of Cloudmeter) and MINT (Mobile Intelligence) that stems from our acquisition of Bugsense. The Splunk App for Stream enables the capture of real-time streaming wire data, which is the data transmitted between applications over the network. It enables visibility into application, business and user activity without the need for instrumentation, enhancing various operational use cases across IT, security and the business. And Splunk MINT helps you gain visibility into mobile app performance and quality, so you can deliver better mobile apps Splunk MINT helps you combine and correlate mobile app data with other data in Splunk so you can pinpoint problems faster and analyze user experience/behavior across mobile, desktop and web channels. The main value from the apps is providing context for data from silos and making it available inside Splunk for correlation with other data from other silos. In addition to prebuilt apps, customers can also build their own. What have developers been building using Splunk Enterprise? Examples include the following: Run searches and retrieve Splunk data from existing Customer Service/Call Center applications (Comcast use case) Integrate Splunk data into existing BI tools and dashboard (Tableau, MS Excel) Build mobile applications with KPI dashboards and alerts powered by Splunk (Otto Group use case) Log directly to Splunk from remote devices (Bosch use cases) Build customer-facing dashboards powered by user-specific data in Splunk (Socialize, Hurricane Labs use cases) Programmatically extract data from Splunk for long-term data warehousing We hope this is just the beginning. We hope to open up a whole new world of enterprise apps.
- With Apps, you can accelerate insights into specific issue or a problem area. For example if you are focusing on Exchange, you want to understand what is the service health are messages going through, do I have any security issues. If you are a Virtualization or storage admin, you want to understand what is going on with your infrastructure, Am I forecasting proper resources for capacity growth? How are my applications affected by storage latency? Do I have enough storage capacity? Our Apps can provide you with these insights since we have visibility into specific siloes.
- Let’s take a look at deeper dive.
- Splunk is a scalable platform for machine data, that allows you to interact with the data to solve various use-cases. Initially we were founded one enabling IT administrators to solve IT challenges but over the years we’ve manifested this into various other use cases including Application Management, Security and Compliance (the top 3 being our core use-cases) and the evolving use cases are around Business Analytics and IoT, all of which has been led by our customers. As our customers grow their asks from Splunk also began to evolve. They were looking for an integrated holistic packaged solution that will not only help them break-down silos, but apply machine learning to enable their IT practitioners to help arm them with the right data at the right time. They want to exploit the data they have within Splunk to discover new ways to improve their operations and drive business priorities and growth. Our customers wanted to up-level the insight machine data gave them. Not only did they want to immediately address the operational problems but also wanted visibility into whether they are meeting SLA’s, what impact performance is having to the business.
- That brings us to Splunk IT Service Intelligence – a packaged solution that enables real-time visibility into services driven by machine data. Splunk ITSI speeds and simplifies service monitoring and analytics and enables IT to make better, smarter and informed business decisions. This solution allows you to gain a deep understanding of your services. With Splunk ITSI, you have real-time views into the health of your services, and can use advanced analytics to find patterns, detect anomalies and trends to proactively monitor and address issues. As a result you have improved service visibility, reduced resolution times, and a transformative approach to monitoring and analytics driven by machine-data.
- The foundation principles of Splunk ITSI was to leverage the power of our platform and maximize the value you can get from not only the machine data indexed but also from all the flexibility and fast time to value we’ve already proven that we can deliver on. Our platform and Splunk ITSI can scale to index terabytes of data (in the Cloud and On-premise) and it does not require months of implementation. Additionally, the solution is flexible – you can customize your insights on-the-fly and on-demand. As your IT and business needs evolve you can customize your views in Splunk ITSI to gain real-time insights into these new performance and business indicators/needs. The ability to interact with the data on-the-fly without costly customizations is a huge plus. Secondly, we wanted to surface the analytics capabilities to enable machine-data driven monitoring. The solution uses machine learning to detect anomalies, identify baselines and have the system dynamically adapt thresholds. You can proactively notify events thru pre-defined cross KPI correlations and there’s more. Essentially, we’re transforming the approach to monitoring with analytics driven by machine data. Lastly, and very much to the response of our customers, we wanted to redefine the role of IT as being strategic to the business. For the longest time, there has been a persisting need for IT to align with the business. With Splunk ITSI, we enable both IT and the business stakeholders of various services to gain real-time insights into critical performance indicators, in a way that makes most sense to them. With ITSI, we’re fast tracking how you get insights into your services and key performance indicators, whether that insight is focused on individual technology silos or services, micro-services, applications or business processes using a platform you already love.
- A services can literally be sources of data a customer wants to group together to monitor in a single healthscore or just wants to logically group together because they need to be managed by a specific team or needs to be reported in such a way. Services derive their value when KPIs are defined within them or dependencies are defined to other services. Therefore you could have a more abstractly defined service which only depends on other services to derive its own health. E.g. Partner portal is a conceptual service which depends on the API service which in turn has its own KPIs but depends on Web Services. Alternatively you could have Partner portal depend on each and every one in blue, or not even have all the ones in blue and have all the Kpis be inside Partner portal. Everything you see in the diagram above could be a service in ITSI.
- A services can literally be sources of data a customer wants to group together to monitor in a single healthscore or just wants to logically group together because they need to be managed by a specific team or needs to be reported in such a way. Services derive their value when KPIs are defined within them or dependencies are defined to other services. Therefore you could have a more abstractly defined service which only depends on other services to derive its own health. E.g. Partner portal is a conceptual service which depends on the API service which in turn has its own KPIs but depends on Web Services. Alternatively you could have Partner portal depend on each and every one in blue, or not even have all the ones in blue and have all the Kpis be inside Partner portal. Everything you see in the diagram above could be a service in ITSI.
- A services can literally be sources of data a customer wants to group together to monitor in a single healthscore or just wants to logically group together because they need to be managed by a specific team or needs to be reported in such a way. Services derive their value when KPIs are defined within them or dependencies are defined to other services. Therefore you could have a more abstractly defined service which only depends on other services to derive its own health. E.g. Partner portal is a conceptual service which depends on the API service which in turn has its own KPIs but depends on Web Services. Alternatively you could have Partner portal depend on each and every one in blue, or not even have all the ones in blue and have all the Kpis be inside Partner portal. Everything you see in the diagram above could be a service in ITSI.
- A services can literally be sources of data a customer wants to group together to monitor in a single healthscore or just wants to logically group together because they need to be managed by a specific team or needs to be reported in such a way. Services derive their value when KPIs are defined within them or dependencies are defined to other services. Therefore you could have a more abstractly defined service which only depends on other services to derive its own health. E.g. Partner portal is a conceptual service which depends on the API service which in turn has its own KPIs but depends on Web Services. Alternatively you could have Partner portal depend on each and every one in blue, or not even have all the ones in blue and have all the Kpis be inside Partner portal. Everything you see in the diagram above could be a service in ITSI.
- A services can literally be sources of data a customer wants to group together to monitor in a single healthscore or just wants to logically group together because they need to be managed by a specific team or needs to be reported in such a way. Services derive their value when KPIs are defined within them or dependencies are defined to other services. Therefore you could have a more abstractly defined service which only depends on other services to derive its own health. E.g. Partner portal is a conceptual service which depends on the API service which in turn has its own KPIs but depends on Web Services. Alternatively you could have Partner portal depend on each and every one in blue, or not even have all the ones in blue and have all the Kpis be inside Partner portal. Everything you see in the diagram above could be a service in ITSI.
- KPIs are created by the user and the user has to define which Splunk field to monitor, what stat operations to use (e.g. avg cpu, max cpu etc.), what the thresholds for good bad ugly should be, what the frequency of monitoring that field should be and how important it is towards the health of the service. Images: KPIs on the left, health scores on the right.
- KPIs are created by the user and the user has to define which Splunk field to monitor, what stat operations to use (e.g. avg cpu, max cpu etc.), what the thresholds for good bad ugly should be, what the frequency of monitoring that field should be and how important it is towards the health of the service. Images: KPIs on the left, health scores on the right.
- These are the 4 main dashboards that are in ITSI, SA is for the quick view and quick filtering to see only the Services and KPIs of choice, Glass table is for those who want to represent their own workflow and want to take the time to make things look pretty. Deep Dive is for the investigative work when things go wrong, Multi KPI alerts is to build alerts for when there is a desire to be alerted by email or just view the notable event review dashboard (like Incident review in ES).
- Think ES when talking about notable events. They are nearly identical to ES notable events other than the fact that they are some other fields like Service and the actions you can perform on them are a little different. Like going to Deep Dive or creating ticket in service now. The correlation searches that create these notable events can be designed through the correlation search interface like in ES, or through the Multi KPI alert UI. They are stored in the notable events summary index.
- Available on HOD
- What makes Splunk ITSI different is not only all the cool visualizations that you just saw in the premium solution, but more importantly, the platform that it was built on top of. Just about every CIO or Ops Executive we talk to is frustrated with Manual Integration within and across tools and Correlation issues with their current Service Management and Monitoring Solutions. The number of tools they’ve had to buy, deploy, administer, and attempt to integrate just don’t live up to their original promises. An impact of this lack of integration and correlation is the customer’s difficulty meeting or accurately measuring their SLAs. One way that Splunk differs from existing approaches is that it is a Universal Machine Data Platform which allows you to reliably collect, index, prepare and store data from tens of thousands of sources, in real time -- any type, any format, any location with no pre-defined schema. We are data driven. We take in all the data. Splunk is also in network latent real time and can leverage historical data as well. To avoid the problems associated with adding or changing Alerts, Splunk delivers Schema on the Fly to provide for rapid creation of alerts from either KPIs or raw data to adapt to business needs quickly. Splunk applies structure at search time, making it easy to search, visualize and analyze your data without any knowledge of the underlying structure. No DBA is required! We also use machine learning to baseline normal operations, detect anomalous behavior to drive meaningful actions, and enable highly correlated searches to create meaningful “alerts” off your KPIs, not ours. And, you get the information from the data that you need when you need it. With Splunk, you can ask any question of the data any time! Splunk’s powerful platform helps you to realize faster time to value as it leverages all of the data, allows you to answer any questions of the data and empowers the greatest data fidelity With existing Event Driven solutions, our customers tell us that getting true Service Intelligence is a challenge. Today, Service Owners tell us that they determine Service Health through summarized events that have limited retention time. The business impact here surrounds the time and expense in identifying root cause and fixing the problem To address this, Splunk ITSI delivers a 360 degree view of service health from one place. We call this Full Fidelity Service Health. We allow for adaptable and flexible definitions of service health. Customers can now move seamlessly from Business Service Reports to Remediation, all while providing complete historical context. Our solution remains adaptable and yet still maintains complete historical context. Want to visualize and measure what was happening 10 minutes ago?… an hour ago?… Not a problem. This unique differentiation enables Splunk ITSI to deliver a seamless, connected experience from reporting through to remediation. The ability to leverage Deep Dive Incident Reviews, delivers event, metrics and KPIs – including ad hoc, on the fly searches – you can see and correlate complex interactions easily. And like we just discussed, with full access to historical data, you can compare any two time ranges for all data sets side by side to quickly understand what’s ‘normal’ for that Service by minute, hour, day or week regardless of size or scale. Every day we hear from customers that change is a constant and the Legacy Service Management solutions struggle with keeping up. With Legacy Solutions, Service Definitions come from Legacy CMDBs that come with questionable data quality. We also hear that it is hard to create new KPIs to keep everything relevant to the Business. The impact that we hear from Service Owners is that the business perceives IT as being inefficient. So what else does Splunk ITSI do here that is different? Search Based KPIs deliver a flexible way to impose schema only at retrieval, without a pre-defined schema or hard coded collectors. Often the business may need to see new KPIs or change existing ones. You can easily write, manage and change both services and KPIs so that you can best align business and technology priorities. An example of this in action comes from one of our Beta customers, Fiserve. With Splunk ITSI, Fiserve was able to generate 1000s of KPIs in a manner of weeks. They were able to easily write, manage and change both services and KPIs. Splunk runs on-prem, in the Cloud or in hybrid environments while collecting data from all the newest technologies. Our visualizations and analytics are one-of-a-kind. They can be personalized, meaningful, and contextual. Better visualizations and analytics provide and enable IT with actionable insights. Every one can look at the data in the manner that is most relevant to them.
- We have many. And now More than 9000 enterprises, government agencies, universities and service providers in 100 countries use Splunk software to deepen business and customer understanding
- Here we see the benefits customers are getting from Splunk they presented their use cases at recent Splunk Lives Quest Diagnostics – within one hour time there are processing one million of dollars worth of revenue. In their web facing application they were reliant on manual Perl and Unix information to actually look at that data. After they introduced Splunk Enterprise, they were able to monitor that data from applications availability and infrastructure and increased up time to 99.9% Safeway they have many monitoring tools in their environment. They use Splunk as a centralized platform to monitor that data. They saved huge amount of money by consolidating their monitoring tools and retiring 27 tools and Splunk is deployed as centralized monitor across their data. DirectTV: They Introduced NFL streaming service (2011) . They did not realize the impact on the infrastructure. They ended up spending ~150k to beef up the servers and that still did not help. Post Splunk they were able to improve their margins because now they were able to dynamically adapt their infrastructure to the service they are offering.
- Vodafone is the world’s second largest telecommunications company and provides voice, messaging, data, and fixed communications to over 400 million customers. Vodafone’s offshore IT operations team lacked visibility into the health and performance of the services that were getting rolled out constantly by the project teams, designers and architects in Germany. For example, Vodafone recently rolled out Identity Access Manager, a complex Oracle & WebLogic stack‐based application that governs identity management for Vodafone. Vodafone, an existing Splunk customer, now relies on Splunk IT Service Intelligence to provide its offshore team with the insights they need to support, troubleshoot and monitor services, in real-time. Splunk IT Service Intelligence is integrated with HP Business Service Management and the team can now use the KPIs in IT Service Intelligence to see trends and detect patterns and anomalies, enabling them to act upon that data proactively. With data from Vodafone’s Remedy systems the operations team can also easily see various KPIs including number of open tickets, the status of these tickets and number of impacted users. With Splunk IT Service Intelligence, Vodafone is able to gain end-to-end visibility of the performance and behavior of their IT services, allowing them to improve the performance and uptime of critical services and reducing the number of incident tickets opened every day from over 11,000 to hundreds, improving customer satisfaction and reducing support costs. “Splunk IT Service Intelligence gives Vodafone a real-time understanding of how our services are performing overall and at the more granular level," said Oliver Hoppe, solutions architect, Vodafone. "We have KPIs mapped to critical service components and can provide relevant insights to stakeholders across the business, including management, service owners and the security team. The glass table visualizations in Splunk ITSI make it quick and easy to identify and resolve any issues, preventing any impact on our users. Now we can be much more proactive about our services.
- Fiserv is a global financial services technology provider behind essential services such as mobile and online banking, payments, risk management, data analytics and core account processing - more than 1 in 3 U.S. financial institutions rely on Fiserv for core processing services. Lacking a consistent monitoring approach and frustrated with too many tools, Fiserv initially deployed Splunk Enterprise to deploy Splunk to collect and process data that can feed into existing incident management process. While Splunk Enterprise was supporting faster troubleshooting and issue resolutions, Fiserv needed a way to quickly react to changing environment conditions to alert and prevent reoccurring events BEFORE they happened. The team was struggling to build Splunk dashboards that surfaced the right information and led to decisive action. Fiserv also needed to perform continual education across business units, across support tiers and across shifts on the latest dashboards that looks for specific client impacting conditions. The team had a mandate to achieve these goals in just 90 days. Enter Splunk IT Service Intelligence – with Splunk ITSI, Fiserv was able to: Deliver service based monitoring in a much shorter time frame Empower a tier 1 user with a tool kit to triage and act as a higher tier Develop model out of a problem review to add new KPIs to roll into the service as a hole. Easily correlate issues through a drill down and determine cause vs effect and then dive right into the logs Fiserv leveraged Splunk IT Service Intelligence to enhance their service-based monitoring and empower their users. With Splunk IT Service Intelligence, the Fiserv team is able to collect and process data from multiple sources and locations and integrate that data into an existing incident management process. …all within 90 days from inception to delivery.
- AdvancedMD is a leading provider of cloud-based, software solutions for independent physician practices. As a critical part of their business, AdvancedMD must closely monitor the delivery of its services to up to 15,000 users who log into its systems daily. The firm’s IT staff must make sure that applications are always available and the supporting infrastructure is not overtaxed and can meet demand. Existing monitoring tools could not provide an end-to-end view of the services they needed to maintain, particularly their claims service. AdvancedMD has thousands of daily global users who initiate claims, and they’re using Splunk IT Service Intelligence to monitor the end-to-end health of their claims service, which spans multiple systems and environments, and is critical to their business. With Splunk ITSI, Advanced MD was able to reduce MTTR, replace brittle home-grown monitoring tools and improve the uptime and reliability. “Splunk IT Service Intelligence was delivering insights days after installing, instead of the months it can take legacy monitoring solutions. Splunk ITSI helps us ensure that the claims service stays up and running at all times.” - Tyler Germer, director of information technology, AdvancedMD.
- Let’s take a closer look at few of the apps we are highlighting here. We will mention few Splunk supported Apps. We are investing in these apps and provide full support for them.
- Splunk provides a platform for IT and the business to gain visibility, insights and intelligence from all machine data Strong ecosystem of apps to deliver end-to-end operational visibility enabling IT to reduce costs, consolidate tools and eliminate silos Splunk delivers Operational Intelligence allowing IT to go beyond troubleshooting & maintenance to enabling business insights and growth


