


스타트업 데이터분석 - 퍼널분석과 코호트분석
- 1. Funnel analysis Cohort analysis
- 2. 어디에 집중해서 서비스를 개선해야 될까? Funnel analysis
- 3. Funnel(깔떼기) Analysis: 특정 목표를 달성을 위한 유저행동을 단계별로 분석하는 데이터 분석 방법 = 깔떼기 같이 생긴 그래프를 이용한 분석
- 4. 각 단계별로 사용자가 떠나가기 때문에 아래로 갈 수록 좁아지는 깔떼기 형태의 graph가 됩니다.
- 5. Funnel(깔떼기) Analysis: 3단계 1. 최종목표설정 2. 깔떼기 단계 설정 3. 단계별 이탈률 측정
- 6. Referral 1. 최종 목표 설정
- 7. Acquistion Activation Retention Referral 2. 각 단계 정의
- 8. Acquistion Activation Retention Referral 3. 단계별 이탈률 측정 50% 40% 20% 100% 50% 10% 20%
- 9. Funnel(깔떼기) Analysis: 취약점 분석 Acquistion 당연히 이탈률이 제일 높은 step 부터 개선 Activation Retention 어디가 문제인지 찾았지만, 왜 문제인지를 찾아야! 이용할 수 있는건 다 이용하세요! cs담당자, user interview, support email, product bug, design change, step re-ordering …
- 10. Funnel(깔떼기) Analysis: 각 step별 KPI 설정 최종 목표를 가지고 funnel을 거꾸로 올라가면 각 단계별로 달성해야 하는 KPI를 설정할 수 있습니다. 5M Trial x 4 Revenue Traffic 2M 100% 25% 10% x 2.5 20M
- 11. 랜딩페이지 전환률 / 공유 기능 /초대 기능 전체적인 성장 로드맵 회원가입 절차
- 12. 랜딩페이지 전환률 / 공유 기능 /초대 기능
- 13. 전반적인 성장 로드맵, growth funnel Fundamental Question 1. 사용자 획득 2. 사용자 활성화 3. 사용자 유지/사용자 참여 4. 사용자 부활
- 14. 회원가입 절차
- 16. 우리 잘 하고 있나? Cohort analysis
- 17. cohort : 특정 기간 동안 같은 특성을 가진 사용자 집단
- 18. cohort analysis 사용자를 그룹으로 나눠서 분석하는 방법
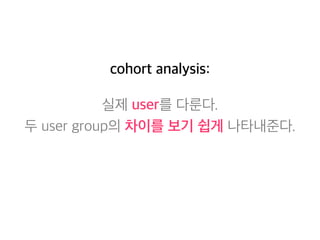
- 19. cohort analysis: 실제 user를 다룬다. 두 user group의 차이를 보기 쉽게 나타내준다.
- 20. cohort 기준: 어떻게 사용자를 나눠야 될까? ?
- 21. 중요한건 metric: 사용자를 그룹으로 나눠서 뭘? 분석할 것인가 ?
- 22. 기본적으로 가입일 기준으로 cohort anlaysis를 하세요 2014.2 2014.3 weekly 또는 montly 사용자들이 요일별로 사용 패턴이 있기 때문에 daily로는 분석 X
- 23. cohort anlaysis - retention
- 24. cohort anlaysis - retention 가입 후 기간에 따른 각 cohort의 retention의 변화
- 25. User retention # tweet
- 26. 두번째 기간에 drop은 예정된 것, 너무 놀라지 마세요 그 이후에 stable한지가 더 중요합니다
- 27. 같은 기간이 지난 후의 cohort간 retention 비교 같은 시간대 cohort 간 비교 cohort anlaysis - retention
- 28. 잘 보여주는게 정말 중요! 전체에 대한 비율 보다는 바로 전 기간에 대한 비율로 보세요. 0 1 2 3 4 5 3월 1주 200 60% 40% 30% 28% 27% 3월 2주 200 75% 44% 30% 28% 3월 3주 200 50% 55% 30% 3월 4주 200 70% 55% 4월 1주 200 75% 4월 2주 200 < 전체에 대한 retention rate >
- 29. 잘 보여주는게 정말 중요! 전체에 대한 비율 보다는 바로 전 기간에 대한 비율로 보세요. 0 1 2 3 4 5 3월 1주 200 60% 67% 75% 83% 90% 3월 2주 200 65% 65% 78% 68% 3월 3주 200 70% 61% 71% 3월 4주 200 75% 57% 4월 1주 200 80% 4월 2주 200 < 전 기간에 대한 retention rate >
- 31. User engagement에 따른 cohort analysis: Leading indicator 발견하기 engaged user vs. churned user Facebook / 7 friends in 10 days
- 32. Leading indicator Facebook / 7 friends in 10 days Actions new user experience (nux) 개선 e-mail contact importing - Octazen 인수
- 33. User engagement 측정 User retention 측정
- 35. Funnel analysis 어디에 집중해서 서비스를 개선해야 될까? Cohort analysis 우리 잘 하고 있나?
- 36. Reference Pinterest http://engineering.pinterest.com/post/86533331849/how-pinterest-drives-sustainable-growth Facebook http://www.quora.com/Facebook-Growth-and-Traction/What-are-some-decisions-taken-by-the-Growth-team- at-Facebook-that-helped-Facebook-reach-500-million-users# Cohort Analysis http://www.keplarllp.com/blog/2012/04/cohort-analyses-for-digital-businesses-an-overview http://www.linkedin.com/today/post/article/20130917162943-4444200-the-3-key-cohort-analyses-for-measuring- your-startup-s-product-performance Twitter http://techcrunch.com/2009/10/05/twitter-data-analysis-an-investors-perspective-2/