Location via proxy:   [ UP ]  
[Report a bug]   [Manage cookies]                
SlideShare a Scribd company logo
tate Street
    State Street Corporation
               December 31, 2001
WORKING TOGETHER, THINKING AHEAD

State Street is a world leader in serving the unique needs of sophisticated global
investors. Powered by our technological savvy, deep understanding of global markets
and ability to integrate services throughout the investment process, we provide our
clients with business solutions that help them succeed in complex times.

State Street has four core competencies: investment servicing, investment management,
research and trading services. We draw on these capabilities to create integrated
service solutions that increase our clients’ productivity and performance. Our clients
think of us as a trusted partner because we are committed to developing solutions
that meet their investment goals today and help them prepare for future challenges.

With 19,800 employees working in offices in 22 countries, State Street serves clients
in 100 markets around the world. At the close of 2001, State Street had total assets
under custody of $6.2 trillion and assets under management of $775 billion.


 1 Highlights

 2 Letter to Our Stockholders

 8 Ready for the Future

14 Financial Summary

20 Board of Directors

22 Senior Executive Group

23 Corporate Information

24 Worldwide Locations
State Street ist ein weltweit führendes Unternehmen, das den speziellen Bedürfnissen anspruchsvoller globaler
Investoren dient. Weil wir über starkes technisches Know-how verfügen, wie auch über solides Verständnis
globaler Märkte und über die Fähigkeit, Dienstleistungen durch den Investitionsprozess zu integrieren, bieten wir
unseren Kunden Geschäftslösungen an, die ihnen in anspruchsvollen Zeiten zum Erfolg verhelfen.

State Street verfügt über vier Grundkompetenzen: Investment Servicing, Asset Management, Research
sowie Trading. Aus diesen Fähigkeiten schöpfen wir, um integrierte Service-Lösungen zu erstellen, die
sowohl die Produktivität wie auch die Leistung unserer Kunden erhöht. Weil wir uns verpflichten, Lösungen
zu entwickeln, die ihren aktuellen Investitionszielen entsprechen und sie auf künftige Herausforderungen
vorbereiten, betrachten uns unsere Kunden als vertrauenswürdige Partner.

Unsere 19.800 Mitarbeiter in 22 Ländern betreuen Kunden auf der ganzen Welt in über 100 Märkten. Zum
Jahresende 2001 verwahrte State Street US-$ 6,2 Billionen an Wertpapieranlagen und verwaltete
Vermögensanlagen in Höhe von US-$ 775 Milliarden.


                                                                                                      4


                        22               1 9,800                                                100
       2001                          6 2,000                  7,750


State Street, est le leader mondial au service des besoins spécifiques des investisseurs haut de gamme de
renommée internationale. Forts d’un savoir-faire technologique, d’une profonde compréhension des marchés
internationaux et d’une répartition efficace de nos services tout au long du processus d’investissement, nous
sommes à même de fournir à nos clients des solutions grâce auxquelles ils seront au rendez-vous de la
compétitivité en ces temps de forte instabilité.

State Street organise son activité autour de quatre axes fondamentaux : le suivi, la recherche, la gestion
d’investissements et les transactions boursières. Grâce à l’ensemble de nos compétences, nous sommes en
mesure d’imaginer des solutions complètes visant à améliorer la productivité et les performances de nos
clients. Ces derniers nous considèrent comme un partenaire d’une extrême fiabilité parce que nous nous
engageons à développer des solutions en matière de placements adaptées à leurs objectifs actuels, et parce
que nous les aidons à se préparer pour les défis à venir.

Grâce à ses 19 800 salariés, répartis dans 22 pays différents, State Street assiste des clients partout dans le
monde, c’est-à-dire sur plus de 100 marchés. Au terme de l’année 2001, State Street totalisait 6,2 billions de
dollars américains en nombre d’actifs sous dépôt et 775 milliards de dollars américains d’actifs sous gestion.
State Street es una empresa líder mundial que sirve las intrincadas y únicas necesidades de sofisticados
inversionistas globales. Nuestra empresa deriva su fuerza de una combinación de conocimiento tecnológico,
un profundo entendimiento de los mercados globales y la capacidad de integrar servicios que abarcan todos
los aspectos del proceso de inversión. Proveemos a nuestros clientes con soluciones para la inversión de
recursos y los ayudamos a que dichas inversiones se realicen exitosamente en tiempos muy complejos.

State Street ofrece cuatro pilares fundamentales: servicios de inversión, administración de inversiones,
investigación y transacciones. Basándonos en estos cimientos, creamos soluciones integradas de servicio que
permiten incrementar la productividad y el desempeño de nuestros clientes. Nuestros clientes nos consideran
un socio confiable porque estamos comprometidos a desarrollar soluciones que se ajusten a sus metas de
inversión actual, ayudándolos al mismo tiempo a prepararse para afrontar retos venideros.

Con 19.800 empleados esparcidos por 22 países en nuestras oficinas, State Street presta sus servicios a
clientes de todo el mundo en más de 100 mercados. A la clausura de operaciones del 2001, la totalidad
de activos bajo custodia en State Street sumaron 6,2 billones de dólares estadounidenses, mientras que los
activos administrados por State Street alcanzaron los 775 miles de millones de dólares estadounidenses.


                                                             19,800
                                          62,000                      7,750
OF OUR 209TH YEAR


HIGHLIGHTS
(Dollars in millions, except per share data; taxable equivalent)                                            2001(1)           2000           Change

Total Operating Revenue                                                                                 $ 3,914           $ 3,615                    8%
Operating Earnings                                                                                            661               595                11

Operating Earnings Per Share:(3)
Basic                                                                                                        2.03              1.85                10
Diluted                                                                                                      2.00              1.81                10

Cash Dividends Declared Per Share(3)                                                                         .405              .345                17
Operating return on Equity                                                                                   18.2%             20.3%


                                                                                                                                                '01(1)
                                                                                                                                         '00
                                                                                                                                                 3,914
                                                                                                                                '99(2)    3,615
                                                                                                                                 3,119

                                                              '92
                                                               1,052

             R E V E N U E (Dollars in millions)
TOTAL


                                                                                                                                                   '01(1)
                                                                                                                                         '00        2.00
                                                                                                                                          1.81
                                                                                                                                '99(2)
                                                                                                                                 1.49

                                                              '92
                                                              .51

D I L U T E D E A R N I N G S P E R S H A R E (3)


(1) Excluded from operating results for the year ended December 31, 2001, is the write-off of State Street’s total investment in Bridge Information Systems, Inc.
of $50 million, equal to $33 million after tax, or $.10 per diluted share, recorded in March 2001.

(2) Excluded from operating results for the year ended December 31, 1999, is the gain on the sale of the commercial banking business of $282 million, net
of exit and other associated costs, and a one-time charge of $57 million on sales of securities related to the repositioning of the investment portfolio.
Combined, these items increased reported net income by $130 million after tax, or $.40 per diluted share.

(3) Per share amounts have been restated to reflect the 2-for-1 stock split in the form of a 100% stock dividend distributed on May 30, 2001, to stockholders
of record as of April 30, 2001.
TO OUR STOCKHOLDERS


                           The year 2001 was marked by unique challenges and opportunities. The environment in which we operated
                           was difficult in many ways. Economic growth slowed significantly in all regions of the world. Stock market
                           performance was weak for the second consecutive year – the first such downturn in the United States since
                           1973, and the first in global markets since 1982. The terrorist attacks and unprecedented market disruption
                           in September filled the world with political uncertainty and a sense of anxiety.

                           Despite these considerable challenges, State Street turned in strong performance in many areas in 2001.
                           We achieved our 24th consecutive year of double-digit growth in operating earnings per share. We brought
                           in an impressive amount of new business in all products in all parts of the world. We launched transfer
                           agency systems in Luxembourg and the United Kingdom. We were recognized as a great place for women to
                           work. We devoted 1.5% of our pre-tax profits to support community needs throughout the world as we have
                           for more than 20 years. And we continued to develop as a team. All in all, 2001 was a year of considerable
                           achievement for State Street.

                           Financial Results Our primary financial goal is to achieve sustainable real growth in earnings per share.
                           In 2001, operating earnings per share increased 10%, to $2.00 on a diluted basis. Our ten-year growth rate
                           for operating earnings per share is 16% compounded annually.

                           Operating revenue, driven by new business from existing and new clients, increased 8%, to $3.9 billion, in 2001.
                           In the fourth quarter, we achieved $1 billion in revenue – a record result. Facing a challenging environment,
                           we tempered our year-over-year expense growth to 8%, in step with revenue growth, while continuing to
                           invest in the technology and infrastructure needed to drive our future growth.


2   State Street Corporation
We continue to differentiate ourselves by stating a goal for
revenue growth. We have reaffirmed our goal of achieving
12.5% real compound annual growth from 2000 through 2010,
although, as has been true in the past, we do not expect to
achieve that rate every year in the ten-year period.

Our supporting goal for return on stockholders’ equity is to
achieve 18% annually. In 2001, we exceeded that goal by
delivering operating ROE of 18.2%.

We distributed a two-for-one stock split in the form
of a 100% stock dividend on May 30, 2001, and we
increased our quarterly cash dividend declared
twice during the year for the 23rd consecutive year.
Cash dividends declared in 2001 increased 17%
from the prior year.
ex
    lobalizatio
                           Seizing Opportunity For me personally, our ability to perform so well in such a difficult year served to
                           crystallize some important conclusions. First, I believe that our fundamental strategy – focusing on serving
                           the needs of sophisticated investors around the world – is sound. Second, I believe that we have enormous
                           opportunities to leverage our leadership in financial services and grow around the world.

                           State Street clearly distinguished itself in the marketplace in 2001. Most notably, we did an excellent job
                           of serving our clients. State Street people are passionately committed to making our clients successful. We
                           use our insight and technology to integrate our products and services into solutions that work effectively
                           for them. We have the vision and fortitude to deliver excellence consistently, day in and day out – as is
                           evidenced by the experience of clients such as Federated Investors, who has been growing with us for more
                           than 40 years.

                           Of equal importance is the fact that we have positioned ourselves to benefit from some very powerful
                           global trends. These trends are (1) ongoing convergence in the financial services industry, (2) a worldwide
                           sense of urgency about the need for retirement security, and (3) a growing trend by investment managers
                           to outsource activities that aren’t part of their core competencies.

                           It is not enough simply to be “in the right place at the right time.” To benefit fully from the effects of these
                           trends, State Street is thinking ahead in dynamic and creative ways. Then we implement – and State Street
                           is an expert at getting things done.


4   State Street Corporation
pe
      n
Convergence in the financial services industry provides State Street with an opportunity to assume a
leadership role. The new global players who are emerging are looking for a partner who can offer a full
range of integrated service solutions and is highly experienced in dealing with financial operations
worldwide – including different regulations and technologies. These requirements coincide perfectly with
State Street’s core strengths – strengths we have proven in serving clients such as Chuo Mitsui, Merrill
Lynch and UBSWarburg.

Another global trend that benefits State Street is a growing sense of urgency about retirement security,
driven by increasing life expectancy in most parts of the world. This trend is putting pressure on retirement
systems, leading governments and employers to devise new strategies to help workers invest for their futures.
These efforts are creating growing pools of retirement assets, which must be managed and serviced. State
Street’s deep expertise in global financial markets, as well as our position as a world leader in pension fund
servicing – is a strong advantage for us. We participate by providing services to investment managers and
by managing assets ourselves through innovative solutions such as exchange-traded funds (ETFs) and
enhanced indexing.

The move toward operations outsourcing is another area in which State Street has a clear advantage. We
are creating a scaleable solution for investment managers who need complete servicing of their back and
middle office operations. Our success with Pacific Investment Management Company (PIMCO) and Scottish
Widows has made us the leading candidate in current searches.


                                                                                                                                        5
                                                                                                             State Street Corporation
rien             Strategic Focus We are deepening our position as the trusted partner of sophisticated investors by
                           building on our strengths. Among these strengths are:

                           A strategic client orientation Partnering with clients to deliver State Street’s best capabilities in responsive,
                           trust-based relationships that meet true client needs.

                           A global focus Integrating service delivery and providing for local differences on behalf of clients everywhere.

                           A technological advantage Using innovative technology to deliver efficient, client-friendly solutions.

                           One of State Street’s greatest assets is the quality of our people. Our achievement of solid results this year
                           in the face of such difficult economic and market conditions is a testament to our team’s focus, commitment
                           to client service and integrity.

                           In December 2001, our Board of Directors elected Ron Logue as President and Chief Operating Officer of
                           State Street. Ron and I have worked together closely for more than a decade, and I look forward to continuing
                           our partnership. Ron’s strong client focus, his understanding of the potential offered by technology and his
                           proven ability to deliver both innovation and reliability contribute significantly to our success in maintaining
                           our competitive advantage and advancing our global leadership.


6   State Street Corporation
ce
I am very pleased with our performance in the past year and am both confident and enthusiastic about
our prospects for the future. I want to thank our 19,800 employees in 22 countries for their hard work.
I also want to thank our stockholders for their continued support. In 2002 and beyond, we will seize more
and more opportunities to grow, to deliver value to our clients and stockholders and to continue to build
on State Street’s reputation as a world leader in financial services.


Sincerely,


David A. Spina
Chairman and Chief Executive Officer


from left to right:

Ronald E. Logue
President and Chief Operating Officer

John R. Towers
Vice Chairman and Chief Administrative Officer

David A. Spina
Chairman and Chief Executive Officer
READY FOR THE FUTURE

                           State Street is 210 years old in 2002. Over two centuries of experience in
                           international financial markets is a great strength for us. As a leader in the evolution of
                           these markets, we have a rich perspective and a depth of practical expertise that are
                           invaluable to our clients.

                           Experience alone, however, is no guarantee of success. State Street has continued to grow
                           and win because we have consistently planned for the future – designing innovative solutions


                                              persp
                           so our clients can succeed in rapidly changing business and technological environments.


8   State Street Corporation
Today, State Street offers sophisticated investors the solutions they need to achieve their
goals in a quickly changing and uncertain global environment. Our broad capabilities enable
us to provide seamless management of investment information, highly reliable investment
servicing solutions, performance-oriented investment management and cutting-edge research
and trading services to investors around the world.

Our other offering – perhaps less tangible but immeasurably powerful – is our ability to


              ective
share our strengths with clients through collaborative working partnerships.


                                                                                                                     9
                                                                                          State Street Corporation
We Are Global
                          Being a truly global firm requires a lot more than simply having offices in multiple countries. Our clients
                          need a global infrastructure that is so complete and so interconnected that they can view the world as one
                          seamless marketplace.

                          State Street is an expert in supplying global applications and adapting for differences in local markets and
                          cultures. As a result, more and more investment managers worldwide are choosing to outsource non-core
                          activities to State Street. Partnering with us in this way enables them to focus more productively and confidently
                          on their core businesses.

                          Clients around the world also rely on us for the expertise that helps them address the challenges created
                          by quickly expanding businesses and changing industry regulations. In China, for example, we’re working with
                          our partner, the Industrial Commercial Bank of China, and the Chinese government to shape the country’s
                          emerging mutual fund business. In Brazil, we are collaborating with Banco Itau to expand the bank’s services
                          for pension funds and multinational companies, and to help design new services.


                          We Are Experts in Applying Technology
                          State Street clients count on us to use innovative technology to deliver efficient, client-friendly solutions.
                          We are committed to investing in technology and technology professionals and have been for decades. As a
                          result, State Street’s technology today is open, reliable, scaleable and global – enabling us to support a wide
                          range of investment strategies.

                          One reason for our technological edge is our industry-leading, multi-currency accounting system – among
                          the most robust in the world. Our unique capability has proven particularly important to investment clients
                          such as AMVESCAP, Barclays Capital and GE Asset Management (GEAM), whose strategies lead them to offer


10   State Street Corporation
multiple investment products across many markets and time zones. As the largest net asset value calculator
in the United States, we supply over 7,000 multi-currency daily pricing valuations to U.S.-registered mutual
funds. We also calculate net asset values for nearly 3,500 retirement funds every day.

Our clients count on our people to help them apply technology to their businesses in new ways. In addition
to consulting to individual clients about technology-related issues, State Street has established a reputation
as a thought leader in the use of new technologies in world financial markets. In China, for example, we recently
signed a memorandum of understanding with Zhejiang University, located in Hangzhou, Zhejiang Province
to participate in the creation of a technology center jointly operated by State Street and the University.

State Street’s commitment to technology is evidenced by our recent inclusion in Computerworld Magazine’s
annual ranking of “the top 100 places to work for information technology professionals.” We are honored
to be considered one of the great global technology companies.


                                                                                                                                          11
                                                                                                               State Street Corporation
Our Range of Services is Fully Integrated
                          True integration is a key advantage to the success of sophisticated investors in today’s complex financial
                          markets. State Street works with clients as a collaborative partner to assemble complete solutions that
                          cross all aspects of the investment process. We deliver these solutions in responsive, trust-based relationships
                          that meet our clients’ precise needs.

                          The need for this level of integration and capability is increasing most dramatically in Europe. From our
                          Luxembourg office, the world’s second-largest mutual fund market and Europe’s largest cross-border
                          investment center, we have been instrumental in meeting the unique requirements of investment managers
                          who wish to distribute and manage funds in Europe, Latin America and Japan.

                          In 2001, State Street worked side-by-side with many new clients to develop integrated investment
                          servicing solutions. These clients included Lord Abbett, the New York State Teachers’ Retirement System
                          (NYSTRS) and Philips Pensioenfonds (Philips Electronics N.V.). We are providing an expanded spectrum of
                          integrated services to clients of long standing as well — companies such as ABP Investments (Alegemen
                          Burgerlijk Pensioenfonds), California Public Employees’ Retirement Systems (CalPERS), the Government Pension
                          Investment Fund (formerly Nenpuku), Merrill Lynch and UBSWarburg.


12   State Street Corporation
We Manage with a Long-Term View
Our clients tell us they value our clear point of view about the way financial markets will evolve, and our
plans for seizing opportunities that will come with changes in investment climates, vehicles, technologies
and regulations.

Our insight into global markets gives us a competitive edge in developing investment servicing solutions
that are reliable and accurate, flexible and scaleable. We are continually enhancing our acknowledged
industry-leading electronic trading platforms and investment research services. In our investment management
business, we offer a broad range of investment styles and capabilities.

State Street’s ability to think ahead is demonstrated by our development and adoption of new investment
products. For example, we were one of the architects of exchange-traded funds (ETFs) and remain the
investment manager and trustee for the first and still the largest ETF - the S&P 500 SPDR (“Spider”) trust,
launched in partnership with the American Stock Exchange.

No other company can offer the type of market intelligence that State Street provides to our clients through
State Street Global Link.® Global Link is a powerful online worldwide network that combines proprietary
market research, portfolio analytics and electronic trading technology to support clients’ decision making
processes, maximize their efficiency, facilitate trading, reduce risk and optimize returns. Today, 54 of the
world’s 100 largest money managers use Global Link.

We are well positioned for continued growth. We remain committed to delivering the highest-quality
solutions to our clients. We remain committed to delivering value to our stockholders. With a heritage of
leadership and innovation, State Street is ready for the future.


                                                                                                                                     13
                                                                                                          State Street Corporation
FINANCIAL SUMMARY

SELECTED            FINANCIAL           DATA
(Dollars in millions, except per share data; per share data                                                                                             96-01
restated for 2-for-1 stock split in 2001; taxable equivalent)                        2001           2000          1999          1998          1997      CAGR

F o r t h e y e a r s e n d e d D e c e m b e r 31 ,
Operating Results:
Fee revenue:
Servicing fees                                                                  $ 1,624        $ 1,425       $ 1,170       $ 1,024       $     861
Management fees                                                                       511            581           600           480           391
Foreign exchange trading                                                              368            387           306           289           245
Processing fees and other                                                             329            272           236           204           176

Total fee revenue                                                                    2,832          2,665         2,312         1,997         1,673        17%

Net interest revenue after provision for loan losses                                 1,082           950           807           768           669         13

Total operating revenue                                                              3,914          3,615         3,119         2,765         2,342        16
Operating expenses                                                                   2,867          2,644         2,336         2,068         1,734        15

Income before income taxes                                                           1,047           971           783           697           608         17
Income taxes                                                                          319            311           254           221           184
Taxable equivalent adjustment                                                          67             65            40            40            44

Operating earnings                                                              $     661      $     595     $     489     $     436     $     380         18

Operating earnings per share:
Basic                                                                           $     2.03     $     1.85    $     1.52    $     1.35    $     1.18        17
Diluted                                                                               2.00           1.81          1.49          1.33          1.16        18

Cash dividends declared per share                                                     .405           .345          .300          .260          .220        16

Operating return on equity                                                            18.2%          20.3%         19.7%         20.2%         20.6%

Reported Results:
Total revenue                                                                   $ 3,864        $ 3,615       $ 3,344       $ 2,765       $ 2,342           15
Net Income                                                                            628            595           619           436           380         17

Earnings per share:
Basic                                                                           $     1.94     $     1.85    $     1.93    $     1.35    $     1.18        16
Diluted                                                                               1.90           1.81          1.89          1.33          1.16        16

Return on equity                                                                      17.3%          20.3%         25.0%         20.2%         20.6%

A s o f D e c e m b e r 31 ,
Total assets                                                                    $ 69,896       $ 69,298      $ 60,896      $ 47,082      $ 37,975
Long-term debt                                                                       1,217          1,219          921           922           774
Stockholders’ equity                                                                 3,845          3,262         2,652         2,311         1,995
Closing price per share of common stock                                              52.25          62.11         36.53         35.06         29.09

Number of employees                                                                 19,753         17,604        17,213        16,816        14,199

Operating results exclude significant, non-recurring special items to present the results and trends of the Corporation’s ongoing business activities. For the
year ended December 31, 2001, operating results exclude the write-off of State Street’s total investment in Bridge Information Systems, Inc. of $50 million,
equal to $33 million after tax, or $.10 per diluted share, recorded in March 2001. For the year ended December 31, 1999, operating results exclude the
gain on the sale of the commercial banking business of $282 million, net of exit and other associated costs, and a one-time charge of $57 million on sales
of securities related to the repositioning of the investment portfolio. Combined, these items increased reported net income by $130 million after tax,
or $.40 per diluted share.
Results above include State Street’s retirement investment and benefits outsourcing services through March 31, 2000. On April 1, 2000, those services were
contributed to CitiStreet, a 50/50 joint venture accounted for using the equity method, thereby reducing revenue and expenses subsequent to
CitiStreet’s formation.


14      State Street Corporation
Summary of Operations
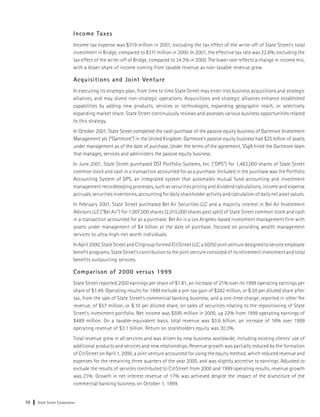
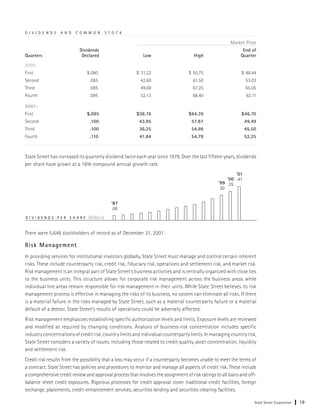
State Street recorded its 24th consecutive year of double-digit operating earnings-per-share growth in 2001.
State Street’s operating earnings per share were $2.00 in 2001, an increase of 10% over 2000 earnings per share
of $1.81. Total taxable-equivalent operating revenue was $3.9 billion, an increase of 8% from 2000. Operating
earnings were $661 million, up 11% from 2000 net income of $595 million. Operating return on stockholder’s
equity was 18.2%.
State Street’s 2001 reported earnings per share were $1.90, its reported net income was $628 million, and its
reported total taxable-equivalent revenue was $3.9 billion. Reported results for 2001 differ from operating results,
which exclude the write-off of State Street’s total investment in Bridge Information Systems, Inc. (“Bridge”) of $50
million, equal to $33 million after tax, or $.10 per diluted share. In March 2001, following a bankruptcy filing by
Bridge, State Street determined that the value of this investment was permanently impaired.

                                                                                                             '01
                                                                                                   '00        2.00
                                                                                                    1.81
                                                                                          '99
                                                                                 '98
                                                                                           1.49
                                                                        '97
                                                                                  1.33
                                                                         1.16


DILUTED OPERATING
E A R N I N G S P E R S H A R E (Dollars)


State Street’s primary financial goal is to achieve sustainable, real (inflation-adjusted) growth in earnings per share.
Over the last five years, diluted operating earnings per share increased at an 18% compound annual growth rate.
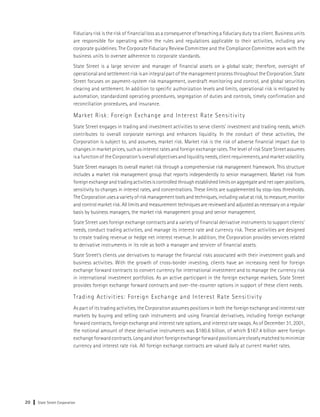
In 2001, the Corporation’s total operating revenue was $3.9 billion, an increase of $299 million, or 8%, over 2000.
On April 1, 2000, State Street contributed its retirement investment and benefits outsourcing services to a 50/50
joint venture, CitiStreet, accounted for using the equity method, thereby reducing revenue and expenses of State
Street subsequent to CitiStreet’s formation. Adjusted to exclude the revenue and expenses of services contributed
to CitiStreet from the first quarter of 2000 (“adjusted for the formation of CitiStreet”), the growth in total operating
revenue was 10%.

                                                                                                             '01
                                                                                                   '00
                                                                                                              3,914
                                                                                          '99       3,615
                                                                                 '98       3,119
                                                                        '97                                     1
                                                                                  2,765
                                                                         2,342
                                                                                                                2
                                                                                                                3
                                                                                                                4
                                  R E V E N U E (Dollars in millions)
TOTAL       OPERATING

1 Servicing fees 2 Management fees
3 Foreign exchange trading and processing fees and other revenue
4 Net interest revenue after provision for loan losses


                                                                                                                                                 15
                                                                                                                      State Street Corporation
Summary (cont’d)
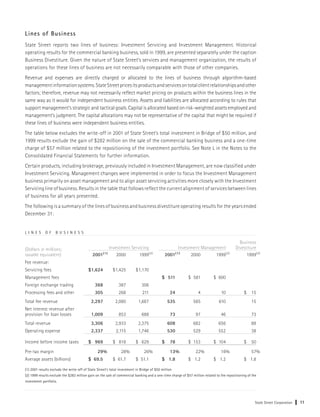
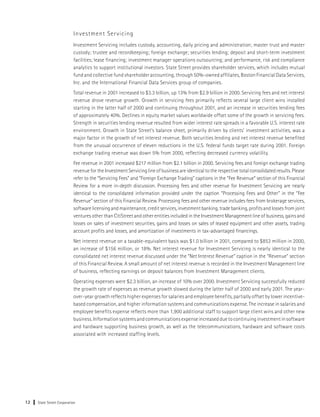
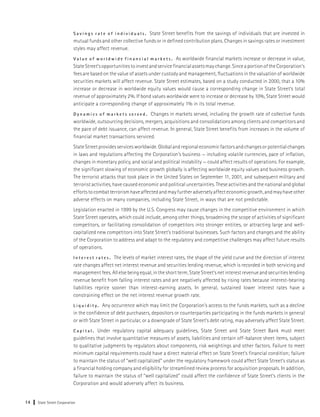
                          In 2001, servicing fees and net interest revenue drove revenue growth. Growth in servicing fees primarily reflects
                          several large client wins installed starting in the latter half of 2000 and continuing throughout 2001, and a
                          significant increase in securities lending revenue fees. Strength in securities lending revenue resulted primarily from
                          wider interest rate spreads in a favorable 2001 U.S. interest rate environment. Declines in equity market values
                          worldwide offset some of the growth in servicing fees. Both securities lending and net interest revenue benefited
                          from the unusual occurrence of eleven reductions in the U.S. federal funds target rate during 2001. Additionally,
                          growth in State Street’s balance sheet, primarily from clients’ investment activities, was a significant factor in the
                          growth of net interest revenue. Management fees were down 12%, reflecting declining equity values worldwide.
                          Foreign exchange trading revenue was down 5%, reflecting decreased currency volatility. Lower management fees
                          and foreign exchange trading revenue partially offset the growth in servicing fees and net interest revenue.
                          Reducing the rate of expense growth was a key factor in State Street’s 2001 performance. State Street continues to
                          invest for the future by carefully pacing spending on strategic initiatives and technology projects that are critical to
                          long-term growth. Operating expenses were $2.9 billion, an increase of 8% over 2000. Adjusted for the formation
                          of CitiStreet, operating expenses grew 10%, significantly lower than the comparable 20% expense growth in 2000.
                          The 10% year-over-year growth in expenses reflects higher salaries and employee benefits expense, partially offset
                          by lower incentive-based compensation, and higher information systems and communications expense.
                          State Street has two supporting financial goals, one for total revenue and one for return on stockholders’ equity.
                          State Street’s total revenue goal is 12.5% real compound annual growth from 2000 through 2010; although, as
                          has been true in the past, State Street does not expect to achieve that growth rate every year in the ten-year
                          period. State Street still expects to meet its goal over the stated period. Operating return on stockholders’ equity
                          for 2001 was 18.2%, exceeding State Street’s long-term goal of 18%.
                          State Street’s strategy of focusing on providing sophisticated global investors with a complete, integrated range
                          of products and services has proven successful for over two decades under varying economic and financial
                          conditions. State Street focuses on total client relationships. This focus results in a high rate of client retention,
                          cross-selling opportunities and recurring revenue. Services are integrated and priced based on each client’s total
                          business relationship. While most of State Street’s client services result in management or servicing fees, clients
                          use a wide variety of additional services that are recorded in their respective revenue categories, such as foreign
                          exchange trading revenue or net interest revenue. Management focuses on increasing total revenue.
                          State Street’s ability to serve clients’ expanding needs is critical to its success. Long-term, global trends driving
                          demand for State Street’s services remain robust and support continuing growth: ongoing convergence in the
                          financial services industry, a worldwide sense of urgency about the need for retirement security and a growing
                          trend by investment managers to outsource activities that are not part of their core competencies. By continuing
                          to invest in technology, integrated products and services that span the entire investment process, and expansion
                          into new markets, State Street is positioned to benefit from these trends.
                          State Street’s solid performance in 2001 was the result of strong new business with existing and new clients, a
                          diverse service offering, and market expertise that enabled State Street to take advantage of an unprecedented
                          interest rate environment, as well as the commitment and abilities of State Street’s global employee team.


16   State Street Corporation
Report of Independent Auditors
The Stockholders and Board of Directors
State Street Corporation
We have audited, in accordance with auditing standards generally accepted in the United States, the consolidated
statement of condition of State Street Corporation at December 31, 2001 and 2000 and the related consolidated
statements of income, changes in stockholders’ equity, and cash flows for each of the three years in the period
ended December 31, 2001 (not presented separately herein) and in our report dated January 16, 2002, we
expressed an unqualified opinion on those consolidated financial statements. In our opinion, the information set
forth in the accompanying condensed consolidated financial statements is fairly stated in all material respects in
relation to the consolidated financial statements from which it has been derived.


Boston, Massachusetts
January 16, 2002


                                                                                                                                           17
                                                                                                                State Street Corporation
Condensed Consolidated Financial Statements
                          CONSOLIDATED                     STATEMENT            OF    INCOME
                          (Dollars in millions, except per share data) Years ended December 31,                                                2001      2000      1999

                          Fee Revenue
                          Servicing fees                                                                                                   $ 1,624     $ 1,425   $ 1,170
                          Management fees                                                                                                       511       581       600
                          Foreign exchange trading                                                                                              368       387       306
                          Processing fees and other                                                                                             279       272       179

                          Total Fee Revenue                                                                                                    2,782     2,665     2,255

                          Net Interest Revenue
                          Interest revenue                                                                                                     2,855     3,256     2,437
                          Interest expense                                                                                                     1,830     2,362     1,656

                          Net interest revenue                                                                                                 1,025      894       781
                          Provision for loan losses                                                                                              10         9        14

                          Net interest revenue after provision for loan losses                                                                 1,015      885       767

                          Gain on sale of commercial banking business, net of exit and
                          other associated costs                                                                                                                    282

                          Total Revenue                                                                                                        3,797     3,550     3,304

                          Operating Expenses
                          Salaries and employee benefits                                                                                       1,663     1,524     1,313
                          Information systems and communications                                                                                365       305       287
                          Transaction processing services                                                                                       247       268       237
                          Occupancy                                                                                                             229       201       188
                          Other                                                                                                                 363       346        311

                          Total operating expenses                                                                                             2,867     2,644     2,336

                          Income before income taxes                                                                                            930       906       968
                          Income taxes                                                                                                          302        311      349

                          Net Income                                                                                                       $    628    $ 595     $ 619

                          E a r n i n g s Pe r S h a r e
                          Basic                                                                                                            $ 1.94      $ 1.85    $ 1.93
                          Diluted                                                                                                               1.90      1.81      1.89

                          Average Shares Outstanding (in thousands)
                          Basic                                                                                                           325,030      321,678   321,320
                          Diluted                                                                                                         330,492      328,088   327,503


                          Refer to State Street Corporation’s 2001 Financial Review for a complete set of consolidated financial statements.


18   State Street Corporation
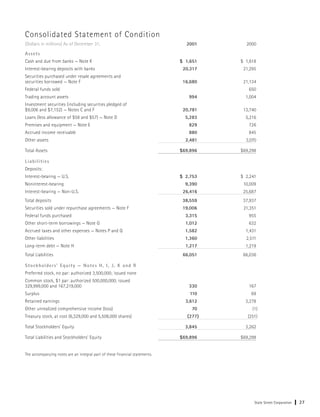
CONSOLIDATED                  STATEMENT               OF    CONDITION
(Dollars in millions) As of December 31,                                                                                2001       2000

Assets
Cash and due from banks                                                                                              $ 1,651    $ 1,618
Interest-bearing deposits with banks                                                                                  20,317     21,295
Securities purchased under resale agreements and securities borrowed                                                  16,680     21,134
Federal funds sold                                                                                                                  650
Trading account assets                                                                                                   994      1,004
Investment securities (including securities pledged of $9,006 and $7,152)                                             20,781     13,740
Loans (less allowance of $58 and $57)                                                                                  5,283       5,216
Premises and equipment                                                                                                   829        726
Accrued income receivable                                                                                                880        845
Other assets                                                                                                            2,481      3,070

Total Assets                                                                                                         $ 69,896   $ 69,298

Liabilities
Deposits:
Interest-bearing — U.S.                                                                                              $ 2,753    $ 2,241
Noninterest-bearing                                                                                                    9,390     10,009
Interest-bearing — Non-U.S.                                                                                           26,416     25,687

Total deposits                                                                                                        38,559     37,937
Securities sold under repurchase agreements                                                                           19,006      21,351
Federal funds purchased                                                                                                 3,315       955
Other short-term borrowings                                                                                             1,012       632
Accrued taxes and other expenses                                                                                       1,582       1,431
Other liabilities                                                                                                      1,360       2,511
Long-term debt                                                                                                          1,217      1,219

Total Liabilities                                                                                                     66,051     66,036

Stockholders’ Equity
Preferred stock, no par: authorized 3,500,000; issued none
Common stock, $1 par: authorized 500,000,000; issued 329,999,000 and 167,219,000                                         330        167
Surplus                                                                                                                  110         69
Retained earnings                                                                                                       3,612     3,278
Other unrealized comprehensive income (loss)                                                                              70         (1)
Treasury stock, at cost (6,329,000 and 5,508,000 shares)                                                                (277)      (251)

Total Stockholders’ Equity                                                                                             3,845      3,262

Total Liabilities and Stockholders’ Equity                                                                           $ 69,896   $ 69,298

Refer to State Street Corporation’s 2001 Financial Review for a complete set of consolidated financial statements.


                                                                                                                                                                 19
                                                                                                                                      State Street Corporation
DIRECTORS


                            1                     2                                                           3                                                 4          5


10                                           11                                      12                                                                    13              14


1 David A. Spina                                           5 Nader F. Darehshori                              8 Linda A. Hill
Chairman and Chief Executive Officer                       Chairman, President and Chief Executive Officer,   Wallace Brett Donham Professor of Business Administration,
                                                           Houghton Mifflin Company                           Harvard Business School

2 Tenley E. Albright, M.D.
                                                           6 Arthur L. Goldstein                              9 John M. Kucharski
Chairman, Western Resources, Inc.
                                                           Chairman and Chief Executive Officer,              Retired Chairman and Chief Executive Officer, EG&G, Inc.
                                                           Ionics, Incorporated
3 I. MacAllister Booth
                                                                                                              10 Charles R. LaMantia
Retired Chairman, President and Chief Executive Officer,
                                                           7 David P. Gruber
Polaroid Corporation                                                                                          Retired Chairman and Chief Executive Officer,
                                                           Retired Chairman and Chief Executive Officer,      Arthur D. Little, Inc.
                                                           Wyman-Gordon Company
4 Truman S. Casner
Of Counsel, Ropes & Gray


20     State Street Corporation
9
                     6                                                                7          8


                                                                                16
                                        15                                                                          17                                         18


11 Ronald E. Logue                           14 Bernard W. Reznicek                                  17 Diana Chapman Walsh
President and Chief Operating Officer        President, Premier Group; National Director — Utility   President, Wellesley College
                                             Marketing, Central States Indemnity Company of Omaha

12 Dennis J. Picard                                                                                  18 Robert E. Weissman
                                             15 Richard P. Sergel
Chairman Emeritus, Raytheon Company                                                                  Chairman, Shelburne Investments
                                             President and Chief Executive Officer,
                                             National Grid USA
13 Alfred Poe
Personal Investor
                                             16 Gregory L. Summe
                                             Chairman, President, and Chief Executive Officer,
                                             PerkinElmer, Inc.


                                                                                                                                                          21
                                                                                                                               State Street Corporation
SENIOR EXECUTIVE GROUP


 David A. Spina*                                              Maureen Scannell Bateman*
 Chairman and Chief Executive Officer                         Executive Vice President and
                                                              General Counsel
 Ronald E. Logue*
                                                              Joseph W. Chow
 President and
 Chief Operating Officer                                      Executive Vice President

 John R. Towers*                                              Luis J. de Ocejo
 Vice Chairman and                                            Executive Vice President
 Chief Administrative Officer
                                                              John A. Fiore
                                                              Executive Vice President and
                                                              Chief Information Officer

                                                              Joseph L. Hooley
 Timothy B. Harbert*
                                                              Executive Vice President
 Executive Vice President,
 Chairman and Chief Executive Officer,                        Ronald L. O’Kelley*
 State Street Global Advisors
                                                              Executive Vice President,
                                                              Chief Financial Officer and Treasurer

                                                              Stanley W. Shelton
                                                              Executive Vice President


                                                              Chairman Emeritus

                                                              William S. Edgerly
                                                              Chairman, State Street Corporation
                                                              1976-1992


* Designated as executive officers for SEC and IRS purposes

 22      State Street Corporation
INFORMATION


Corporate Headquarters                            Stockholder Information
State Street Corporation                          For timely information about corporate
225 Franklin Street                               financial results and other matters of
Boston, Massachusetts 02110-2804                  interest to stockholders, and to request
                                                  copies of our news releases and financial
Website: www.statestreet.com
                                                  reports by fax or mail, please visit our
General inquiries: +1 617 786 3000
                                                  website at:
Annual Meeting
                                                  www.statestreet.com/stockholder
Wednesday, April 17, 2002, 10:00 a.m. at
                                                  or call 877 639 7788 toll-free in the United
Corporate Headquarters
                                                  States and Canada, or +1 402 573 3644
Transfer Agent
                                                  from other countries. These services are
Registered stockholders wishing to
                                                  available 24 hours a day, seven days a week.
change name or address information on
                                                  For copies of State Street’s Form 10-K,
their shares, transfer ownership of stock,
                                                  Form 10-Q, quarterly financial releases, or
deposit certificates, report lost certificates,
                                                  additional copies of this annual report,
consolidate accounts, authorize direct
                                                  please visit State Street’s website, call State
deposit of dividends, or receive information
                                                  Street’s stockholder services telephone
on State Street’s dividend reinvestment
                                                  line described above, or write to:
plan should contact:
                                                  Shareholder.com
EquiServe Trust Company, N.A.
                                                  ref: State Street Corporation
P.O. Box 43011
                                                  12 Clocktower Place
Providence, Rhode Island 02940-3011
                                                  Maynard, Massachusetts 01754-2597
800 426 5523
Website: www.equiserve.com                        Investors and analysts interested in
                                                  additional financial information may
Stock Listing
                                                  contact State Street’s Investor Relations
State Street’s common stock is listed
                                                  department at Corporate Headquarters,
on the New York Stock Exchange, ticker
                                                  telephone +1 617 664 3477.
symbol: STT, and on the Boston and Pacific
Stock Exchanges.


                                                                                                                               23
                                                                                                    State Street Corporation
LOCATIONS

State Street's clients are among the most sophisticated investors in the world — and their growth strategies are
among the most complex. Through our offices in 22 countries and a global network covering 100 mature and emerging
geographic markets, we can help them capitalize on investment opportunities wherever they arise.


Australia                             Netherlands                             United States
Melbourne, Southbank, Sydney          Amsterdam                               California
                                                                              Alameda, Los Angeles, Newport Beach,
Belgium                               Netherlands Antilles                    Sacramento, San Francisco, San Marino

Brussels                              Willemstad—Curaçao                      Connecticut
                                                                              Hartford, Greenwich
Canada                                New Zealand
                                                                              Florida
Montreal, Toronto, Vancouver          Wellington
                                                                              Boca Raton, Naples

Cayman Islands                        People’s Republic of China              Georgia
George Town                           Hong Kong                               Atlanta

                                                                              Illinois
Chile                                 Singapore                               Chicago
Santiago                              Singapore
                                                                              Iowa
                                                                              Des Moines
Czech Republic                        South Korea
                                                                              Massachusetts
Prague                                Seoul
                                                                              Boston, Milton, Norwood, Osterville, Quincy,
                                                                              Westborough, Westwood
France                                Switzerland
                                                                              Michigan
Montpellier, Paris                    Zurich
                                                                              Lansing

Germany                               Taiwan                                  Missouri
Frankfurt, Munich                     Taipei                                  Kansas City, St. Louis

                                                                              New Hampshire
Ireland                               United Arab Emirates                    Manchester, North Hampton
Dublin                                Dubai
                                                                              New Jersey
Japan                                 United Kingdom                          Princeton

Tokyo                                 Andover, Edinburgh, Guernsey, Jersey,   New York
                                      London, Windsor                         New York, White Plains
Luxembourg
                                                                              North Carolina
Luxembourg                                                                    Charlotte, Winston-Salem


24      State Street Corporation
state street corp stt_ar01
S
For more information
State Street Corporation
225 Franklin Street
Boston, Massachusetts 02110
+1 617 786 3000

www.statestreet.com

© 2002 State Street Corporation


                                  SSBCM-AR-01
FINANCIAL REVIEW
2001 FINANCIAL REVIEW


 1 Selected Financial Data

 2 Management's Discussion and Analysis of
   Results of Operations and Financial Condition
     2 Results of Operations
    16 Financial Condition
    23 Critical Accounting Policies

25 Report of Independent Auditors

26 Consolidated Financial Statements
    26 Consolidated Statement of Income
    27 Consolidated Statement of Condition
    28 Consolidated Statement of Changes in
       Stockholders’ Equity
    29 Consolidated Statement of Cash Flows
    30 Notes to the Consolidated Financial Statements
Selected Financial Data
(Dollars in millions, except per share
data; per share data restated for 2-for-1                                                                                      96-01
                                                              2001
stock split in 2001; taxable equivalent)                                    2000          1999          1998          1997     CAGR
F o r t h e y e a r s e n d e d D e c e m b e r 31 ,
Operating Results:
Fee revenue:
                                                         $ 1,624
Servicing fees                                                         $ 1,425       $ 1,170       $ 1,024       $     861
                                                             511
Management fees                                                            581           600           480             391
                                                             368
Foreign exchange trading                                                   387           306           289             245
                                                             329
Processing fees and other                                                  272           236           204             176
                                                              2,832
Total fee revenue                                                           2,665         2,312         1,997         1,673      17%
                                                              1,082
Net interest revenue after provision for loan losses                          950           807           768           669      13
                                                              3,914
Total operating revenue                                                     3,615         3,119         2,765         2,342      16
                                                              2,867
Operating expenses                                                          2,644         2,336         2,068         1,734      15
                                                              1,047
Income before income taxes                                                   971           783           697           608       17
                                                                319
Income taxes                                                                 311           254           221           184
                                                                 67
Taxable equivalent adjustment                                                 65            40            40            44

                                                         $     661
Operating Earnings                                                     $     595     $     489     $     436     $     380       18

Operating earnings per share:
                                                         $     2.03
Basic                                                                  $     1.85    $     1.52    $     1.35    $     1.18      17
                                                               2.00
Diluted                                                                      1.81          1.49          1.33          1.16      18

                                                               .405
Cash dividends declared per share                                            .345          .300          .260          .220      16

                                                               18.2%
Operating return on equity                                                   20.3%         19.7%         20.2%         20.6%

Reported Results:
                                                         $ 3,864
Total revenue                                                          $ 3,615       $ 3,344       $ 2,765       $ 2,342         15
                                                             628
Net Income                                                                 595           619           436           380         17

Earnings per share:
                                                         $     1.94
Basic                                                                  $     1.85    $     1.93    $     1.35    $     1.18      16
                                                               1.90
Diluted                                                                      1.81          1.89          1.33          1.16      16

                                                               17.3%
Return on equity                                                             20.3%         25.0%         20.2%         20.6%

A s o f D e c e m b e r 31 ,
                                                         $69,896
Total assets                                                           $69,298       $60,896       $47,082       $37,975
                                                           1,217
Long-term debt                                                           1,219           921           922           774
                                                           3,845
Stockholders’ equity                                                     3,262         2,652         2,311         1,995
                                                           52.25
Closing price per share of common stock                                  62.11         36.53         35.06         29.09

                                                             19,753
Number of employees                                                        17,604        17,213        16,816        14,199

Operating results exclude significant, non-recurring special items to present the results and trends of the Corporation’s
ongoing business activities. For the year ended December 31, 2001, operating results exclude the write-off of State Street’s
total investment in Bridge Information Systems, Inc. of $50 million, equal to $33 million after tax, or $.10 per diluted share,
recorded in March 2001. For the year ended December 31, 1999, operating results exclude the gain on the sale of the com-
mercial banking business of $282 million, net of exit and other associated costs, and a one-time charge of $57 million
on sales of securities related to the repositioning of the investment portfolio. Combined, these items increased reported
net income by $130 million after tax, or $.40 per diluted share.
Results above include State Street’s retirement investment and benefits outsourcing services through March 31, 2000. On
April 1, 2000, those services were contributed to CitiStreet, a 50/50 joint venture accounted for using the equity method,
thereby reducing revenue and expenses subsequent to CitiStreet’s formation.

                                                                                                                                                                  1
                                                                                                                                       State Street Corporation
Management’s Discussion and Analysis of
                               Results of Operations and Financial Condition
                               Results of Operations
                               Summary
                               State Street recorded its 24th consecutive year of double-digit operating earnings-per-share growth in 2001.
                               State Street’s operating earnings per share were $2.00 in 2001, an increase of 10% over 2000 earnings per share of
                               $1.81. Total taxable-equivalent operating revenue was $3.9 billion, an increase of 8% from 2000. Operating earnings
                               were $661 million, up 11% from 2000 net income of $595 million. Operating return on stockholder’s equity
                               was 18.2%.
                               State Street’s 2001 reported earnings per share were $1.90, its reported net income was $628 million, and its
                               reported total taxable-equivalent revenue was $3.9 billion. Reported results for 2001 differ from operating
                               results, which exclude the write-off of State Street’s total investment in Bridge Information Systems, Inc.
                               (“Bridge”) of $50 million, equal to $33 million after tax, or $.10 per diluted share. In March 2001, following a
                               bankruptcy filing by Bridge, State Street determined that the value of this investment was permanently impaired.

                                                                                                                                                       '01
                                                                                                                                              '00       2.00
                                                                                                                                               1.81
                                                                                                                                     '99
                                                                                                                       '98
                                                                                                                                      1.49
                                                                                                         '97
                                                                                                                        1.33
                                                                                                          1.16


                               DILUTED OPERATING
                                                                      (Dollars)
                               EARNINGS PER SHARE


                               State Street’s primary financial goal is to achieve sustainable, real (inflation-adjusted) growth in earnings per
                               share. Over the last five years, diluted operating earnings per share increased at an 18% compound annual
                               growth rate.
                               In 2001, the Corporation’s total operating revenue was $3.9 billion, an increase of $299 million, or 8%, over 2000.
                               On April 1, 2000, State Street contributed its retirement investment and benefits outsourcing services to a 50/50
                               joint venture, CitiStreet, accounted for using the equity method, thereby reducing revenue and expenses of
                               State Street subsequent to CitiStreet’s formation. Adjusted to exclude the revenue and expenses of services
                               contributed to CitiStreet from the first quarter of 2000 (“adjusted for the formation of CitiStreet”), the growth
                               in total operating revenue was 10%.

                                                                                                                                                       '01
                                                                                                                                              '00
                                                                                                                                                        3,914
                                                                                                                                     '99       3,615
                                                                                                                       '98            3,119
                                                                                                         '97                                             1
                                                                                                                        2,765
                                                                                                          2,342
                                                                                                                                                         2
                                                                                                                                                         3
                                                                                                                                                         4
                                                                             (Dollars in millions)
                               TOTAL OPERATING REVENUE

                               1 Servicing fees 2 Management fees 3 Foreign exchange trading and processing fees and other revenue
                               4 Net interest revenue after provision for loan losses


                               In 2001, servicing fees and net interest revenue drove revenue growth. Growth in servicing fees primarily reflects
                               several large client wins installed starting in the latter half of 2000 and continuing throughout 2001, and a
                               significant increase in securities lending fees. Strength in securities lending revenue resulted primarily from

2   State Street Corporation
wider interest rate spreads in a favorable 2001 U.S. interest rate environment. Declines in equity market values
worldwide offset some of the growth in servicing fees. Both securities lending and net interest revenue benefited
from the unusual occurrence of eleven reductions in the U.S. federal funds target rate during 2001. Additionally,
growth in State Street’s balance sheet, primarily from clients’ investment activities, was a significant factor in
the growth of net interest revenue. Management fees were down 12%, reflecting declining equity values
worldwide. Foreign exchange trading revenue was down 5%, reflecting decreased currency volatility. Lower
management fees and foreign exchange trading revenue partially offset the growth in servicing fees and net
interest revenue.
Reducing the rate of expense growth was a key factor in State Street’s 2001 performance. State Street continues
to invest for the future by carefully pacing spending on strategic initiatives and technology projects that are
critical to long-term growth. Operating expenses were $2.9 billion, an increase of 8% over 2000. Adjusted for
the formation of CitiStreet, operating expenses grew 10%, significantly lower than the comparable 20% expense
growth in 2000. The 10% year-over-year growth in expenses reflects higher salaries and employee benefits
expense, partially offset by lower incentive-based compensation, and higher information systems and
communications expense.
State Street has two supporting financial goals, one for total revenue and one for return on stockholders’ equity.
State Street’s total revenue goal is 12.5% real compound annual growth from 2000 through 2010; although, as
has been true in the past, State Street does not expect to achieve that growth rate every year in the ten-year
period. State Street still expects to meet its goal over the stated period. Operating return on stockholders’ equity
for 2001 was 18.2%, exceeding State Street’s long-term goal of 18%.
State Street’s strategy of focusing on providing sophisticated global investors with a complete, integrated range
of products and services has proven successful for over two decades under varying economic and financial
conditions. State Street focuses on total client relationships. This focus results in a high rate of client retention,
cross-selling opportunities and recurring revenue. Services are integrated and priced based on each client’s total
business relationship. While most of State Street’s client services result in management or servicing fees, clients
use a wide variety of additional services that are recorded in their respective revenue categories, such as foreign
exchange trading revenue or net interest revenue. Management focuses on increasing total revenue.
State Street’s ability to serve clients’ expanding needs is critical to its success. Long-term, global trends driving
demand for State Street’s services remain robust and support continuing growth: ongoing convergence in the
financial services industry, a worldwide sense of urgency about the need for retirement security and a growing
trend by investment managers to outsource activities that are not part of their core competencies. By continuing
to invest in technology, integrated products and services that span the entire investment process, and expansion
into new markets, State Street is positioned to benefit from these trends.
State Street’s solid performance in 2001 was the result of strong new business with existing and new clients, a
diverse service offering, and market expertise that enabled State Street to take advantage of an unprecedented
interest rate environment, as well as the commitment and abilities of State Street’s global employee team.

Revenue
State Street is one of the world’s leading specialists in serving mutual funds, collective funds and pension plans.
The Corporation provides investment management and industry-leading technology and information services
to support financial strategies and transactions for sophisticated global investors. State Street has integrated
its products and services to meet client needs throughout every phase of the investment cycle. This integration
positions State Street to grow with its clients by providing additional products and services globally as client
requirements expand. State Street’s focus on total client relationships results in high client retention, cross-
selling opportunities and recurring revenue. During 2001, clients continued to increase the number of State
Street products they use. The Corporation’s 1,000 largest clients used an average of 7.3 products in 2001, up from

                                                                                                                                                    3
                                                                                                                         State Street Corporation
an average of 7.1 in 2000. The top 100 largest clients used an average of 11.3 products in 2001, up from an average
                               of 11.2 in 2000.
                               State Street benefits significantly from its ability to derive revenue from the transaction flows of clients. This
                               occurs through the management of cash positions, including deposit balances and other short-term investment
                               activities, using State Street’s balance sheet capacity. Significant foreign currency transaction volumes provide
                               potential for foreign exchange trading revenue as well.

                               Fee Revenue
                               Total operating fee revenue was $2.8 billion in 2001, compared to $2.7 billion in 2000, an increase of 6%. Adjusted
                               for the formation of CitiStreet, the growth in fee revenue was 8%.
                               Growth in servicing fees of $199 million, or 14%, was the primary contributor to the increase in fee revenue. This
                               growth primarily reflects several large client wins installed starting in the latter half of 2000 and continuing
                               throughout 2001, and strength in fee revenue from securities lending. Declines in equity market values
                               worldwide offset some of the growth in servicing fees. Management fees were down 5%, adjusted for the
                               formation of CitiStreet, reflecting the decline in the worldwide equity markets. Foreign exchange trading revenue
                               was down 5%, reflecting lower currency volatility, and processing fees and other revenue was up 21%, primarily
                               due to gains on the sales of investment securities.
                               Servicing and management fees are a function of several factors, including the mix and volume of assets under
                               custody and assets under management, securities positions held, and portfolio transactions, as well as types of
                               products and services used by clients. State Street estimates, based on a study conducted in 2000, that a 10%
                               increase or decrease in worldwide equity values would cause a corresponding change in State Street’s total
                               revenue of approximately 2%. If bond values were to increase or decrease by 10%, State Street would anticipate
                               a corresponding change of approximately 1% in its total revenue.
                               Securities lending revenue in 2001 increased approximately 40% over 2000. Securities lending revenue is
                               reflected in both servicing fees and management fees. Securities lending revenue is a function of the volume of
                               securities lent and interest rate spreads. While volumes increased in 2001, the year-over-year increase is
                               primarily due to wider interest rate spreads resulting from the unusual occurrence of eleven reductions in the
                               U.S. federal funds target rate during 2001.


                               FEE     REVENUE

                                                                                                                                                                Adjusted
                                                                                                                                                      Change     Change
                                                                                 2001(1)                                        1999(2)                           00-01(3)
                               (Dollars in millions)                                                     2000                                          00-01
                                                                              $1,624
                               Servicing fees                                                          $1,425                 $1,170                      14%        14%
                                                                                   511
                               Management fees                                                             581                      600                  (12)         (5)
                                                                                   368
                               Foreign exchange trading                                                    387                      306                   (5)         (5)
                                                                                   329
                               Processing fees and other                                                   272                      236                   21         21

                                                                              $2,832
                               Total fee revenue                                                       $2,665                 $2,312                       6          8

                               (1) 2001 results exclude the write-off of State Street’s total investment in Bridge of $50 million
                               (2) 1999 results exclude the one-time charge of $57 million related to the repositioning of the investment portfolio
                               (3) 2000 results adjusted for the formation of CitiStreet


4   State Street Corporation
Servicing Fees

In 2001, servicing fees were $1.6 billion, up 14% from 2000. Growth in servicing fees primarily reflects several
large client wins installed starting in the latter half of 2000 and continuing throughout 2001, and strength in
securities lending revenue. Declines in equity market values worldwide offset some of the growth in servicing
fees. State Street provides solutions to meet the needs of managers of mutual funds, collective funds, pension
and retirement plans and other institutional investors worldwide through offices and a global custodian network
that spans 100 geographic markets.
M u t u a l F u n d s a n d C o l l e c t i v e F u n d s Servicing fees include fee revenue from U.S. mutual funds,
collective funds worldwide, non-U.S. retirement plans and other non-U.S. investment pools. Products and
services provided include custody, accounting, daily pricing and administration; trustee and recordkeeping;
investment manager operations outsourcing; and securities lending. In 2001, revenue growth from servicing U.S.
mutual funds and collective funds was primarily due to new business from new and existing clients.
State Street is the largest mutual fund custodian and accounting agent in the United States. State Street provides
custody services for 44% of registered U.S. mutual funds and is distinct from other mutual fund service providers
because clients make extensive use of a number of related services, including accounting, daily pricing and fund
administration. The Corporation provides fund accounting and valuation services for more than four times the
assets serviced by the next largest accounting service provider. State Street calculates approximately 30% of the
U.S. mutual fund prices that appear daily in The Wall Street Journal.
A long-term revenue driver is the number of mutual funds the Corporation services. In 2001, the total number
of funds State Street serviced increased by 341, or 8%, to 4,680. There were 689 new funds serviced, 524 from
existing clients and 165 from new clients, partially offset by 348 funds no longer serviced due primarily to fund
liquidations and consolidations.
State Street is committed to expanding globally by serving the worldwide needs of both its U.S. and non-U.S.
clients. Growth in servicing revenue in Europe was primarily attributable to previously announced acquisitions,
alliances and new business in the United Kingdom. Growth in servicing fees in Asia/Pacific included fees from
new business, primarily in Japan.
In 2000, State Street announced plans to expand its services to investment managers to include operations outsourcing
services. Through these services, State Street provides global asset managers with a comprehensive suite of services,
from trade order management through settlement. Services include securities trade order processing, custodian
communications for settlements, accounting systems, and networks and information technology development.
U . S . P e n s i o n , I n s u r a n c e a n d O t h e r I n v e s t m e n t P o o l s State Street provides master trust, master
custody, securities lending, and performance, risk and compliance analytics to corporate and public pension
funds, other institutional retirement funds, insurance companies, foundations, endowments and corporate and
public treasurers. These clients make extensive use of many other products and services, including securities
lending, investment management, and foreign exchange and equity trade execution. In 2001, revenue growth
was driven primarily by increased securities lending revenue.
At 26% market share, State Street has a leading position in the market for servicing U.S. tax-exempt assets for
corporate and public pension funds. Additionally, State Street provides trust and valuation services for over 3,900
daily-priced, unitized defined contribution accounts, making State Street a leader in this market.


                                                                                                                                                                5
                                                                                                                                     State Street Corporation
state street corp stt_ar01

More Related Content

state street corp stt_ar01

  • 1. tate Street State Street Corporation December 31, 2001
  • 2. WORKING TOGETHER, THINKING AHEAD State Street is a world leader in serving the unique needs of sophisticated global investors. Powered by our technological savvy, deep understanding of global markets and ability to integrate services throughout the investment process, we provide our clients with business solutions that help them succeed in complex times. State Street has four core competencies: investment servicing, investment management, research and trading services. We draw on these capabilities to create integrated service solutions that increase our clients’ productivity and performance. Our clients think of us as a trusted partner because we are committed to developing solutions that meet their investment goals today and help them prepare for future challenges. With 19,800 employees working in offices in 22 countries, State Street serves clients in 100 markets around the world. At the close of 2001, State Street had total assets under custody of $6.2 trillion and assets under management of $775 billion. 1 Highlights 2 Letter to Our Stockholders 8 Ready for the Future 14 Financial Summary 20 Board of Directors 22 Senior Executive Group 23 Corporate Information 24 Worldwide Locations
  • 3. State Street ist ein weltweit führendes Unternehmen, das den speziellen Bedürfnissen anspruchsvoller globaler Investoren dient. Weil wir über starkes technisches Know-how verfügen, wie auch über solides Verständnis globaler Märkte und über die Fähigkeit, Dienstleistungen durch den Investitionsprozess zu integrieren, bieten wir unseren Kunden Geschäftslösungen an, die ihnen in anspruchsvollen Zeiten zum Erfolg verhelfen. State Street verfügt über vier Grundkompetenzen: Investment Servicing, Asset Management, Research sowie Trading. Aus diesen Fähigkeiten schöpfen wir, um integrierte Service-Lösungen zu erstellen, die sowohl die Produktivität wie auch die Leistung unserer Kunden erhöht. Weil wir uns verpflichten, Lösungen zu entwickeln, die ihren aktuellen Investitionszielen entsprechen und sie auf künftige Herausforderungen vorbereiten, betrachten uns unsere Kunden als vertrauenswürdige Partner. Unsere 19.800 Mitarbeiter in 22 Ländern betreuen Kunden auf der ganzen Welt in über 100 Märkten. Zum Jahresende 2001 verwahrte State Street US-$ 6,2 Billionen an Wertpapieranlagen und verwaltete Vermögensanlagen in Höhe von US-$ 775 Milliarden. 4 22 1 9,800 100 2001 6 2,000 7,750 State Street, est le leader mondial au service des besoins spécifiques des investisseurs haut de gamme de renommée internationale. Forts d’un savoir-faire technologique, d’une profonde compréhension des marchés internationaux et d’une répartition efficace de nos services tout au long du processus d’investissement, nous sommes à même de fournir à nos clients des solutions grâce auxquelles ils seront au rendez-vous de la compétitivité en ces temps de forte instabilité. State Street organise son activité autour de quatre axes fondamentaux : le suivi, la recherche, la gestion d’investissements et les transactions boursières. Grâce à l’ensemble de nos compétences, nous sommes en mesure d’imaginer des solutions complètes visant à améliorer la productivité et les performances de nos clients. Ces derniers nous considèrent comme un partenaire d’une extrême fiabilité parce que nous nous engageons à développer des solutions en matière de placements adaptées à leurs objectifs actuels, et parce que nous les aidons à se préparer pour les défis à venir. Grâce à ses 19 800 salariés, répartis dans 22 pays différents, State Street assiste des clients partout dans le monde, c’est-à-dire sur plus de 100 marchés. Au terme de l’année 2001, State Street totalisait 6,2 billions de dollars américains en nombre d’actifs sous dépôt et 775 milliards de dollars américains d’actifs sous gestion.
  • 4. State Street es una empresa líder mundial que sirve las intrincadas y únicas necesidades de sofisticados inversionistas globales. Nuestra empresa deriva su fuerza de una combinación de conocimiento tecnológico, un profundo entendimiento de los mercados globales y la capacidad de integrar servicios que abarcan todos los aspectos del proceso de inversión. Proveemos a nuestros clientes con soluciones para la inversión de recursos y los ayudamos a que dichas inversiones se realicen exitosamente en tiempos muy complejos. State Street ofrece cuatro pilares fundamentales: servicios de inversión, administración de inversiones, investigación y transacciones. Basándonos en estos cimientos, creamos soluciones integradas de servicio que permiten incrementar la productividad y el desempeño de nuestros clientes. Nuestros clientes nos consideran un socio confiable porque estamos comprometidos a desarrollar soluciones que se ajusten a sus metas de inversión actual, ayudándolos al mismo tiempo a prepararse para afrontar retos venideros. Con 19.800 empleados esparcidos por 22 países en nuestras oficinas, State Street presta sus servicios a clientes de todo el mundo en más de 100 mercados. A la clausura de operaciones del 2001, la totalidad de activos bajo custodia en State Street sumaron 6,2 billones de dólares estadounidenses, mientras que los activos administrados por State Street alcanzaron los 775 miles de millones de dólares estadounidenses. 19,800 62,000 7,750
  • 5. OF OUR 209TH YEAR HIGHLIGHTS (Dollars in millions, except per share data; taxable equivalent) 2001(1) 2000 Change Total Operating Revenue $ 3,914 $ 3,615 8% Operating Earnings 661 595 11 Operating Earnings Per Share:(3) Basic 2.03 1.85 10 Diluted 2.00 1.81 10 Cash Dividends Declared Per Share(3) .405 .345 17 Operating return on Equity 18.2% 20.3% '01(1) '00 3,914 '99(2) 3,615 3,119 '92 1,052 R E V E N U E (Dollars in millions) TOTAL '01(1) '00 2.00 1.81 '99(2) 1.49 '92 .51 D I L U T E D E A R N I N G S P E R S H A R E (3) (1) Excluded from operating results for the year ended December 31, 2001, is the write-off of State Street’s total investment in Bridge Information Systems, Inc. of $50 million, equal to $33 million after tax, or $.10 per diluted share, recorded in March 2001. (2) Excluded from operating results for the year ended December 31, 1999, is the gain on the sale of the commercial banking business of $282 million, net of exit and other associated costs, and a one-time charge of $57 million on sales of securities related to the repositioning of the investment portfolio. Combined, these items increased reported net income by $130 million after tax, or $.40 per diluted share. (3) Per share amounts have been restated to reflect the 2-for-1 stock split in the form of a 100% stock dividend distributed on May 30, 2001, to stockholders of record as of April 30, 2001.
  • 6. TO OUR STOCKHOLDERS The year 2001 was marked by unique challenges and opportunities. The environment in which we operated was difficult in many ways. Economic growth slowed significantly in all regions of the world. Stock market performance was weak for the second consecutive year – the first such downturn in the United States since 1973, and the first in global markets since 1982. The terrorist attacks and unprecedented market disruption in September filled the world with political uncertainty and a sense of anxiety. Despite these considerable challenges, State Street turned in strong performance in many areas in 2001. We achieved our 24th consecutive year of double-digit growth in operating earnings per share. We brought in an impressive amount of new business in all products in all parts of the world. We launched transfer agency systems in Luxembourg and the United Kingdom. We were recognized as a great place for women to work. We devoted 1.5% of our pre-tax profits to support community needs throughout the world as we have for more than 20 years. And we continued to develop as a team. All in all, 2001 was a year of considerable achievement for State Street. Financial Results Our primary financial goal is to achieve sustainable real growth in earnings per share. In 2001, operating earnings per share increased 10%, to $2.00 on a diluted basis. Our ten-year growth rate for operating earnings per share is 16% compounded annually. Operating revenue, driven by new business from existing and new clients, increased 8%, to $3.9 billion, in 2001. In the fourth quarter, we achieved $1 billion in revenue – a record result. Facing a challenging environment, we tempered our year-over-year expense growth to 8%, in step with revenue growth, while continuing to invest in the technology and infrastructure needed to drive our future growth. 2 State Street Corporation
  • 7. We continue to differentiate ourselves by stating a goal for revenue growth. We have reaffirmed our goal of achieving 12.5% real compound annual growth from 2000 through 2010, although, as has been true in the past, we do not expect to achieve that rate every year in the ten-year period. Our supporting goal for return on stockholders’ equity is to achieve 18% annually. In 2001, we exceeded that goal by delivering operating ROE of 18.2%. We distributed a two-for-one stock split in the form of a 100% stock dividend on May 30, 2001, and we increased our quarterly cash dividend declared twice during the year for the 23rd consecutive year. Cash dividends declared in 2001 increased 17% from the prior year.
  • 8. ex lobalizatio Seizing Opportunity For me personally, our ability to perform so well in such a difficult year served to crystallize some important conclusions. First, I believe that our fundamental strategy – focusing on serving the needs of sophisticated investors around the world – is sound. Second, I believe that we have enormous opportunities to leverage our leadership in financial services and grow around the world. State Street clearly distinguished itself in the marketplace in 2001. Most notably, we did an excellent job of serving our clients. State Street people are passionately committed to making our clients successful. We use our insight and technology to integrate our products and services into solutions that work effectively for them. We have the vision and fortitude to deliver excellence consistently, day in and day out – as is evidenced by the experience of clients such as Federated Investors, who has been growing with us for more than 40 years. Of equal importance is the fact that we have positioned ourselves to benefit from some very powerful global trends. These trends are (1) ongoing convergence in the financial services industry, (2) a worldwide sense of urgency about the need for retirement security, and (3) a growing trend by investment managers to outsource activities that aren’t part of their core competencies. It is not enough simply to be “in the right place at the right time.” To benefit fully from the effects of these trends, State Street is thinking ahead in dynamic and creative ways. Then we implement – and State Street is an expert at getting things done. 4 State Street Corporation
  • 9. pe n Convergence in the financial services industry provides State Street with an opportunity to assume a leadership role. The new global players who are emerging are looking for a partner who can offer a full range of integrated service solutions and is highly experienced in dealing with financial operations worldwide – including different regulations and technologies. These requirements coincide perfectly with State Street’s core strengths – strengths we have proven in serving clients such as Chuo Mitsui, Merrill Lynch and UBSWarburg. Another global trend that benefits State Street is a growing sense of urgency about retirement security, driven by increasing life expectancy in most parts of the world. This trend is putting pressure on retirement systems, leading governments and employers to devise new strategies to help workers invest for their futures. These efforts are creating growing pools of retirement assets, which must be managed and serviced. State Street’s deep expertise in global financial markets, as well as our position as a world leader in pension fund servicing – is a strong advantage for us. We participate by providing services to investment managers and by managing assets ourselves through innovative solutions such as exchange-traded funds (ETFs) and enhanced indexing. The move toward operations outsourcing is another area in which State Street has a clear advantage. We are creating a scaleable solution for investment managers who need complete servicing of their back and middle office operations. Our success with Pacific Investment Management Company (PIMCO) and Scottish Widows has made us the leading candidate in current searches. 5 State Street Corporation
  • 10. rien Strategic Focus We are deepening our position as the trusted partner of sophisticated investors by building on our strengths. Among these strengths are: A strategic client orientation Partnering with clients to deliver State Street’s best capabilities in responsive, trust-based relationships that meet true client needs. A global focus Integrating service delivery and providing for local differences on behalf of clients everywhere. A technological advantage Using innovative technology to deliver efficient, client-friendly solutions. One of State Street’s greatest assets is the quality of our people. Our achievement of solid results this year in the face of such difficult economic and market conditions is a testament to our team’s focus, commitment to client service and integrity. In December 2001, our Board of Directors elected Ron Logue as President and Chief Operating Officer of State Street. Ron and I have worked together closely for more than a decade, and I look forward to continuing our partnership. Ron’s strong client focus, his understanding of the potential offered by technology and his proven ability to deliver both innovation and reliability contribute significantly to our success in maintaining our competitive advantage and advancing our global leadership. 6 State Street Corporation
  • 11. ce I am very pleased with our performance in the past year and am both confident and enthusiastic about our prospects for the future. I want to thank our 19,800 employees in 22 countries for their hard work. I also want to thank our stockholders for their continued support. In 2002 and beyond, we will seize more and more opportunities to grow, to deliver value to our clients and stockholders and to continue to build on State Street’s reputation as a world leader in financial services. Sincerely, David A. Spina Chairman and Chief Executive Officer from left to right: Ronald E. Logue President and Chief Operating Officer John R. Towers Vice Chairman and Chief Administrative Officer David A. Spina Chairman and Chief Executive Officer
  • 12. READY FOR THE FUTURE State Street is 210 years old in 2002. Over two centuries of experience in international financial markets is a great strength for us. As a leader in the evolution of these markets, we have a rich perspective and a depth of practical expertise that are invaluable to our clients. Experience alone, however, is no guarantee of success. State Street has continued to grow and win because we have consistently planned for the future – designing innovative solutions persp so our clients can succeed in rapidly changing business and technological environments. 8 State Street Corporation
  • 13. Today, State Street offers sophisticated investors the solutions they need to achieve their goals in a quickly changing and uncertain global environment. Our broad capabilities enable us to provide seamless management of investment information, highly reliable investment servicing solutions, performance-oriented investment management and cutting-edge research and trading services to investors around the world. Our other offering – perhaps less tangible but immeasurably powerful – is our ability to ective share our strengths with clients through collaborative working partnerships. 9 State Street Corporation
  • 14. We Are Global Being a truly global firm requires a lot more than simply having offices in multiple countries. Our clients need a global infrastructure that is so complete and so interconnected that they can view the world as one seamless marketplace. State Street is an expert in supplying global applications and adapting for differences in local markets and cultures. As a result, more and more investment managers worldwide are choosing to outsource non-core activities to State Street. Partnering with us in this way enables them to focus more productively and confidently on their core businesses. Clients around the world also rely on us for the expertise that helps them address the challenges created by quickly expanding businesses and changing industry regulations. In China, for example, we’re working with our partner, the Industrial Commercial Bank of China, and the Chinese government to shape the country’s emerging mutual fund business. In Brazil, we are collaborating with Banco Itau to expand the bank’s services for pension funds and multinational companies, and to help design new services. We Are Experts in Applying Technology State Street clients count on us to use innovative technology to deliver efficient, client-friendly solutions. We are committed to investing in technology and technology professionals and have been for decades. As a result, State Street’s technology today is open, reliable, scaleable and global – enabling us to support a wide range of investment strategies. One reason for our technological edge is our industry-leading, multi-currency accounting system – among the most robust in the world. Our unique capability has proven particularly important to investment clients such as AMVESCAP, Barclays Capital and GE Asset Management (GEAM), whose strategies lead them to offer 10 State Street Corporation
  • 15. multiple investment products across many markets and time zones. As the largest net asset value calculator in the United States, we supply over 7,000 multi-currency daily pricing valuations to U.S.-registered mutual funds. We also calculate net asset values for nearly 3,500 retirement funds every day. Our clients count on our people to help them apply technology to their businesses in new ways. In addition to consulting to individual clients about technology-related issues, State Street has established a reputation as a thought leader in the use of new technologies in world financial markets. In China, for example, we recently signed a memorandum of understanding with Zhejiang University, located in Hangzhou, Zhejiang Province to participate in the creation of a technology center jointly operated by State Street and the University. State Street’s commitment to technology is evidenced by our recent inclusion in Computerworld Magazine’s annual ranking of “the top 100 places to work for information technology professionals.” We are honored to be considered one of the great global technology companies. 11 State Street Corporation
  • 16. Our Range of Services is Fully Integrated True integration is a key advantage to the success of sophisticated investors in today’s complex financial markets. State Street works with clients as a collaborative partner to assemble complete solutions that cross all aspects of the investment process. We deliver these solutions in responsive, trust-based relationships that meet our clients’ precise needs. The need for this level of integration and capability is increasing most dramatically in Europe. From our Luxembourg office, the world’s second-largest mutual fund market and Europe’s largest cross-border investment center, we have been instrumental in meeting the unique requirements of investment managers who wish to distribute and manage funds in Europe, Latin America and Japan. In 2001, State Street worked side-by-side with many new clients to develop integrated investment servicing solutions. These clients included Lord Abbett, the New York State Teachers’ Retirement System (NYSTRS) and Philips Pensioenfonds (Philips Electronics N.V.). We are providing an expanded spectrum of integrated services to clients of long standing as well — companies such as ABP Investments (Alegemen Burgerlijk Pensioenfonds), California Public Employees’ Retirement Systems (CalPERS), the Government Pension Investment Fund (formerly Nenpuku), Merrill Lynch and UBSWarburg. 12 State Street Corporation
  • 17. We Manage with a Long-Term View Our clients tell us they value our clear point of view about the way financial markets will evolve, and our plans for seizing opportunities that will come with changes in investment climates, vehicles, technologies and regulations. Our insight into global markets gives us a competitive edge in developing investment servicing solutions that are reliable and accurate, flexible and scaleable. We are continually enhancing our acknowledged industry-leading electronic trading platforms and investment research services. In our investment management business, we offer a broad range of investment styles and capabilities. State Street’s ability to think ahead is demonstrated by our development and adoption of new investment products. For example, we were one of the architects of exchange-traded funds (ETFs) and remain the investment manager and trustee for the first and still the largest ETF - the S&P 500 SPDR (“Spider”) trust, launched in partnership with the American Stock Exchange. No other company can offer the type of market intelligence that State Street provides to our clients through State Street Global Link.® Global Link is a powerful online worldwide network that combines proprietary market research, portfolio analytics and electronic trading technology to support clients’ decision making processes, maximize their efficiency, facilitate trading, reduce risk and optimize returns. Today, 54 of the world’s 100 largest money managers use Global Link. We are well positioned for continued growth. We remain committed to delivering the highest-quality solutions to our clients. We remain committed to delivering value to our stockholders. With a heritage of leadership and innovation, State Street is ready for the future. 13 State Street Corporation
  • 18. FINANCIAL SUMMARY SELECTED FINANCIAL DATA (Dollars in millions, except per share data; per share data 96-01 restated for 2-for-1 stock split in 2001; taxable equivalent) 2001 2000 1999 1998 1997 CAGR F o r t h e y e a r s e n d e d D e c e m b e r 31 , Operating Results: Fee revenue: Servicing fees $ 1,624 $ 1,425 $ 1,170 $ 1,024 $ 861 Management fees 511 581 600 480 391 Foreign exchange trading 368 387 306 289 245 Processing fees and other 329 272 236 204 176 Total fee revenue 2,832 2,665 2,312 1,997 1,673 17% Net interest revenue after provision for loan losses 1,082 950 807 768 669 13 Total operating revenue 3,914 3,615 3,119 2,765 2,342 16 Operating expenses 2,867 2,644 2,336 2,068 1,734 15 Income before income taxes 1,047 971 783 697 608 17 Income taxes 319 311 254 221 184 Taxable equivalent adjustment 67 65 40 40 44 Operating earnings $ 661 $ 595 $ 489 $ 436 $ 380 18 Operating earnings per share: Basic $ 2.03 $ 1.85 $ 1.52 $ 1.35 $ 1.18 17 Diluted 2.00 1.81 1.49 1.33 1.16 18 Cash dividends declared per share .405 .345 .300 .260 .220 16 Operating return on equity 18.2% 20.3% 19.7% 20.2% 20.6% Reported Results: Total revenue $ 3,864 $ 3,615 $ 3,344 $ 2,765 $ 2,342 15 Net Income 628 595 619 436 380 17 Earnings per share: Basic $ 1.94 $ 1.85 $ 1.93 $ 1.35 $ 1.18 16 Diluted 1.90 1.81 1.89 1.33 1.16 16 Return on equity 17.3% 20.3% 25.0% 20.2% 20.6% A s o f D e c e m b e r 31 , Total assets $ 69,896 $ 69,298 $ 60,896 $ 47,082 $ 37,975 Long-term debt 1,217 1,219 921 922 774 Stockholders’ equity 3,845 3,262 2,652 2,311 1,995 Closing price per share of common stock 52.25 62.11 36.53 35.06 29.09 Number of employees 19,753 17,604 17,213 16,816 14,199 Operating results exclude significant, non-recurring special items to present the results and trends of the Corporation’s ongoing business activities. For the year ended December 31, 2001, operating results exclude the write-off of State Street’s total investment in Bridge Information Systems, Inc. of $50 million, equal to $33 million after tax, or $.10 per diluted share, recorded in March 2001. For the year ended December 31, 1999, operating results exclude the gain on the sale of the commercial banking business of $282 million, net of exit and other associated costs, and a one-time charge of $57 million on sales of securities related to the repositioning of the investment portfolio. Combined, these items increased reported net income by $130 million after tax, or $.40 per diluted share. Results above include State Street’s retirement investment and benefits outsourcing services through March 31, 2000. On April 1, 2000, those services were contributed to CitiStreet, a 50/50 joint venture accounted for using the equity method, thereby reducing revenue and expenses subsequent to CitiStreet’s formation. 14 State Street Corporation
  • 19. Summary of Operations State Street recorded its 24th consecutive year of double-digit operating earnings-per-share growth in 2001. State Street’s operating earnings per share were $2.00 in 2001, an increase of 10% over 2000 earnings per share of $1.81. Total taxable-equivalent operating revenue was $3.9 billion, an increase of 8% from 2000. Operating earnings were $661 million, up 11% from 2000 net income of $595 million. Operating return on stockholder’s equity was 18.2%. State Street’s 2001 reported earnings per share were $1.90, its reported net income was $628 million, and its reported total taxable-equivalent revenue was $3.9 billion. Reported results for 2001 differ from operating results, which exclude the write-off of State Street’s total investment in Bridge Information Systems, Inc. (“Bridge”) of $50 million, equal to $33 million after tax, or $.10 per diluted share. In March 2001, following a bankruptcy filing by Bridge, State Street determined that the value of this investment was permanently impaired. '01 '00 2.00 1.81 '99 '98 1.49 '97 1.33 1.16 DILUTED OPERATING E A R N I N G S P E R S H A R E (Dollars) State Street’s primary financial goal is to achieve sustainable, real (inflation-adjusted) growth in earnings per share. Over the last five years, diluted operating earnings per share increased at an 18% compound annual growth rate. In 2001, the Corporation’s total operating revenue was $3.9 billion, an increase of $299 million, or 8%, over 2000. On April 1, 2000, State Street contributed its retirement investment and benefits outsourcing services to a 50/50 joint venture, CitiStreet, accounted for using the equity method, thereby reducing revenue and expenses of State Street subsequent to CitiStreet’s formation. Adjusted to exclude the revenue and expenses of services contributed to CitiStreet from the first quarter of 2000 (“adjusted for the formation of CitiStreet”), the growth in total operating revenue was 10%. '01 '00 3,914 '99 3,615 '98 3,119 '97 1 2,765 2,342 2 3 4 R E V E N U E (Dollars in millions) TOTAL OPERATING 1 Servicing fees 2 Management fees 3 Foreign exchange trading and processing fees and other revenue 4 Net interest revenue after provision for loan losses 15 State Street Corporation

  • 20. Summary (cont’d) In 2001, servicing fees and net interest revenue drove revenue growth. Growth in servicing fees primarily reflects several large client wins installed starting in the latter half of 2000 and continuing throughout 2001, and a significant increase in securities lending revenue fees. Strength in securities lending revenue resulted primarily from wider interest rate spreads in a favorable 2001 U.S. interest rate environment. Declines in equity market values worldwide offset some of the growth in servicing fees. Both securities lending and net interest revenue benefited from the unusual occurrence of eleven reductions in the U.S. federal funds target rate during 2001. Additionally, growth in State Street’s balance sheet, primarily from clients’ investment activities, was a significant factor in the growth of net interest revenue. Management fees were down 12%, reflecting declining equity values worldwide. Foreign exchange trading revenue was down 5%, reflecting decreased currency volatility. Lower management fees and foreign exchange trading revenue partially offset the growth in servicing fees and net interest revenue. Reducing the rate of expense growth was a key factor in State Street’s 2001 performance. State Street continues to invest for the future by carefully pacing spending on strategic initiatives and technology projects that are critical to long-term growth. Operating expenses were $2.9 billion, an increase of 8% over 2000. Adjusted for the formation of CitiStreet, operating expenses grew 10%, significantly lower than the comparable 20% expense growth in 2000. The 10% year-over-year growth in expenses reflects higher salaries and employee benefits expense, partially offset by lower incentive-based compensation, and higher information systems and communications expense. State Street has two supporting financial goals, one for total revenue and one for return on stockholders’ equity. State Street’s total revenue goal is 12.5% real compound annual growth from 2000 through 2010; although, as has been true in the past, State Street does not expect to achieve that growth rate every year in the ten-year period. State Street still expects to meet its goal over the stated period. Operating return on stockholders’ equity for 2001 was 18.2%, exceeding State Street’s long-term goal of 18%. State Street’s strategy of focusing on providing sophisticated global investors with a complete, integrated range of products and services has proven successful for over two decades under varying economic and financial conditions. State Street focuses on total client relationships. This focus results in a high rate of client retention, cross-selling opportunities and recurring revenue. Services are integrated and priced based on each client’s total business relationship. While most of State Street’s client services result in management or servicing fees, clients use a wide variety of additional services that are recorded in their respective revenue categories, such as foreign exchange trading revenue or net interest revenue. Management focuses on increasing total revenue. State Street’s ability to serve clients’ expanding needs is critical to its success. Long-term, global trends driving demand for State Street’s services remain robust and support continuing growth: ongoing convergence in the financial services industry, a worldwide sense of urgency about the need for retirement security and a growing trend by investment managers to outsource activities that are not part of their core competencies. By continuing to invest in technology, integrated products and services that span the entire investment process, and expansion into new markets, State Street is positioned to benefit from these trends. State Street’s solid performance in 2001 was the result of strong new business with existing and new clients, a diverse service offering, and market expertise that enabled State Street to take advantage of an unprecedented interest rate environment, as well as the commitment and abilities of State Street’s global employee team. 16 State Street Corporation
  • 21. Report of Independent Auditors The Stockholders and Board of Directors State Street Corporation We have audited, in accordance with auditing standards generally accepted in the United States, the consolidated statement of condition of State Street Corporation at December 31, 2001 and 2000 and the related consolidated statements of income, changes in stockholders’ equity, and cash flows for each of the three years in the period ended December 31, 2001 (not presented separately herein) and in our report dated January 16, 2002, we expressed an unqualified opinion on those consolidated financial statements. In our opinion, the information set forth in the accompanying condensed consolidated financial statements is fairly stated in all material respects in relation to the consolidated financial statements from which it has been derived. Boston, Massachusetts January 16, 2002 17 State Street Corporation

  • 22. Condensed Consolidated Financial Statements CONSOLIDATED STATEMENT OF INCOME (Dollars in millions, except per share data) Years ended December 31, 2001 2000 1999 Fee Revenue Servicing fees $ 1,624 $ 1,425 $ 1,170 Management fees 511 581 600 Foreign exchange trading 368 387 306 Processing fees and other 279 272 179 Total Fee Revenue 2,782 2,665 2,255 Net Interest Revenue Interest revenue 2,855 3,256 2,437 Interest expense 1,830 2,362 1,656 Net interest revenue 1,025 894 781 Provision for loan losses 10 9 14 Net interest revenue after provision for loan losses 1,015 885 767 Gain on sale of commercial banking business, net of exit and other associated costs 282 Total Revenue 3,797 3,550 3,304 Operating Expenses Salaries and employee benefits 1,663 1,524 1,313 Information systems and communications 365 305 287 Transaction processing services 247 268 237 Occupancy 229 201 188 Other 363 346 311 Total operating expenses 2,867 2,644 2,336 Income before income taxes 930 906 968 Income taxes 302 311 349 Net Income $ 628 $ 595 $ 619 E a r n i n g s Pe r S h a r e Basic $ 1.94 $ 1.85 $ 1.93 Diluted 1.90 1.81 1.89 Average Shares Outstanding (in thousands) Basic 325,030 321,678 321,320 Diluted 330,492 328,088 327,503 Refer to State Street Corporation’s 2001 Financial Review for a complete set of consolidated financial statements. 18 State Street Corporation
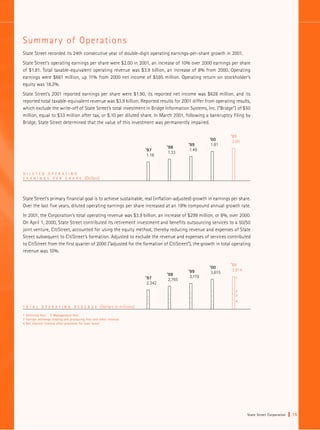
  • 23. CONSOLIDATED STATEMENT OF CONDITION (Dollars in millions) As of December 31, 2001 2000 Assets Cash and due from banks $ 1,651 $ 1,618 Interest-bearing deposits with banks 20,317 21,295 Securities purchased under resale agreements and securities borrowed 16,680 21,134 Federal funds sold 650 Trading account assets 994 1,004 Investment securities (including securities pledged of $9,006 and $7,152) 20,781 13,740 Loans (less allowance of $58 and $57) 5,283 5,216 Premises and equipment 829 726 Accrued income receivable 880 845 Other assets 2,481 3,070 Total Assets $ 69,896 $ 69,298 Liabilities Deposits: Interest-bearing — U.S. $ 2,753 $ 2,241 Noninterest-bearing 9,390 10,009 Interest-bearing — Non-U.S. 26,416 25,687 Total deposits 38,559 37,937 Securities sold under repurchase agreements 19,006 21,351 Federal funds purchased 3,315 955 Other short-term borrowings 1,012 632 Accrued taxes and other expenses 1,582 1,431 Other liabilities 1,360 2,511 Long-term debt 1,217 1,219 Total Liabilities 66,051 66,036 Stockholders’ Equity Preferred stock, no par: authorized 3,500,000; issued none Common stock, $1 par: authorized 500,000,000; issued 329,999,000 and 167,219,000 330 167 Surplus 110 69 Retained earnings 3,612 3,278 Other unrealized comprehensive income (loss) 70 (1) Treasury stock, at cost (6,329,000 and 5,508,000 shares) (277) (251) Total Stockholders’ Equity 3,845 3,262 Total Liabilities and Stockholders’ Equity $ 69,896 $ 69,298 Refer to State Street Corporation’s 2001 Financial Review for a complete set of consolidated financial statements. 19 State Street Corporation
  • 24. DIRECTORS 1 2 3 4 5 10 11 12 13 14 1 David A. Spina 5 Nader F. Darehshori 8 Linda A. Hill Chairman and Chief Executive Officer Chairman, President and Chief Executive Officer, Wallace Brett Donham Professor of Business Administration, Houghton Mifflin Company Harvard Business School 2 Tenley E. Albright, M.D. 6 Arthur L. Goldstein 9 John M. Kucharski Chairman, Western Resources, Inc. Chairman and Chief Executive Officer, Retired Chairman and Chief Executive Officer, EG&G, Inc. Ionics, Incorporated 3 I. MacAllister Booth 10 Charles R. LaMantia Retired Chairman, President and Chief Executive Officer, 7 David P. Gruber Polaroid Corporation Retired Chairman and Chief Executive Officer, Retired Chairman and Chief Executive Officer, Arthur D. Little, Inc. Wyman-Gordon Company 4 Truman S. Casner Of Counsel, Ropes & Gray 20 State Street Corporation
  • 25. 9 6 7 8 16 15 17 18 11 Ronald E. Logue 14 Bernard W. Reznicek 17 Diana Chapman Walsh President and Chief Operating Officer President, Premier Group; National Director — Utility President, Wellesley College Marketing, Central States Indemnity Company of Omaha 12 Dennis J. Picard 18 Robert E. Weissman 15 Richard P. Sergel Chairman Emeritus, Raytheon Company Chairman, Shelburne Investments President and Chief Executive Officer, National Grid USA 13 Alfred Poe Personal Investor 16 Gregory L. Summe Chairman, President, and Chief Executive Officer, PerkinElmer, Inc. 21 State Street Corporation
  • 26. SENIOR EXECUTIVE GROUP David A. Spina* Maureen Scannell Bateman* Chairman and Chief Executive Officer Executive Vice President and General Counsel Ronald E. Logue* Joseph W. Chow President and Chief Operating Officer Executive Vice President John R. Towers* Luis J. de Ocejo Vice Chairman and Executive Vice President Chief Administrative Officer John A. Fiore Executive Vice President and Chief Information Officer Joseph L. Hooley Timothy B. Harbert* Executive Vice President Executive Vice President, Chairman and Chief Executive Officer, Ronald L. O’Kelley* State Street Global Advisors Executive Vice President, Chief Financial Officer and Treasurer Stanley W. Shelton Executive Vice President Chairman Emeritus William S. Edgerly Chairman, State Street Corporation 1976-1992 * Designated as executive officers for SEC and IRS purposes 22 State Street Corporation
  • 27. INFORMATION Corporate Headquarters Stockholder Information State Street Corporation For timely information about corporate 225 Franklin Street financial results and other matters of Boston, Massachusetts 02110-2804 interest to stockholders, and to request copies of our news releases and financial Website: www.statestreet.com reports by fax or mail, please visit our General inquiries: +1 617 786 3000 website at: Annual Meeting www.statestreet.com/stockholder Wednesday, April 17, 2002, 10:00 a.m. at or call 877 639 7788 toll-free in the United Corporate Headquarters States and Canada, or +1 402 573 3644 Transfer Agent from other countries. These services are Registered stockholders wishing to available 24 hours a day, seven days a week. change name or address information on For copies of State Street’s Form 10-K, their shares, transfer ownership of stock, Form 10-Q, quarterly financial releases, or deposit certificates, report lost certificates, additional copies of this annual report, consolidate accounts, authorize direct please visit State Street’s website, call State deposit of dividends, or receive information Street’s stockholder services telephone on State Street’s dividend reinvestment line described above, or write to: plan should contact: Shareholder.com EquiServe Trust Company, N.A. ref: State Street Corporation P.O. Box 43011 12 Clocktower Place Providence, Rhode Island 02940-3011 Maynard, Massachusetts 01754-2597 800 426 5523 Website: www.equiserve.com Investors and analysts interested in additional financial information may Stock Listing contact State Street’s Investor Relations State Street’s common stock is listed department at Corporate Headquarters, on the New York Stock Exchange, ticker telephone +1 617 664 3477. symbol: STT, and on the Boston and Pacific Stock Exchanges. 23 State Street Corporation
  • 28. LOCATIONS State Street's clients are among the most sophisticated investors in the world — and their growth strategies are among the most complex. Through our offices in 22 countries and a global network covering 100 mature and emerging geographic markets, we can help them capitalize on investment opportunities wherever they arise. Australia Netherlands United States Melbourne, Southbank, Sydney Amsterdam California Alameda, Los Angeles, Newport Beach, Belgium Netherlands Antilles Sacramento, San Francisco, San Marino Brussels Willemstad—Curaçao Connecticut Hartford, Greenwich Canada New Zealand Florida Montreal, Toronto, Vancouver Wellington Boca Raton, Naples Cayman Islands People’s Republic of China Georgia George Town Hong Kong Atlanta Illinois Chile Singapore Chicago Santiago Singapore Iowa Des Moines Czech Republic South Korea Massachusetts Prague Seoul Boston, Milton, Norwood, Osterville, Quincy, Westborough, Westwood France Switzerland Michigan Montpellier, Paris Zurich Lansing Germany Taiwan Missouri Frankfurt, Munich Taipei Kansas City, St. Louis New Hampshire Ireland United Arab Emirates Manchester, North Hampton Dublin Dubai New Jersey Japan United Kingdom Princeton Tokyo Andover, Edinburgh, Guernsey, Jersey, New York London, Windsor New York, White Plains Luxembourg North Carolina Luxembourg Charlotte, Winston-Salem 24 State Street Corporation
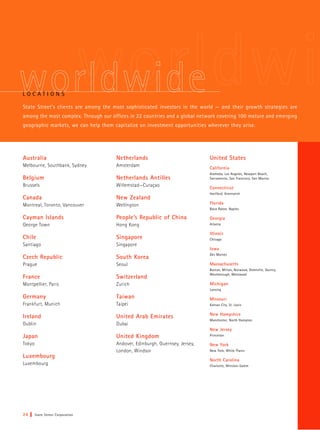
  • 30. S For more information State Street Corporation 225 Franklin Street Boston, Massachusetts 02110 +1 617 786 3000 www.statestreet.com © 2002 State Street Corporation SSBCM-AR-01
  • 32. 2001 FINANCIAL REVIEW 1 Selected Financial Data 2 Management's Discussion and Analysis of Results of Operations and Financial Condition 2 Results of Operations 16 Financial Condition 23 Critical Accounting Policies 25 Report of Independent Auditors 26 Consolidated Financial Statements 26 Consolidated Statement of Income 27 Consolidated Statement of Condition 28 Consolidated Statement of Changes in Stockholders’ Equity 29 Consolidated Statement of Cash Flows 30 Notes to the Consolidated Financial Statements
  • 33. Selected Financial Data (Dollars in millions, except per share data; per share data restated for 2-for-1 96-01 2001 stock split in 2001; taxable equivalent) 2000 1999 1998 1997 CAGR F o r t h e y e a r s e n d e d D e c e m b e r 31 , Operating Results: Fee revenue: $ 1,624 Servicing fees $ 1,425 $ 1,170 $ 1,024 $ 861 511 Management fees 581 600 480 391 368 Foreign exchange trading 387 306 289 245 329 Processing fees and other 272 236 204 176 2,832 Total fee revenue 2,665 2,312 1,997 1,673 17% 1,082 Net interest revenue after provision for loan losses 950 807 768 669 13 3,914 Total operating revenue 3,615 3,119 2,765 2,342 16 2,867 Operating expenses 2,644 2,336 2,068 1,734 15 1,047 Income before income taxes 971 783 697 608 17 319 Income taxes 311 254 221 184 67 Taxable equivalent adjustment 65 40 40 44 $ 661 Operating Earnings $ 595 $ 489 $ 436 $ 380 18 Operating earnings per share: $ 2.03 Basic $ 1.85 $ 1.52 $ 1.35 $ 1.18 17 2.00 Diluted 1.81 1.49 1.33 1.16 18 .405 Cash dividends declared per share .345 .300 .260 .220 16 18.2% Operating return on equity 20.3% 19.7% 20.2% 20.6% Reported Results: $ 3,864 Total revenue $ 3,615 $ 3,344 $ 2,765 $ 2,342 15 628 Net Income 595 619 436 380 17 Earnings per share: $ 1.94 Basic $ 1.85 $ 1.93 $ 1.35 $ 1.18 16 1.90 Diluted 1.81 1.89 1.33 1.16 16 17.3% Return on equity 20.3% 25.0% 20.2% 20.6% A s o f D e c e m b e r 31 , $69,896 Total assets $69,298 $60,896 $47,082 $37,975 1,217 Long-term debt 1,219 921 922 774 3,845 Stockholders’ equity 3,262 2,652 2,311 1,995 52.25 Closing price per share of common stock 62.11 36.53 35.06 29.09 19,753 Number of employees 17,604 17,213 16,816 14,199 Operating results exclude significant, non-recurring special items to present the results and trends of the Corporation’s ongoing business activities. For the year ended December 31, 2001, operating results exclude the write-off of State Street’s total investment in Bridge Information Systems, Inc. of $50 million, equal to $33 million after tax, or $.10 per diluted share, recorded in March 2001. For the year ended December 31, 1999, operating results exclude the gain on the sale of the com- mercial banking business of $282 million, net of exit and other associated costs, and a one-time charge of $57 million on sales of securities related to the repositioning of the investment portfolio. Combined, these items increased reported net income by $130 million after tax, or $.40 per diluted share. Results above include State Street’s retirement investment and benefits outsourcing services through March 31, 2000. On April 1, 2000, those services were contributed to CitiStreet, a 50/50 joint venture accounted for using the equity method, thereby reducing revenue and expenses subsequent to CitiStreet’s formation. 1 State Street Corporation
  • 34. Management’s Discussion and Analysis of Results of Operations and Financial Condition Results of Operations Summary State Street recorded its 24th consecutive year of double-digit operating earnings-per-share growth in 2001. State Street’s operating earnings per share were $2.00 in 2001, an increase of 10% over 2000 earnings per share of $1.81. Total taxable-equivalent operating revenue was $3.9 billion, an increase of 8% from 2000. Operating earnings were $661 million, up 11% from 2000 net income of $595 million. Operating return on stockholder’s equity was 18.2%. State Street’s 2001 reported earnings per share were $1.90, its reported net income was $628 million, and its reported total taxable-equivalent revenue was $3.9 billion. Reported results for 2001 differ from operating results, which exclude the write-off of State Street’s total investment in Bridge Information Systems, Inc. (“Bridge”) of $50 million, equal to $33 million after tax, or $.10 per diluted share. In March 2001, following a bankruptcy filing by Bridge, State Street determined that the value of this investment was permanently impaired. '01 '00 2.00 1.81 '99 '98 1.49 '97 1.33 1.16 DILUTED OPERATING (Dollars) EARNINGS PER SHARE State Street’s primary financial goal is to achieve sustainable, real (inflation-adjusted) growth in earnings per share. Over the last five years, diluted operating earnings per share increased at an 18% compound annual growth rate. In 2001, the Corporation’s total operating revenue was $3.9 billion, an increase of $299 million, or 8%, over 2000. On April 1, 2000, State Street contributed its retirement investment and benefits outsourcing services to a 50/50 joint venture, CitiStreet, accounted for using the equity method, thereby reducing revenue and expenses of State Street subsequent to CitiStreet’s formation. Adjusted to exclude the revenue and expenses of services contributed to CitiStreet from the first quarter of 2000 (“adjusted for the formation of CitiStreet”), the growth in total operating revenue was 10%. '01 '00 3,914 '99 3,615 '98 3,119 '97 1 2,765 2,342 2 3 4 (Dollars in millions) TOTAL OPERATING REVENUE 1 Servicing fees 2 Management fees 3 Foreign exchange trading and processing fees and other revenue 4 Net interest revenue after provision for loan losses In 2001, servicing fees and net interest revenue drove revenue growth. Growth in servicing fees primarily reflects several large client wins installed starting in the latter half of 2000 and continuing throughout 2001, and a significant increase in securities lending fees. Strength in securities lending revenue resulted primarily from 2 State Street Corporation
  • 35. wider interest rate spreads in a favorable 2001 U.S. interest rate environment. Declines in equity market values worldwide offset some of the growth in servicing fees. Both securities lending and net interest revenue benefited from the unusual occurrence of eleven reductions in the U.S. federal funds target rate during 2001. Additionally, growth in State Street’s balance sheet, primarily from clients’ investment activities, was a significant factor in the growth of net interest revenue. Management fees were down 12%, reflecting declining equity values worldwide. Foreign exchange trading revenue was down 5%, reflecting decreased currency volatility. Lower management fees and foreign exchange trading revenue partially offset the growth in servicing fees and net interest revenue. Reducing the rate of expense growth was a key factor in State Street’s 2001 performance. State Street continues to invest for the future by carefully pacing spending on strategic initiatives and technology projects that are critical to long-term growth. Operating expenses were $2.9 billion, an increase of 8% over 2000. Adjusted for the formation of CitiStreet, operating expenses grew 10%, significantly lower than the comparable 20% expense growth in 2000. The 10% year-over-year growth in expenses reflects higher salaries and employee benefits expense, partially offset by lower incentive-based compensation, and higher information systems and communications expense. State Street has two supporting financial goals, one for total revenue and one for return on stockholders’ equity. State Street’s total revenue goal is 12.5% real compound annual growth from 2000 through 2010; although, as has been true in the past, State Street does not expect to achieve that growth rate every year in the ten-year period. State Street still expects to meet its goal over the stated period. Operating return on stockholders’ equity for 2001 was 18.2%, exceeding State Street’s long-term goal of 18%. State Street’s strategy of focusing on providing sophisticated global investors with a complete, integrated range of products and services has proven successful for over two decades under varying economic and financial conditions. State Street focuses on total client relationships. This focus results in a high rate of client retention, cross-selling opportunities and recurring revenue. Services are integrated and priced based on each client’s total business relationship. While most of State Street’s client services result in management or servicing fees, clients use a wide variety of additional services that are recorded in their respective revenue categories, such as foreign exchange trading revenue or net interest revenue. Management focuses on increasing total revenue. State Street’s ability to serve clients’ expanding needs is critical to its success. Long-term, global trends driving demand for State Street’s services remain robust and support continuing growth: ongoing convergence in the financial services industry, a worldwide sense of urgency about the need for retirement security and a growing trend by investment managers to outsource activities that are not part of their core competencies. By continuing to invest in technology, integrated products and services that span the entire investment process, and expansion into new markets, State Street is positioned to benefit from these trends. State Street’s solid performance in 2001 was the result of strong new business with existing and new clients, a diverse service offering, and market expertise that enabled State Street to take advantage of an unprecedented interest rate environment, as well as the commitment and abilities of State Street’s global employee team. Revenue State Street is one of the world’s leading specialists in serving mutual funds, collective funds and pension plans. The Corporation provides investment management and industry-leading technology and information services to support financial strategies and transactions for sophisticated global investors. State Street has integrated its products and services to meet client needs throughout every phase of the investment cycle. This integration positions State Street to grow with its clients by providing additional products and services globally as client requirements expand. State Street’s focus on total client relationships results in high client retention, cross- selling opportunities and recurring revenue. During 2001, clients continued to increase the number of State Street products they use. The Corporation’s 1,000 largest clients used an average of 7.3 products in 2001, up from 3 State Street Corporation
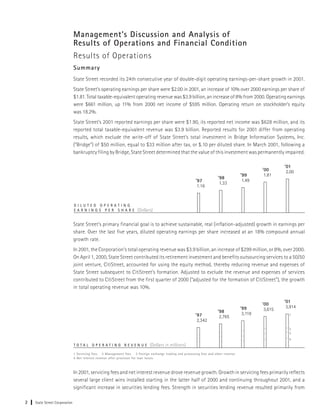
  • 36. an average of 7.1 in 2000. The top 100 largest clients used an average of 11.3 products in 2001, up from an average of 11.2 in 2000. State Street benefits significantly from its ability to derive revenue from the transaction flows of clients. This occurs through the management of cash positions, including deposit balances and other short-term investment activities, using State Street’s balance sheet capacity. Significant foreign currency transaction volumes provide potential for foreign exchange trading revenue as well. Fee Revenue Total operating fee revenue was $2.8 billion in 2001, compared to $2.7 billion in 2000, an increase of 6%. Adjusted for the formation of CitiStreet, the growth in fee revenue was 8%. Growth in servicing fees of $199 million, or 14%, was the primary contributor to the increase in fee revenue. This growth primarily reflects several large client wins installed starting in the latter half of 2000 and continuing throughout 2001, and strength in fee revenue from securities lending. Declines in equity market values worldwide offset some of the growth in servicing fees. Management fees were down 5%, adjusted for the formation of CitiStreet, reflecting the decline in the worldwide equity markets. Foreign exchange trading revenue was down 5%, reflecting lower currency volatility, and processing fees and other revenue was up 21%, primarily due to gains on the sales of investment securities. Servicing and management fees are a function of several factors, including the mix and volume of assets under custody and assets under management, securities positions held, and portfolio transactions, as well as types of products and services used by clients. State Street estimates, based on a study conducted in 2000, that a 10% increase or decrease in worldwide equity values would cause a corresponding change in State Street’s total revenue of approximately 2%. If bond values were to increase or decrease by 10%, State Street would anticipate a corresponding change of approximately 1% in its total revenue. Securities lending revenue in 2001 increased approximately 40% over 2000. Securities lending revenue is reflected in both servicing fees and management fees. Securities lending revenue is a function of the volume of securities lent and interest rate spreads. While volumes increased in 2001, the year-over-year increase is primarily due to wider interest rate spreads resulting from the unusual occurrence of eleven reductions in the U.S. federal funds target rate during 2001. FEE REVENUE Adjusted Change Change 2001(1) 1999(2) 00-01(3) (Dollars in millions) 2000 00-01 $1,624 Servicing fees $1,425 $1,170 14% 14% 511 Management fees 581 600 (12) (5) 368 Foreign exchange trading 387 306 (5) (5) 329 Processing fees and other 272 236 21 21 $2,832 Total fee revenue $2,665 $2,312 6 8 (1) 2001 results exclude the write-off of State Street’s total investment in Bridge of $50 million (2) 1999 results exclude the one-time charge of $57 million related to the repositioning of the investment portfolio (3) 2000 results adjusted for the formation of CitiStreet 4 State Street Corporation
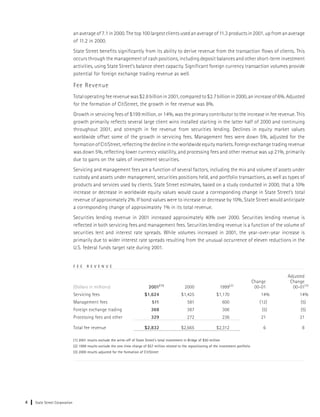
  • 37. Servicing Fees In 2001, servicing fees were $1.6 billion, up 14% from 2000. Growth in servicing fees primarily reflects several large client wins installed starting in the latter half of 2000 and continuing throughout 2001, and strength in securities lending revenue. Declines in equity market values worldwide offset some of the growth in servicing fees. State Street provides solutions to meet the needs of managers of mutual funds, collective funds, pension and retirement plans and other institutional investors worldwide through offices and a global custodian network that spans 100 geographic markets. M u t u a l F u n d s a n d C o l l e c t i v e F u n d s Servicing fees include fee revenue from U.S. mutual funds, collective funds worldwide, non-U.S. retirement plans and other non-U.S. investment pools. Products and services provided include custody, accounting, daily pricing and administration; trustee and recordkeeping; investment manager operations outsourcing; and securities lending. In 2001, revenue growth from servicing U.S. mutual funds and collective funds was primarily due to new business from new and existing clients. State Street is the largest mutual fund custodian and accounting agent in the United States. State Street provides custody services for 44% of registered U.S. mutual funds and is distinct from other mutual fund service providers because clients make extensive use of a number of related services, including accounting, daily pricing and fund administration. The Corporation provides fund accounting and valuation services for more than four times the assets serviced by the next largest accounting service provider. State Street calculates approximately 30% of the U.S. mutual fund prices that appear daily in The Wall Street Journal. A long-term revenue driver is the number of mutual funds the Corporation services. In 2001, the total number of funds State Street serviced increased by 341, or 8%, to 4,680. There were 689 new funds serviced, 524 from existing clients and 165 from new clients, partially offset by 348 funds no longer serviced due primarily to fund liquidations and consolidations. State Street is committed to expanding globally by serving the worldwide needs of both its U.S. and non-U.S. clients. Growth in servicing revenue in Europe was primarily attributable to previously announced acquisitions, alliances and new business in the United Kingdom. Growth in servicing fees in Asia/Pacific included fees from new business, primarily in Japan. In 2000, State Street announced plans to expand its services to investment managers to include operations outsourcing services. Through these services, State Street provides global asset managers with a comprehensive suite of services, from trade order management through settlement. Services include securities trade order processing, custodian communications for settlements, accounting systems, and networks and information technology development. U . S . P e n s i o n , I n s u r a n c e a n d O t h e r I n v e s t m e n t P o o l s State Street provides master trust, master custody, securities lending, and performance, risk and compliance analytics to corporate and public pension funds, other institutional retirement funds, insurance companies, foundations, endowments and corporate and public treasurers. These clients make extensive use of many other products and services, including securities lending, investment management, and foreign exchange and equity trade execution. In 2001, revenue growth was driven primarily by increased securities lending revenue. At 26% market share, State Street has a leading position in the market for servicing U.S. tax-exempt assets for corporate and public pension funds. Additionally, State Street provides trust and valuation services for over 3,900 daily-priced, unitized defined contribution accounts, making State Street a leader in this market. 5 State Street Corporation