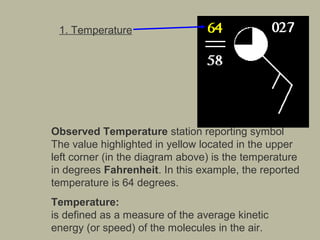
Station Models
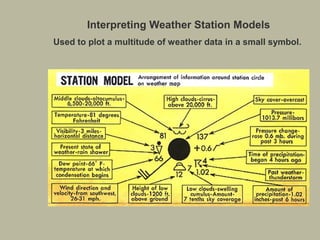
- 1. Station Models • Television weather reports represent weather conditions with smiling suns, rainy clouds and flashing bolts of lightning. •In studying the weather we need to know where it is raining and where it is sunny, the wind speed and direction, humidity, visibility, cloud cover, precipitation, air pressure, dew point, and temperature. •To understand these relationships it is best to represent weather variables in a simple graph. •Smiling suns do not contain enough information about the weather. On the other hand too many numbers drawn on a single map presents a confusing picture. •Weather conditions observed at a city or town are best represented on a map using the station model.
- 2. Interpreting Weather Station Models Used to plot a multitude of weather data in a small symbol.
- 5. 2. Current weather The symbol highlighted in yellow indicates the current weather occurring at the time the observation is taken. In this case, fog was reported. Common symbols
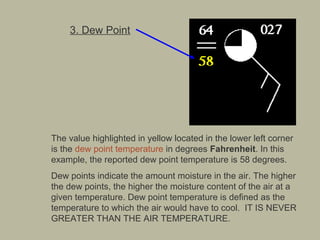
- 6. 3. Dew Point The value highlighted in yellow located in the lower left corner is the dew point temperature in degrees Fahrenheit. In this example, the reported dew point temperature is 58 degrees. Dew points indicate the amount moisture in the air. The higher the dew points, the higher the moisture content of the air at a given temperature. Dew point temperature is defined as the temperature to which the air would have to cool. IT IS NEVER GREATER THAN THE AIR TEMPERATURE.
- 7. 4. Cloud Cover The symbol highlighted in yellow indicates the amount of cloud cover observed at the time the observation is taken. In this the case, cloud cover is… 25%
- 9. 5. Barometric Pressure *Average sea-level pressure is 1013.25 hPa (mb) or 29.921 inches of mercury (in Hg). *Average pressure on Earth ranges between 900 mb and 1040 mb. The value highlighted in yellow located in the upper right corner represents the last three digits of the barometric pressure at sea level in millibars (mb). •The highest recorded atmospheric pressure, 108.6 kPa (1086 mb or 32.06 inches of mercury), occurred at Tosontsengel, Mongolia, 19 December 20012. •The lowest recorded non-tornadic atmospheric pressure, 87.0 kPa (870 mb or 25.69 inches of mercury), occurred in the Western Pacific during Typhoon Tip on 12 October 19792. The record for the Atlantic ocean was 88.2 kPa (882 mb or 26.04 inches of mercury) during Hurricane Wilma on 19 October 2005.
- 10. Barometric Pressure cont… Interpreting Pressure Reports: *If reported value is greater than 500: Initial 9 is missing. Place it on left, then divide by 10. For example: 827 becomes 982.7 mb. *If reported value is less than 500: Initial 10 is missing. Place it on left, then divide by 10. For example (as in above diagram): 027 becomes 1002.7 mb.
- 11. 6. Wind Speed & Wind Direction The symbol highlighted in yellow is known as a wind barb. The wind barb indicates wind direction and wind speed.
- 12. Wind barbs point in the direction "from" which the wind is blowing. In the case of the diagram below, the orientation of the wind barb indicates winds from the Southeast.
- 13. 7. Wind Speed Wind speed is given here in the units of "knots" (knt). A "Knot" is a nautical mile per hour. 1 Knot = 1.15 Miles Per Hour (MPH) 1 Knot = 1.9 Kilometers Per Hour (KM/HR)
- 14. Practice…
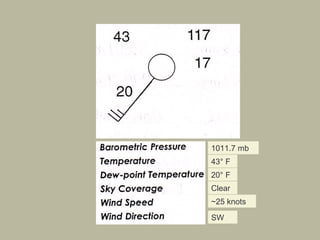
- 16. 1011.7 mb 43° F 20° F Clear ~25 knots SW


