Location via proxy:   [ UP ]  
[Report a bug]   [Manage cookies]                
SlideShare a Scribd company logo
Supplemental Information
                            First Quarter 2006


This information is preliminary and based on company data available at the time of the presentation. It speaks only as
of the particular date or dates included in the accompanying pages. Bank of America does not undertake an obligation
to, and disclaims any duty to, correct or update any of the information provided. Any forward-looking statements in this
information are subject to the forward-looking language contained in Bank of America's reports filed with the SEC pursuant
to the Securities Exchange Act of 1934, which are available at the SEC's website (www.sec.gov) or at Bank of America's
website (www.bankofamerica.com). Bank of America's future financial performance is subject to risks and uncertainties as
described in its SEC filings.
Bank of America Corporation
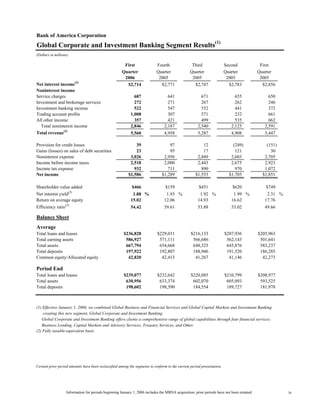
Consolidated Financial Highlights
(Dollars in millions, except per share information; shares in thousands)


                                                               First                  Fourth                 Third                 Second            First
                                                              Quarter                 Quarter               Quarter                Quarter          Quarter
                                                               2006                    2005                  2005                   2005             2005
Income statement
Net interest income                                               $ 8,776                 $ 7,859               $ 7,735               $ 7,637         $ 7,506
Noninterest income                                                  8,901                   5,951                 6,416                 6,955           6,032
Total revenue                                                      17,677                  13,810                14,151                14,592          13,538
Provision for credit losses                                         1,270                   1,400                 1,159                   875             580
Gains on sales of debt securities                                      14                      71                    29                   325             659
Noninterest expense                                                 8,924                   7,320                 7,285                 7,019           7,057
Income tax expense                                                  2,511                   1,587                 1,895                 2,366           2,167
Net income                                                          4,986                   3,574                 3,841                 4,657           4,393
Diluted earnings per common share                                    1.07                    0.88                  0.95                  1.14            1.07
Average diluted common shares issued
  and outstanding                                              4,666,405               4,053,859             4,054,659             4,065,355        4,099,062
Dividends paid per common share                                    $ 0.50                  $ 0.50                $ 0.50                $ 0.45          $ 0.45

Performance ratios
Return on average assets                                             1.43 %                  1.09 %                1.18 %                 1.46 %         1.49 %
Return on average common shareholders' equity                       15.44                   14.21                 15.09                  18.93          17.97

At period end
Book value per share of common stock                              $ 28.19                 $ 25.32               $ 25.28               $ 25.16         $ 24.45
Market price per share of common stock:
 Closing price                                                   $ 45.54                 $ 46.15               $ 42.10                $ 45.61         $ 44.10
 High closing price for the period                                 47.08                   46.99                 45.98                  47.08           47.08
 Low closing price for the period                                  43.09                   41.57                 41.60                  44.01           43.66
Market capitalization                                            208,633                 184,586               168,950                183,202         177,958
Number of banking centers - domestic                               5,786                   5,873                 5,844                  5,880           5,889
Number of ATMs - domestic                                         16,716                  16,785                16,714                 16,687          16,798
Full-time equivalent employees                                   202,503                 176,934               177,539                178,107         176,973


Certain prior period amounts have been reclassified to conform to current period presentation.


                           Information for periods beginning January 1, 2006 includes the MBNA acquisition; prior periods have not been restated.               1
Bank of America Corporation
Supplemental Financial Data
(Dollars in millions)

Fully taxable-equivalent basis data

                                                                                           First              Fourth            Third            Second           First
                                                                                          Quarter             Quarter          Quarter           Quarter         Quarter
                                                                                           2006                2005             2005              2005            2005

Net interest income                                                                          $ 9,040           $ 8,102          $ 7,933           $ 7,828         $ 7,706
Total revenue                                                                                    17,941        14,053            14,349            14,783          13,738
Net interest yield                                                                                 2.98   %       2.82    %        2.78    %          2.80   %       2.96    %
Efficiency ratio                                                                                  49.74          52.09            50.76             47.49           51.37


Reconciliation to GAAP financial measures
Supplemental financial data presented on an operating basis is a basis of presentation not defined by accounting principles generally accepted in the
United States (GAAP) that excludes merger and restructuring charges. We believe that the exclusion of merger and restructuring charges, which
represent events outside our normal operations, provides a meaningful period-to-period comparison and is more reflective of normalized operations.

Shareholder value added (SVA) is a key measure of performance not defined by GAAP that is used in managing our growth strategy orientation and
strengthening our focus on generating long-term growth and shareholder value. SVA is used to evaluate the Corporation's use of equity (i.e. capital) at
the individual unit level and is an integral component in the analytics for resource allocation. Using SVA as a performance measure places specific
focus on whether incremental investments generate returns in excess of the costs of capital associated with those investments. Each business segment
has a goal for growth in SVA reflecting the individual segment's business and customer strategy.

Other companies may define or calculate supplemental financial data differently. See the tables below for supplemental financial data and
corresponding reconciliations to GAAP financial measures for the quarters ended March 31, 2006, December 31, 2005, September 30, 2005, June 30,
2005 and March 31, 2005.

Reconciliation of net income to operating earnings
                                                                                           First              Fourth            Third           Second            First
                                                                                          Quarter             Quarter          Quarter          Quarter          Quarter
                                                                                           2006                2005             2005             2005             2005
Net income                                                                                  $ 4,986            $ 3,574          $ 3,841          $ 4,657          $ 4,393
Merger and restructuring charges                                                                 98                 59              120              121              112
Related income tax benefit                                                                      (37)               (19)             (40)             (41)             (37)
Operating earnings                                                                          $ 5,047            $ 3,614          $ 3,921          $ 4,737          $ 4,468


Reconciliation of average common shareholders' equity to average tangible common shareholders' equity
Average common shareholders' equity                                                       $ 130,881           $ 99,677        $ 100,974          $ 98,558        $ 99,130
Average goodwill                                                                            (66,094)           (45,305)         (45,297)          (45,379)        (45,346)
Average tangible common shareholders' equity                                              $ 64,787            $ 54,372        $ 55,677           $ 53,179        $ 53,784


Operating basis
Diluted earnings per common share                                                                 $1.08          $0.89            $0.97             $1.16           $1.09
Return on average assets                                                                           1.45 %         1.10 %           1.20 %            1.49 %          1.51    %
Return on average common shareholders' equity                                                     15.63          14.36            15.39             19.26           18.26
Return on average tangible common shareholders' equity                                            31.57          26.33            27.91             35.70           33.66
Efficiency ratio                                                                                  49.19          51.66            49.92             46.67           50.55

Reconciliation of net income to shareholder value added
Net income                                                                                   $ 4,986           $ 3,574          $ 3,841           $ 4,657         $ 4,393
Amortization of intangibles                                                                      440               196              201               204             208
Merger and restructuring charges,
  net of tax benefit                                                                              61                40               80                80              75
Capital charge                                                                                (3,550)           (2,764)          (2,799)           (2,703)         (2,689)
Shareholder value added                                                                      $ 1,937           $ 1,046          $ 1,323           $ 2,238         $ 1,987


Certain prior period amounts have been reclassified to conform to current period presentation.


                                   Information for periods beginning January 1, 2006 includes the MBNA acquisition; prior periods have not been restated.                        2
Bank of America Corporation
Consolidated Statement of Income
(Dollars in millions, except per share information; shares in thousands)
                                                                              First             Fourth             Third            Second          First
                                                                             Quarter            Quarter           Quarter           Quarter        Quarter
                                                                              2006               2005              2005              2005           2005
Interest income
Interest and fees on loans and leases                                          $ 11,127            $ 9,536           $ 8,933          $ 8,294        $ 8,080
Interest and dividends on securities                                              3,014              2,815             2,793            2,796          2,533
Federal funds sold and securities purchased under
 agreements to resell                                                             1,709             1,477              1,382           1,249            904
Trading account assets                                                            1,548             1,585              1,550           1,426          1,182
Other interest income                                                               727               605                547             502            437
  Total interest income                                                          18,125            16,018             15,205          14,267         13,136
Interest expense
Deposits                                                                          3,007              2,476             2,471            2,363         2,182
Short-term borrowings                                                             4,309              3,855             3,190            2,582         1,988
Trading account liabilities                                                         517                619               707              611           427
Long-term debt                                                                    1,516              1,209             1,102            1,074         1,033
  Total interest expense                                                          9,349              8,159             7,470            6,630         5,630
Net interest income                                                               8,776              7,859             7,735            7,637         7,506
Noninterest income
Service charges                                                                   1,901              1,927             2,080            1,920         1,777
Investment and brokerage services                                                 1,103              1,062             1,060            1,049         1,013
Mortgage banking income                                                             137                215               180              189           221
Investment banking income                                                           501                537               522              431           366
Equity investment gains                                                             660                481               668              492           399
Card income                                                                       3,436              1,507             1,520            1,437         1,289
Trading account profits                                                           1,074                299               557              222           685
Other income                                                                         89                (77)             (171)           1,215           282
   Total noninterest income                                                       8,901              5,951             6,416            6,955         6,032
Total revenue                                                                    17,677            13,810             14,151          14,592         13,538
Provision for credit losses                                                       1,270              1,400             1,159                 875        580
Gains on sales of debt securities                                                    14                 71                29                 325        659
Noninterest expense
Personnel                                                                         4,813              3,845             3,837            3,671         3,701
Occupancy                                                                           701                699               638              615           636
Equipment                                                                           344                305               300              297           297
Marketing                                                                           575                265               307              346           337
Professional fees                                                                   218                283               254              216           177
Amortization of intangibles                                                         440                196               201              204           208
Data processing                                                                     410                394               361              368           364
Telecommunications                                                                  220                219               206              196           206
Other general operating                                                           1,105              1,055             1,061              985         1,019
Merger and restructuring charges                                                     98                 59               120              121           112
  Total noninterest expense                                                       8,924              7,320             7,285            7,019         7,057
Income before income taxes                                                        7,497              5,161             5,736            7,023         6,560
Income tax expense                                                                2,511              1,587             1,895            2,366         2,167
Net income                                                                      $ 4,986            $ 3,574           $ 3,841          $ 4,657        $ 4,393
Net income available to common shareholders                                     $ 4,981            $ 3,570           $ 3,836          $ 4,653        $ 4,388

Per common share information
Earnings                                                                         $ 1.08             $ 0.89            $ 0.96           $ 1.16         $ 1.09
Diluted earnings                                                                 $ 1.07             $ 0.88            $ 0.95           $ 1.14         $ 1.07
Dividends paid                                                                   $ 0.50             $ 0.50            $ 0.50           $ 0.45         $ 0.45
Average common shares issued and outstanding                                 4,609,481          3,996,024         4,000,573        4,005,356       4,032,550
Average diluted common shares issued and outstanding                         4,666,405          4,053,859         4,054,659        4,065,355       4,099,062


Certain prior period amounts have been reclassified to conform to current period presentation.


                    Information for periods beginning January 1, 2006 includes the MBNA acquisition; prior periods have not been restated.                     3
Bank of America Corporation
Consolidated Balance Sheet
                                                                                                            March 31             December 31        March 31
(Dollars in millions)                                                                                        2006                   2005             2005
Assets
Cash and cash equivalents                                                                                     $     32,575          $     36,999    $     28,698
Time deposits placed and other short-term investments                                                               11,157                12,800          11,223
Federal funds sold and securities purchased under agreements to resell                                             137,081               149,785         139,396
Trading account assets                                                                                             117,181               131,707         124,960
Derivative assets                                                                                                   23,291                23,712          26,182
Securities:
 Available-for-sale                                                                                                237,987               221,556         218,675
 Held-to-maturity, at cost                                                                                              86                    47             275
  Total securities                                                                                                 238,073               221,603         218,950
Loans and leases                                                                                                   619,525               573,791         529,457
Allowance for loan and lease losses                                                                                 (9,067)               (8,045)         (8,313)
  Loans and leases, net of allowance                                                                               610,458               565,746         521,144
Premises and equipment, net                                                                                          9,267                 7,786           7,531
Mortgage servicing rights ($2,925 measured at fair value at March 31, 2006)                                          3,070                 2,806           2,667
Goodwill                                                                                                            66,271                45,354          45,378
Core deposit intangibles and other intangibles                                                                      10,681                 3,194           3,679
Other assets                                                                                                     115,975                90,311           82,421
    Total assets                                                                                             $ 1,375,080           $ 1,291,803      $ 1,212,229

Liabilities
Deposits in domestic offices:
  Noninterest-bearing                                                                                        $ 179,358             $ 179,571        $    166,499
  Interest-bearing                                                                                             415,769               384,155             403,534
Deposits in foreign offices:
  Noninterest-bearing                                                                                                6,874                 7,165           5,319
  Interest-bearing                                                                                                  80,448                63,779          54,635
   Total deposits                                                                                                  682,449               634,670         629,987
Federal funds purchased and securities sold under agreements to repurchase                                         236,919               240,655         187,652
Trading account liabilities                                                                                         51,100                50,890          53,434
Derivative liabilities                                                                                              15,541                15,000          15,363
Commercial paper and other short-term borrowings                                                                    99,389               116,269          93,440
Accrued expenses and other liabilities (includes $396, $395 and $394 of reserve for
  unfunded lending commitments)                                                                                      37,078                31,938          35,319
Long-term debt                                                                                                      123,178               100,848          98,107
   Total liabilities                                                                                              1,245,654             1,190,270       1,113,302
Shareholders' equity
Preferred stock, $0.01 par value; authorized - 100,000,000 shares; issued and
   outstanding - 1,090,189 shares                                                                                      271                   271             271
Common stock and additional paid-in capital, $0.01 par value; authorized - 7,500,000,000 shares;
   issued and outstanding - 4,581,317,964; 3,999,688,491 and 4,035,318,509 shares                                 68,705                41,693           43,589
Retained earnings                                                                                                 70,204                67,552           61,309
Accumulated other comprehensive income (loss)                                                                     (8,981)               (7,556)          (5,617)
Other                                                                                                               (773)                 (427)            (625)
  Total shareholders' equity                                                                                     129,426               101,533           98,927
     Total liabilities and shareholders' equity                                                              $ 1,375,080           $ 1,291,803      $ 1,212,229

Certain prior period amounts have been reclassified to conform to current period presentation.


                        Information for periods beginning January 1, 2006 includes the MBNA acquisition; prior periods have not been restated.                      4
Bank of America Corporation
Capital Management
(Dollars in millions)

                                                                                  First                      Fourth                       Third                       Second                       First
                                                                                 Quarter                     Quarter                     Quarter                      Quarter                     Quarter
                                                                                 2006(1)                      2005                         2005                        2005                        2005

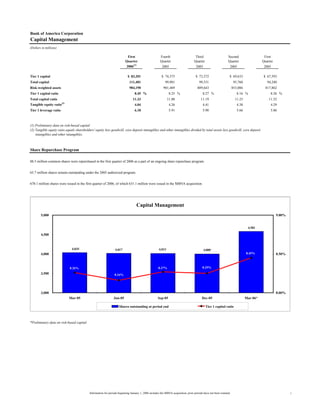
Tier 1 capital                                                                    $ 83,201                    $ 74,375                    $ 73,572                     $ 69,633                   $ 67,593
Total capital                                                                      111,481                       99,901                      99,531                         95,760                   94,240
Risk-weighted assets                                                               984,190                     901,469                      889,643                        853,086                  817,862
Tier 1 capital ratio                                                                   8.45 %                        8.25 %                      8.27 %                       8.16 %                   8.26 %
Total capital ratio                                                                   11.33                         11.08                       11.19                        11.23                    11.52
Tangible equity ratio(2)                                                               4.04                          4.26                        4.41                         4.38                     4.29
Tier 1 leverage ratio                                                                  6.18                          5.91                        5.90                         5.66                     5.86


(1) Preliminary data on risk-based capital
(2) Tangible equity ratio equals shareholders' equity less goodwill, core deposit intangibles and other intangibles divided by total assets less goodwill, core deposit
    intangibles and other intangibles.


Share Repurchase Program

88.5 million common shares were repurchased in the first quarter of 2006 as a part of an ongoing share repurchase program.


65.7 million shares remain outstanding under the 2005 authorized program.


670.1 million shares were issued in the first quarter of 2006, of which 631.1 million were issued in the MBNA acquisition.


                                                                                                                                                                                      0.0821
                                                                                         Capital Management
                           5,000                                                                                                                                                                            9.00%
                            1,575                                                                                                                                                                              0.09
                                                                                                                                                                                                               0.085

                            4,300                                        0.082                                                                    0.0821                              4,581
                            1,550
                           4,500     0.0814,047
                                                                         4,035                                4,017
                                                                                                         0.0806                                                                           4,000               0.085
    (Shares in millions)


                                         0.0825
                                                                                   8.48%                                                                                         0.0821
                                                                                                                                                                                 0.082                        0.08
                                         0.081                                                                                                      4,013
                            1,525                                                                                                      0.0806
                             3,800     4,035                           4,017                                4,013                                 4,000
                           4,000                                                                                                                                                     8.45%                  8.50%
                                                                                   8.48%                                                                                                                       0.08
                                                                                                                                       0.0773
                            1,500
                                      8.26%                                                                8.27%                                 8.25%                                                        0.075
                             3,300
                           3,500                                      8.16%                                                                                                                                   0.075
                            1,475


                            1,450
                           3,000
                             2,800                                                                                                                                                                          8.00%
                                                                                                                                                                                                               0.07
                                         Dec-04
                                          37865
                                     Mar-05
                                      Dec-04                          Jun-05
                                                                        Mar-05        Mar-05
                                                                                      37956                Sep-05
                                                                                                             Jun-05                  Jun-05 Dec-05
                                                                                                                                     38047    Sep-05                                 Sep-05
                                                                                                                                                                                     38139
                                                                                                                                                                                     Mar-06*
                                                                                                                                                                                        Dec-05*

                                                                      Shares outstanding at period end end
                                                                      Shares outstanding at period end
                                                                        Shares outstanding atat period
                                                                          Shares outstanding period end                                         Tier 1 capital ratio ratio
                                                                                                                                                Tier Tier capital ratio
                                                                                                                                                   Tiercapital ratio
                                                                                                                                                     1 1 1 capital


*Preliminary data on risk-based capital


                                                  Information for periods beginning January 1, 2006 includes the MBNA acquisition; prior periods have not been restated.                                               5
Bank of America Corporation
Core Net Interest Income - Managed Basis
(Dollars in millions)
                                                                             First                 Fourth                  Third                 Second               First
                                                                            Quarter                Quarter                Quarter                Quarter             Quarter
                                                                              2006                   2005                   2005                  2005                2005
Net Interest Income
As reported (fully taxable-equivalent basis)                                   $ 9,040                 $8,102                 $7,933                $7,828             $7,706
Impact of market based net interest income                                        (410)                  (419)                  (449)                 (519)              (546)
 Core net interest income                                                        8,630                  7,683                  7,484                 7,309              7,160
Impact of securitizations                                                        1,897                     11                     52                   106                155
 Core net interest income - managed basis                                      $10,527                 $7,694                 $7,536                $7,415             $7,315

Average Earning Assets
As reported                                                                $1,219,611             $1,145,550            $1,137,629             $1,118,518           $1,044,891
Impact of market based earning assets                                        (336,496)              (329,237)             (334,992)              (338,490)            (285,414)
 Core average earning assets                                                  883,115                816,313               802,637                780,028              759,477
Impact of securitizations                                                      96,268                  6,447                 7,827                 10,773               11,151
 Core average earning assets - managed basis                               $ 979,383              $ 822,760             $ 810,464              $ 790,801            $ 770,628

Net Interest Yield Contribution
As reported (fully taxable-equivalent basis)                                       2.98 %                 2.82 %                2.78 %                   2.80   %         2.96 %
Impact of market based activities                                                  0.95                   0.93                  0.94                     0.95             0.82
 Core net interest yield on earning assets                                         3.93                   3.75                  3.72                     3.75             3.78
Impact of securitizations                                                          0.39                  (0.02)                (0.01)                       -             0.03
 Core net interest yield on earning assets - managed basis                         4.32 %                 3.73 %                3.71 %                   3.75   %         3.81 %


Certain prior period amounts have been restated reflecting realignment of business segments.


                                Information for periods beginning January 1, 2006 includes the MBNA acquisition; prior periods have not been restated.                             6
Bank of America Corporation
Quarterly Average Balances and Interest Rates - Fully Taxable-equivalent Basis
(Dollars in millions)
                                                                           First Quarter 2006                                 Fourth Quarter 2005                            First Quarter 2005
                                                                                    Interest                                           Interest                                       Interest
                                                                      Average       Income/              Yield/          Average       Income/             Yield/      Average       Income/        Yield/
                                                                      Balance       Expense              Rate            Balance      Expense              Rate        Balance       Expense        Rate
Earning assets
Time deposits placed and other short-term investments                   $ 14,347           $       139     3.92 %         $    14,619        $       132     3.59 %    $    14,327    $       101     2.87 %
Federal funds sold and securities purchased under
  agreements to resell                                                     174,711             1,709       3.94               165,908            1,477       3.55          147,855          904       2.46
Trading account assets                                                     133,361             1,623       4.89               139,441            1,648       4.72          117,748        1,203       4.10
Securities                                                                 234,606             3,043       5.19               221,411            2,842       5.13          204,574        2,559       5.01
Loans and leases (1):
  Residential mortgage                                                     184,796           2,524         5.48               178,764            2,424       5.42          178,075        2,415       5.44
  Credit card - domestic                                                    68,169           2,180        12.94                56,858            1,747      12.19           51,310        1,373      10.85
  Credit card - foreign                                                      8,403             287        13.86                     -                -          -                -            -          -
  Home equity lines                                                         64,198           1,112         7.02                60,571            1,012       6.63           51,477          692       5.45
  Direct/Indirect consumer                                                  55,025             986         7.24                47,181              703       5.91           41,620          573       5.58
  Other consumer(2)                                                         10,357             272        10.59                 6,653              184      11.01            7,305          158       8.75
    Total consumer                                                         390,948           7,361         7.60               350,027            6,070       6.90          329,787        5,211       6.38
  Commercial - domestic                                                    144,693           2,490         6.97               137,224            2,280       6.59          123,803        1,954       6.40
  Commercial real estate                                                    36,676             632         6.99                36,017              597       6.58           33,016          430       5.29
  Commercial lease financing                                                20,512             247         4.82                20,178              241       4.79           20,745          260       5.01
  Commercial - foreign                                                      23,139             427         7.48                20,143              378       7.45           17,570          259       5.97
    Total commercial                                                       225,020           3,796         6.83               213,562            3,496       6.50          195,134        2,903       6.03
        Total loans and leases                                             615,968          11,157         7.32               563,589            9,566       6.75          524,921        8,114       6.25
Other earning assets                                                        46,618             718         6.22                40,582              596       5.83           35,466          455       5.19
        Total earning assets (3)                                        1,219,611           18,389         6.08           1,145,550           16,261         5.65       1,044,891      13,336         5.14
Cash and cash equivalents                                                  34,857                                            33,693                                        31,382
Other assets, less allowance for loan and lease losses                    161,905                                           125,814                                       124,586
       Total assets                                                    $1,416,373                                        $1,305,057                                    $1,200,859

Interest-bearing liabilities
Domestic interest-bearing deposits:
  Savings                                                               $ 35,550               $  76       0.87 %         $    35,535            $  68       0.76 %    $    37,000        $  35       0.39 %
  NOW and money market deposit accounts                                   227,606                908       1.62               224,122              721       1.28          233,392          651       1.13
  Consumer CDs and IRAs                                                   135,068              1,177       3.53               120,321            1,029       3.39          118,989          965       3.29
  Negotiable CDs, public funds and other time deposits                      8,551                 70       3.30                 5,085               27       2.13           10,291           95       3.73
     Total domestic interest-bearing deposits                             406,775              2,231       2.22               385,063            1,845       1.90          399,672        1,746       1.77
Foreign interest-bearing deposits (4):
  Banks located in foreign countries                                        30,116               424       5.71                24,451              355       5.77           22,085          260       4.77
  Governments and official institutions                                     10,200               107       4.25                 7,579               73       3.84            6,831           43       2.58
  Time, savings and other                                                   35,136               245       2.83                32,624              203       2.46           30,770          133       1.75
     Total foreign interest-bearing deposits                                75,452               776       4.17                64,654              631       3.87           59,686          436       2.96
        Total interest-bearing deposits                                    482,227             3,007       2.53               449,717            2,476       2.18          459,358        2,182       1.93
Federal funds purchased, securities sold under agreements
  to repurchase and other short-term borrowings                            399,896             4,309       4.37               364,140            3,855       4.20          276,483        1,988       2.91
Trading account liabilities                                                 52,466               517       3.99                56,880              619       4.32           44,507          427       3.89
Long-term debt                                                             117,018             1,516       5.18                99,601            1,209       4.85           96,167        1,033       4.30
        Total interest-bearing liabilities (3)                           1,051,607             9,349       3.60               970,338            8,159       3.34          876,515        5,630       2.60
Noninterest-bearing sources:
  Noninterest-bearing deposits                                            177,594                                           179,205                                       168,062
  Other liabilities                                                        56,019                                            55,566                                        56,881
  Shareholders' equity                                                    131,153                                            99,948                                        99,401
        Total liabilities and shareholders' equity                     $1,416,373                                        $1,305,057                                    $1,200,859
Net interest spread                                                                                        2.48                                              2.31                                     2.54
Impact of noninterest-bearing sources                                                                      0.50                                              0.51                                     0.42
        Net interest income/yield on earning assets                                         $9,040         2.98 %                             $8,102         2.82 %                    $7,706         2.96 %

(1) Nonperforming loans are included in the respective average loan balances. Income on these nonperforming loans is recognized on a cash basis.
(2) Includes consumer finance of $3,012 million in the first quarter of 2006, and $2,916 million and $3,362 million in the fourth and first quarters of 2005; foreign consumer of $7,328
   million in the first quarter of 2006, and $3,682 million and $3,532 million in the fourth and first quarters of 2005; and consumer lease financing of $17 million in the first quarter
   of 2006, and $55 million and $411 million in the fourth and first quarters of 2005.
(3) Interest income includes the impact of interest rate risk management contracts, which increased interest income on the underlying assets $8 million in the first quarter of 2006, and
   $29 million and $421 million in the fourth and first quarters of 2005. Interest expense includes the impact of interest rate risk management contracts, which increased interest expense
    on the underlying liabilities $136 million in the first quarter of 2006, and $254 million and $504 million in the fourth and first quarters of 2005.
(4) Primarily consists of time deposits in denominations of $100,000 or more.


                                              Information for periods beginning January 1, 2006 includes the MBNA acquisition; prior periods have not been restated.                                           7
Bank of America Corporation
Quarterly Average Balances and Interest Rates - Fully Taxable-equivalent Basis - Isolating Derivative Hedge Income/Expense (1)
(Dollars in millions)
                                                                                                   First Quarter 2006                                 Fourth Quarter 2005                           First Quarter 2005
                                                                                                           Interest                                            Interest                                      Interest
                                                                                           Average         Income/          Yield/             Average         Income/             Yield/     Average       Income/      Yield/
                                                                                           Balance          Expense          Rate              Balance          Expense             Rate      Balance         Expense     Rate
Earning assets
                                                      (2)
Time deposits placed and other short-term investments                                        $ 14,347          $ 142           4.01 %           $ 14,619          $ 134              3.63 %   $ 14,327        $ 102        2.88 %
Federal funds sold and securities purchased under
  agreements to resell (2)                                                                      174,711          1,800         4.15                165,908          1,538            3.70       147,855          851       2.32
Trading account assets                                                                          133,361          1,623         4.89                139,441          1,648            4.72       117,748        1,203       4.10
Securities(2)                                                                                   234,606          3,043         5.19                221,411          2,843            5.13       204,574        2,562       5.01
Loans and leases(3):
  Residential mortgage (2)                                                                      184,796         2,524          5.48                178,764          2,425           5.42        178,075        2,410      5.43
  Credit card - domestic                                                                         68,169         2,180         12.94                 56,858          1,747          12.19         51,310        1,373     10.85
  Credit card - foreign                                                                           8,403           287         13.86                      -              -              -              -            -         -
  Home equity lines                                                                              64,198         1,112          7.02                 60,571          1,012           6.63         51,477          692      5.45
  Direct/Indirect consumer                                                                       55,025           986          7.24                 47,181            703           5.91         41,620          573      5.58
                   (4)
  Other consumer                                                                                 10,357           272         10.59                  6,653            184          11.01          7,305          158      8.75
    Total consumer                                                                              390,948         7,361          7.60                350,027          6,071           6.90        329,787        5,206      6.37
  Commercial - domestic (2)                                                                     144,693         2,379          6.66                137,224          2,168           6.26        123,803        1,538      5.04
  Commercial real estate                                                                         36,676           632          6.99                 36,017            597           6.58         33,016          430      5.29
  Commercial lease financing                                                                     20,512           247          4.82                 20,178            241           4.79         20,745          260      5.01
  Commercial - foreign(2)                                                                        23,139           426          7.46                 20,143            377           7.44         17,570          257      5.94
    Total commercial                                                                            225,020         3,684          6.63                213,562          3,383           6.29        195,134        2,485      5.16
        Total loans and leases                                                                  615,968        11,045          7.24                563,589          9,454           6.67        524,921        7,691      5.92
Other earning assets (2)                                                                         46,618           728          6.31                 40,582            615           6.01         35,466          506      5.77
        Total earning assets - excluding hedge impact                                         1,219,611        18,381          6.07              1,145,550         16,232            5.64      1,044,891      12,915       4.98
Net derivative income (expense) on assets                                                                             8                                                29                                        421
       Total earning assets - including hedge impact                                         1,219,611         18,389          6.08             1,145,550          16,261            5.65      1,044,891      13,336       5.14
Cash and cash equivalents                                                                       34,857                                             33,693                                         31,382
Other assets, less allowance for loan and lease losses                                         161,905                                            125,814                                        124,586
       Total assets                                                                         $1,416,373                                         $1,305,057                                     $1,200,859

Interest-bearing liabilities
Domestic interest-bearing deposits:
  Savings                                                                                    $ 35,550           $ 76           0.87 %           $ 35,535           $ 68              0.76 %   $ 37,000         $ 35        0.39 %
                                                (2)
  NOW and money market deposit accounts                                                       227,606              906         1.61              224,122              721            1.28      233,392            635      1.10
  Consumer CDs and IRAs (2)                                                                   135,068           1,022          3.07              120,321              828            2.73      118,989            649      2.21
                                                          (2)
  Negotiable CDs, public funds and other time deposits                                           8,551              68         3.21                 5,085              26            2.02        10,291            66      2.61
     Total domestic interest-bearing deposits                                                  406,775           2,072         2.07               385,063           1,643            1.69       399,672         1,385      1.41
                                  (5)
Foreign interest-bearing deposits :
  Banks located in foreign countries (2)                                                         30,116            403         5.43                 24,451            326            5.30        22,085          199       3.66
  Governments and official institutions                                                          10,200            107         4.25                  7,579             73            3.84         6,831           43       2.58
  Time, savings and other                                                                        35,136            245         2.83                 32,624            203            2.46        30,770          133       1.75
     Total foreign interest-bearing deposits                                                     75,452            755         4.06                 64,654            602            3.70        59,686          375       2.55
       Total interest-bearing deposits                                                          482,227          2,827         2.38                449,717          2,245            1.98       459,358        1,760       1.55
Federal funds purchased, securities sold under agreements
                                                    (2)
  to repurchase and other short-term borrowings                                                 399,896          4,375         4.43                364,140          3,789            4.13       276,483        1,837       2.69
Trading account liabilities                                                                      52,466            517         3.99                 56,880            619            4.32        44,507          427       3.89
                (2)
Long-term debt                                                                                  117,018          1,494         5.11                 99,601          1,252            5.03        96,167        1,102       4.58
       Total interest-bearing liabilities - excluding hedge impact                            1,051,607          9,213         3.54                970,338          7,905            3.24       876,515        5,126       2.37
Net derivative (income) expense on liabilities                                                                     136                                                254                                        504
        Total interest-bearing liabilities - including hedge impact                           1,051,607          9,349         3.60                970,338          8,159            3.34       876,515        5,630       2.60
Noninterest-bearing sources:
  Noninterest-bearing deposits                                                                 177,594                                            179,205                                        168,062
  Other liabilities                                                                             56,019                                             55,566                                         56,881
  Shareholders' equity                                                                         131,153                                             99,948                                         99,401
        Total liabilities and shareholders' equity                                          $1,416,373                                         $1,305,057                                     $1,200,859
Net interest spread                                                                                                            2.53                                                  2.40                                  2.61
Impact of noninterest-bearing sources                                                                                          0.49                                                  0.50                                  0.38
      Net interest income/yield on earning assets - excluding hedge impact                                     $9,168          3.02                                $8,327            2.90                     $7,789       2.99
Net impact of derivative hedge income/(expense)                                                                  (128)        (0.04)                                 (225)          (0.08)                       (83)     (0.03)
      Net interest income/yield on earning assets                                                              $9,040          2.98 %                              $8,102            2.82 %                   $7,706       2.96 %


(1) This table presents a non-GAAP financial measure. The impact of interest rate risk management derivatives is shown separately. Interest income and interest expense amounts, and the yields and
    and rates have been adjusted. Management believes this presentation is useful to investors because it adjusts for the impact of our hedging decisions and provides a better understanding of our
    hedging activities. The impact of interest rate management derivatives is not material to the average balances presented above.
(2) Interest income excludes the impact of interest rate risk management contracts, which increased(decreased) interest income on time deposits placed and other short-term investments $(3) million,
    federal funds sold and securities purchased under agreements to resell $(91) million, commercial - domestic $111 million, commercial - foreign $1 million, and other earning assets $(10) million
    in the first quarter of 2006. Interest expense excludes the impact of interest rate risk management contracts which increased(decreased) interest expense on NOW and money market deposit
    accounts $2 million, consumer CDs and IRAs $155 million, negotiable CDs, public funds and other time deposits $2 million, banks located in foreign countries $21 million, federal funds
    purchased, securities sold under agreements to repurchase and other short-term borrowings $(66) million and long-term debt $22 million in the first quarter of 2006. Interest income excludes
    the impact of interest rate risk management contracts, which increased(decreased) interest income on time deposits placed and other short-term investments $(2) million, federal funds sold
    and securities purchased under agreements to resell $(61) million, securities $(1) million, residential mortgage $(1) million, commercial - domestic $112 million, commercial - foreign
    $1 million, and other earning assets $(19) million in the fourth quarter of 2005. Interest expense excludes the impact of interest rate risk management contracts which increased(decreased)
    interest expense on consumer CDs and IRAs $201 million, negotiable CDs, public funds and other time deposits $1 million, banks located in foreign countries $29 million, federal funds purchased,
    securities sold under agreements to repurchase and other short-term borrowings $66 million and long-term debt $(43) million in the three months ended December 31, 2005. Interest income
    excludes the impact of interest rate risk management contracts, which increased(decreased) interest income on time deposits placed and other short-term investments $(1) million, federal
    funds sold and securities purchased under agreements to resell $53 million, securities $(3) million, residential mortgage $5 million, commercial - domestic $416 million, commercial - foreign
    $2 million, and other earning assets $(51) million in the first quarter of 2005. Interest expense excludes the impact of interest rate risk management contracts which increased(decreased)
    interest expense on NOW and money market deposit accounts $16 million, consumer CDs and IRAs $316 million, negotiable CDs, public funds and other time deposits $29 million, banks
    located in foreign countries $61 million, federal funds purchased, securities sold under agreements to repurchase and other short-term borrowings $151 million and long-term debt $(69) million
    in the first quarter of 2005.
(3) Nonperforming loans are included in the respective average loan balances. Income on these nonperforming loans is recognized on a cash basis.
(4) Includes consumer finance of $3,012 million in the first quarter of 2006, and $2,916 million and $3,362 million in the fourth and first quarters of 2005; foreign consumer of $7,328 million in the
    first quarter of 2006, and $3,682 million and $3,532 million in the fourth and first quarters of 2005; and consumer lease financing of $17 million in the first quarter of 2006, and $55 million
    and $411 million in the fourth and first quarters of 2005.
(5) Primarily consists of time deposits in denominations of $100,000 or more.


                                                          Information for periods beginning January 1, 2006 includes the MBNA acquisition; prior periods have not been restated.                                                    8
Bank of America Corporation
Business Segment View
                                                                                   Net Income
                                                                                First Quarter 2006


                                                                                                                               Global Wealth and Investment
                                                                                                                                       Management
                                                                                                                                          12%


                                                                                                                                                                              Global Corporate and Investment
                                                                                                                                                                                         Banking
                                                                                                                                                                                          32%
          Global Consumer and Small Business
                      Banking
                       54%                                                                                                         All Other
                                                                                                                                      2%


                                                                                             Revenue*
                                                                                        First Quarter 2006
                                                                                                                                                            Global Corporate and Investment
                                                                                                                                                                       Banking
                                                                                                                                                                         31%


                                                                                                                                                                    Global Wealth and Investment
                                                                                                                                                                            Management
                                                                                                                                                                                11%
                                                                                                                                               All Other
                          Global Consumer and Small Business                                                                                      1%
                                      Banking
                                        57%


  *Fully taxable-equivalent basis


                                               Information for periods beginning January 1, 2006 includes the MBNA acquisition; prior periods have not been restated.                                           9
Bank of America Corporation
                                                                                                                        (1)
Global Consumer and Small Business Banking Segment Results
(Dollars in millions; except as noted)


                                                             First                  Fourth                  Third                Second              First
                                                            Quarter                 Quarter                Quarter               Quarter            Quarter
                                                             2006                    2005                   2005                  2005               2005
Net interest income(2)                                        $5,400                  $4,325                 $4,224                $4,089             $4,215
Noninterest income
Service charges                                                   1,190                  1,262                  1,386                 1,244            1,104
Mortgage banking income                                             205                    271                    230                   237              274
Card income                                                       3,268                  1,325                  1,344                 1,272            1,144
All other income                                                    138                     97                     70                    57              116
  Total noninterest income                                        4,801                  2,955                  3,030                 2,810            2,638
Total revenue(2)                                                 10,201                  7,280                  7,254                 6,899            6,853

Provision for credit losses                                       1,257                 1,299                  1,107                  1,155              710
Gains (losses) on sales of debt securities                           (1)                   (1)                    (1)                     -               (1)
Noninterest expense                                               4,693                 3,325                  3,271                  3,346            3,238
Income before income taxes                                        4,250                 2,655                  2,875                  2,398            2,904
Income tax expense                                                1,575                   945                  1,051                    866            1,026
Net income                                                       $2,675                $1,710                 $1,824                 $1,532           $1,878

Shareholder value added                                          $1,310                   $970                $1,159                   $874           $1,240
Net interest yield(2)                                              7.60 %                 5.76     %             5.59    %             5.53     %       5.68    %
Return on average equity                                          16.89                  21.56                  24.99                 21.14            26.46
Efficiency ratio(2)                                               46.01                  45.68                  45.10                 48.49            47.25

Balance Sheet
Average
Total loans and leases                                        $187,048              $149,239               $145,714               $141,352          $139,644
Total earning assets                                           288,311               297,747                299,673                296,573           301,193
Total assets                                                   349,802               325,538                326,940                323,087           329,620
Total deposits                                                 330,204               306,579                310,485                306,471           300,562
Common equity/Allocated equity                                  64,228                31,463                 28,964                 29,077            28,789

Period End
Total loans and leases                                        $184,236              $151,646               $147,702               $143,074          $138,873
Total assets                                                   359,131               331,244                327,004                324,786           331,769
Total deposits                                                 340,437               306,064                313,022                307,340           306,089

Period End (in billions)
Mortgage servicing portfolio                                     $302.4                $296.8                 $288.5                 $280.1           $275.5


(1) Global Consumer and Small Business Banking's most significant product groups are Deposits, Mortgage, Card Services, Home Equity Line of Credit
    (HELOC), and Other.
(2) Fully taxable-equivalent basis


Certain prior period amounts have been reclassified among the segments to conform to the current period presentation.


                           Information for periods beginning January 1, 2006 includes the MBNA acquisition; prior periods have not been restated.               10
Bank of America Corporation
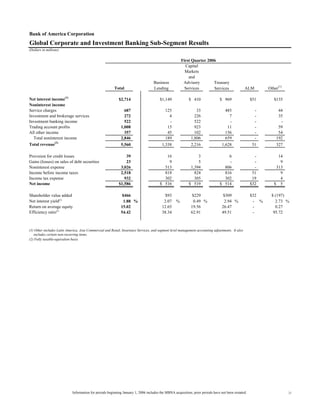
Global Consumer and Small Business Banking Sub-Segment Results
(Dollars in millions)

                                                                                                          First Quarter 2006
                                                                                                                       Card
                                                       Total                    Deposits (1)          Mortgage      Services (2)             HELOC            ALM       Other

Net interest income(3)                                    $5,400                     $ 2,351               $ 146             $ 2,210             $ 334        $ 315     $ 44
Noninterest income
Service charges                                             1,190                      1,190                   -                   -                 -              -        -
Mortgage banking income                                       205                          -                 188                   -                17              -        -
Card income                                                 3,268                        444                   -               2,824                 -              -        -
All other income                                              138                          -                  13                 244                 -              -     (119)
  Total noninterest income                                  4,801                      1,634                 201               3,068                17              -     (119)
               (3)
Total revenue                                             10,201                       3,985                 347               5,278               351         315         (75)

Provision for credit losses                                1,257                          28                  4                1,166                12            -         47
Gains (losses) on sales of debt securities                    (1)                          -                  -                    -                 -            -         (1)
Noninterest expense                                        4,693                       2,206                229                2,016               154            -         88
Income before income taxes                                 4,250                       1,751                114                2,096               185          315       (211)
Income tax expense                                         1,575                         649                 42                  777                69          117        (79)
Net income                                                $2,675                     $ 1,102               $ 72              $ 1,319             $ 116        $ 198     $ (132)

Shareholder value added                                   $1,310                        $784                 $21                $578               $85        $ 198     $ (356)
Net interest yield(3)                                       7.60 %                      2.76 %              1.72 %              9.15 %            2.56 %         - %       n/m
Return on average equity                                   16.89                       29.93               15.25               14.07             40.08           -         n/m
Efficiency ratio(3)                                        46.01                       55.37               65.86               38.19             43.79           -         n/m


(1) Deposit balances reflect Premier migration average impact of $45.4 billion for the three months ended March 31, 2006.
(2) Card Services presented on a held view
(3) Fully taxable-equivalent basis
 n/m = not meaningful


                                     Information for periods beginning January 1, 2006 includes the MBNA acquisition; prior periods have not been restated.                       11
Bank of America Corporation
Global Consumer and Small Business Banking Sub-Segment Results
(Dollars in millions)

                                                                                                           First Quarter 2005
                                                                                                                         Card
                                                        Total                    Deposits (1)         Mortgage       Services (2)             HELOC            ALM       Other

Net interest income(3)                                     $4,215                     $1,970                $ 192             $ 1,148             $ 304        $ 547        $ 54
Noninterest income
Service charges                                             1,104                       1,104                   -                   -                 -              -        -
Mortgage banking income                                       274                           -                 256                   -                19              -       (1)
Card income                                                 1,144                         352                   -                 792                 -              -        -
All other income                                              116                           -                   4                  55                 -              -       57
  Total noninterest income                                  2,638                       1,456                 260                 847                19              -       56
Total revenue(3)                                            6,853                       3,426                 452               1,995               323         547         110

Provision for credit losses                                   710                         (7)                   6                698                 8             -           5
Gains (losses) on sales of debt securities                     (1)                         -                    -                  -                 -             -          (1)
Noninterest expense                                         3,238                      1,931                  276                758               182             -         91
Income before income taxes                                  2,904                      1,502                  170                539               133           547         13
Income tax expense                                          1,026                        530                   60                190                47           194           5
Net income                                                 $1,878                     $ 972                 $ 110              $ 349              $ 86         $ 353        $ 8

Shareholder value added                                    $1,240                        $648                 $66                $260               $57         $353      $(144)
Net interest yield(3)                                        5.68 %                      2.53 %              2.11 %              8.75 %            2.76 %          - %      n/m
Return on average equity                                    26.46                       26.13               26.87               26.62             33.06            -        n/m
Efficiency ratio(3)                                         47.25                       56.37               61.17               37.97             56.35            -        n/m


(1) Deposit balances reflect Premier migration average impact of $32.4 billion for the three months ended March 31, 2006.
(2) Card Services presented on a held view
(3) Fully taxable-equivalent basis
 n/m = not meaningful


                                      Information for periods beginning January 1, 2006 includes the MBNA acquisition; prior periods have not been restated.                        12
Bank of America Corporation
Global Consumer and Small Business Banking - Key Indicators
(Dollars in millions; except as noted)

                                                                   First                 Fourth                  Third                 Second                  First
                                                                  Quarter                Quarter                Quarter                Quarter                Quarter
                                                                   2006                   2005                   2005                   2005                   2005

Deposits Key Indicators
Average Deposit Balances
 Checking                                                           $ 126,333              $ 125,491              $ 124,398              $ 123,022             $ 119,750
 Savings                                                               32,104                 31,897                 32,016                 32,465                31,496
 MMS                                                                   76,920                 71,936                 68,841                 67,659                69,742
 CD's & IRA's                                                          84,836                 69,375                 76,779                 75,720                73,147
 Foreign and Other                                                     10,011                  7,880                  8,451                  7,605                 6,427
    Total                                                           $ 330,204              $ 306,579              $ 310,485              $ 306,471             $ 300,562

  Average Cumulative Balances migrated to
   Premier Banking and Investments                                      $ 45,367            $ 44,692               $ 41,672               $ 38,257              $ 32,407

Deposit Spreads (excludes noninterest costs)
 Checking                                                                   4.18 %                4.16 %                 4.18 %                 4.14 %                4.24 %
  Savings                                                                   3.36                  3.53                   3.78                   4.02                  4.38
  MMS                                                                       2.53                  2.69                   2.02                   1.64                  1.43
  CD's & IRA's                                                              1.21                  1.19                   0.90                   0.80                  0.66
  Foreign and Other                                                         3.68                  4.19                   3.88                   3.67                  3.52
    Total                                                                   2.93                  3.06                   2.82                   2.72                  2.70

Net New Checking (units in thousands)                                       603                   426                    635                    629                   611
Debit Purchase Volumes                                                   38,618                 39,623                 36,008                 35,049                31,230


Online Banking (End of Period)
  Active Accounts (units in thousands)                                   19,643                 14,698                 14,338                 13,514                13,047
Active Billpay Accounts (units in thousands)                             10,088                  7,281                  6,987                  6,529                 6,256


Credit Key Indicators
Managed Card - North American Only
  Gross Interest Yield                                                    12.65 %                12.25 %                11.99 %                11.58 %               11.27 %
                         (1)
  Risk Adjusted Margin                                                    10.26                   4.25                   8.36                   7.72                  7.63
  Loss Rates                                                             3.12                   9.49                   5.74                   6.23                  6.17
  Average Outstandings (in millions)                                $ 143,463               $ 59,722               $ 59,762               $ 58,537              $ 58,145
  New Account Growth (in thousands)                                     2,076                    930                  1,466                  1,564                 1,353
  Purchase Volumes (in millions)                                       49,568                 24,116                 22,736                 21,577                19,134
  Delinquencies
    30 Day                                                                  4.45 %                4.17 %                 4.59 %                 4.25 %                4.20 %
    60 Day                                                                  2.99                  2.93                   3.21                   2.88                  2.98
    12 month Lag Loss Rate                                                  3.24                 10.04                   6.30                   6.94                  6.67

Mortgage
 Mortgage Originations (in millions)                                 $ 17,262               $ 20,662               $ 27,511               $ 21,135              $ 17,471
 Mortgage Servicing Rights
   Period End Balance (in millions)                                       2,925                  2,658                  2,623                  2,233                 2,547
 Capitalized Mortgage Servicing Rights
     (% of loans serviced)                                                  132    bps             122   bps              124   bps              108    bps            128   bps
 Mortgage Loans Serviced for Investors (in billions)                $       221             $      218             $      212             $      207            $      199
 Home Equity Originations (in millions)                                  18,589                 19,670                 17,897                 19,379                15,033


(1) Reflects margin and noninterest revenue, adjusted for loss rates.


                               Information for periods beginning January 1, 2006 includes the MBNA acquisition; prior periods have not been restated.                          13
Supplemental First Quarter 2006 Financial Information

More Related Content

Supplemental First Quarter 2006 Financial Information

  • 1. Supplemental Information First Quarter 2006 This information is preliminary and based on company data available at the time of the presentation. It speaks only as of the particular date or dates included in the accompanying pages. Bank of America does not undertake an obligation to, and disclaims any duty to, correct or update any of the information provided. Any forward-looking statements in this information are subject to the forward-looking language contained in Bank of America's reports filed with the SEC pursuant to the Securities Exchange Act of 1934, which are available at the SEC's website (www.sec.gov) or at Bank of America's website (www.bankofamerica.com). Bank of America's future financial performance is subject to risks and uncertainties as described in its SEC filings.
  • 2. Bank of America Corporation Consolidated Financial Highlights (Dollars in millions, except per share information; shares in thousands) First Fourth Third Second First Quarter Quarter Quarter Quarter Quarter 2006 2005 2005 2005 2005 Income statement Net interest income $ 8,776 $ 7,859 $ 7,735 $ 7,637 $ 7,506 Noninterest income 8,901 5,951 6,416 6,955 6,032 Total revenue 17,677 13,810 14,151 14,592 13,538 Provision for credit losses 1,270 1,400 1,159 875 580 Gains on sales of debt securities 14 71 29 325 659 Noninterest expense 8,924 7,320 7,285 7,019 7,057 Income tax expense 2,511 1,587 1,895 2,366 2,167 Net income 4,986 3,574 3,841 4,657 4,393 Diluted earnings per common share 1.07 0.88 0.95 1.14 1.07 Average diluted common shares issued and outstanding 4,666,405 4,053,859 4,054,659 4,065,355 4,099,062 Dividends paid per common share $ 0.50 $ 0.50 $ 0.50 $ 0.45 $ 0.45 Performance ratios Return on average assets 1.43 % 1.09 % 1.18 % 1.46 % 1.49 % Return on average common shareholders' equity 15.44 14.21 15.09 18.93 17.97 At period end Book value per share of common stock $ 28.19 $ 25.32 $ 25.28 $ 25.16 $ 24.45 Market price per share of common stock: Closing price $ 45.54 $ 46.15 $ 42.10 $ 45.61 $ 44.10 High closing price for the period 47.08 46.99 45.98 47.08 47.08 Low closing price for the period 43.09 41.57 41.60 44.01 43.66 Market capitalization 208,633 184,586 168,950 183,202 177,958 Number of banking centers - domestic 5,786 5,873 5,844 5,880 5,889 Number of ATMs - domestic 16,716 16,785 16,714 16,687 16,798 Full-time equivalent employees 202,503 176,934 177,539 178,107 176,973 Certain prior period amounts have been reclassified to conform to current period presentation. Information for periods beginning January 1, 2006 includes the MBNA acquisition; prior periods have not been restated. 1
  • 3. Bank of America Corporation Supplemental Financial Data (Dollars in millions) Fully taxable-equivalent basis data First Fourth Third Second First Quarter Quarter Quarter Quarter Quarter 2006 2005 2005 2005 2005 Net interest income $ 9,040 $ 8,102 $ 7,933 $ 7,828 $ 7,706 Total revenue 17,941 14,053 14,349 14,783 13,738 Net interest yield 2.98 % 2.82 % 2.78 % 2.80 % 2.96 % Efficiency ratio 49.74 52.09 50.76 47.49 51.37 Reconciliation to GAAP financial measures Supplemental financial data presented on an operating basis is a basis of presentation not defined by accounting principles generally accepted in the United States (GAAP) that excludes merger and restructuring charges. We believe that the exclusion of merger and restructuring charges, which represent events outside our normal operations, provides a meaningful period-to-period comparison and is more reflective of normalized operations. Shareholder value added (SVA) is a key measure of performance not defined by GAAP that is used in managing our growth strategy orientation and strengthening our focus on generating long-term growth and shareholder value. SVA is used to evaluate the Corporation's use of equity (i.e. capital) at the individual unit level and is an integral component in the analytics for resource allocation. Using SVA as a performance measure places specific focus on whether incremental investments generate returns in excess of the costs of capital associated with those investments. Each business segment has a goal for growth in SVA reflecting the individual segment's business and customer strategy. Other companies may define or calculate supplemental financial data differently. See the tables below for supplemental financial data and corresponding reconciliations to GAAP financial measures for the quarters ended March 31, 2006, December 31, 2005, September 30, 2005, June 30, 2005 and March 31, 2005. Reconciliation of net income to operating earnings First Fourth Third Second First Quarter Quarter Quarter Quarter Quarter 2006 2005 2005 2005 2005 Net income $ 4,986 $ 3,574 $ 3,841 $ 4,657 $ 4,393 Merger and restructuring charges 98 59 120 121 112 Related income tax benefit (37) (19) (40) (41) (37) Operating earnings $ 5,047 $ 3,614 $ 3,921 $ 4,737 $ 4,468 Reconciliation of average common shareholders' equity to average tangible common shareholders' equity Average common shareholders' equity $ 130,881 $ 99,677 $ 100,974 $ 98,558 $ 99,130 Average goodwill (66,094) (45,305) (45,297) (45,379) (45,346) Average tangible common shareholders' equity $ 64,787 $ 54,372 $ 55,677 $ 53,179 $ 53,784 Operating basis Diluted earnings per common share $1.08 $0.89 $0.97 $1.16 $1.09 Return on average assets 1.45 % 1.10 % 1.20 % 1.49 % 1.51 % Return on average common shareholders' equity 15.63 14.36 15.39 19.26 18.26 Return on average tangible common shareholders' equity 31.57 26.33 27.91 35.70 33.66 Efficiency ratio 49.19 51.66 49.92 46.67 50.55 Reconciliation of net income to shareholder value added Net income $ 4,986 $ 3,574 $ 3,841 $ 4,657 $ 4,393 Amortization of intangibles 440 196 201 204 208 Merger and restructuring charges, net of tax benefit 61 40 80 80 75 Capital charge (3,550) (2,764) (2,799) (2,703) (2,689) Shareholder value added $ 1,937 $ 1,046 $ 1,323 $ 2,238 $ 1,987 Certain prior period amounts have been reclassified to conform to current period presentation. Information for periods beginning January 1, 2006 includes the MBNA acquisition; prior periods have not been restated. 2
  • 4. Bank of America Corporation Consolidated Statement of Income (Dollars in millions, except per share information; shares in thousands) First Fourth Third Second First Quarter Quarter Quarter Quarter Quarter 2006 2005 2005 2005 2005 Interest income Interest and fees on loans and leases $ 11,127 $ 9,536 $ 8,933 $ 8,294 $ 8,080 Interest and dividends on securities 3,014 2,815 2,793 2,796 2,533 Federal funds sold and securities purchased under agreements to resell 1,709 1,477 1,382 1,249 904 Trading account assets 1,548 1,585 1,550 1,426 1,182 Other interest income 727 605 547 502 437 Total interest income 18,125 16,018 15,205 14,267 13,136 Interest expense Deposits 3,007 2,476 2,471 2,363 2,182 Short-term borrowings 4,309 3,855 3,190 2,582 1,988 Trading account liabilities 517 619 707 611 427 Long-term debt 1,516 1,209 1,102 1,074 1,033 Total interest expense 9,349 8,159 7,470 6,630 5,630 Net interest income 8,776 7,859 7,735 7,637 7,506 Noninterest income Service charges 1,901 1,927 2,080 1,920 1,777 Investment and brokerage services 1,103 1,062 1,060 1,049 1,013 Mortgage banking income 137 215 180 189 221 Investment banking income 501 537 522 431 366 Equity investment gains 660 481 668 492 399 Card income 3,436 1,507 1,520 1,437 1,289 Trading account profits 1,074 299 557 222 685 Other income 89 (77) (171) 1,215 282 Total noninterest income 8,901 5,951 6,416 6,955 6,032 Total revenue 17,677 13,810 14,151 14,592 13,538 Provision for credit losses 1,270 1,400 1,159 875 580 Gains on sales of debt securities 14 71 29 325 659 Noninterest expense Personnel 4,813 3,845 3,837 3,671 3,701 Occupancy 701 699 638 615 636 Equipment 344 305 300 297 297 Marketing 575 265 307 346 337 Professional fees 218 283 254 216 177 Amortization of intangibles 440 196 201 204 208 Data processing 410 394 361 368 364 Telecommunications 220 219 206 196 206 Other general operating 1,105 1,055 1,061 985 1,019 Merger and restructuring charges 98 59 120 121 112 Total noninterest expense 8,924 7,320 7,285 7,019 7,057 Income before income taxes 7,497 5,161 5,736 7,023 6,560 Income tax expense 2,511 1,587 1,895 2,366 2,167 Net income $ 4,986 $ 3,574 $ 3,841 $ 4,657 $ 4,393 Net income available to common shareholders $ 4,981 $ 3,570 $ 3,836 $ 4,653 $ 4,388 Per common share information Earnings $ 1.08 $ 0.89 $ 0.96 $ 1.16 $ 1.09 Diluted earnings $ 1.07 $ 0.88 $ 0.95 $ 1.14 $ 1.07 Dividends paid $ 0.50 $ 0.50 $ 0.50 $ 0.45 $ 0.45 Average common shares issued and outstanding 4,609,481 3,996,024 4,000,573 4,005,356 4,032,550 Average diluted common shares issued and outstanding 4,666,405 4,053,859 4,054,659 4,065,355 4,099,062 Certain prior period amounts have been reclassified to conform to current period presentation. Information for periods beginning January 1, 2006 includes the MBNA acquisition; prior periods have not been restated. 3
  • 5. Bank of America Corporation Consolidated Balance Sheet March 31 December 31 March 31 (Dollars in millions) 2006 2005 2005 Assets Cash and cash equivalents $ 32,575 $ 36,999 $ 28,698 Time deposits placed and other short-term investments 11,157 12,800 11,223 Federal funds sold and securities purchased under agreements to resell 137,081 149,785 139,396 Trading account assets 117,181 131,707 124,960 Derivative assets 23,291 23,712 26,182 Securities: Available-for-sale 237,987 221,556 218,675 Held-to-maturity, at cost 86 47 275 Total securities 238,073 221,603 218,950 Loans and leases 619,525 573,791 529,457 Allowance for loan and lease losses (9,067) (8,045) (8,313) Loans and leases, net of allowance 610,458 565,746 521,144 Premises and equipment, net 9,267 7,786 7,531 Mortgage servicing rights ($2,925 measured at fair value at March 31, 2006) 3,070 2,806 2,667 Goodwill 66,271 45,354 45,378 Core deposit intangibles and other intangibles 10,681 3,194 3,679 Other assets 115,975 90,311 82,421 Total assets $ 1,375,080 $ 1,291,803 $ 1,212,229 Liabilities Deposits in domestic offices: Noninterest-bearing $ 179,358 $ 179,571 $ 166,499 Interest-bearing 415,769 384,155 403,534 Deposits in foreign offices: Noninterest-bearing 6,874 7,165 5,319 Interest-bearing 80,448 63,779 54,635 Total deposits 682,449 634,670 629,987 Federal funds purchased and securities sold under agreements to repurchase 236,919 240,655 187,652 Trading account liabilities 51,100 50,890 53,434 Derivative liabilities 15,541 15,000 15,363 Commercial paper and other short-term borrowings 99,389 116,269 93,440 Accrued expenses and other liabilities (includes $396, $395 and $394 of reserve for unfunded lending commitments) 37,078 31,938 35,319 Long-term debt 123,178 100,848 98,107 Total liabilities 1,245,654 1,190,270 1,113,302 Shareholders' equity Preferred stock, $0.01 par value; authorized - 100,000,000 shares; issued and outstanding - 1,090,189 shares 271 271 271 Common stock and additional paid-in capital, $0.01 par value; authorized - 7,500,000,000 shares; issued and outstanding - 4,581,317,964; 3,999,688,491 and 4,035,318,509 shares 68,705 41,693 43,589 Retained earnings 70,204 67,552 61,309 Accumulated other comprehensive income (loss) (8,981) (7,556) (5,617) Other (773) (427) (625) Total shareholders' equity 129,426 101,533 98,927 Total liabilities and shareholders' equity $ 1,375,080 $ 1,291,803 $ 1,212,229 Certain prior period amounts have been reclassified to conform to current period presentation. Information for periods beginning January 1, 2006 includes the MBNA acquisition; prior periods have not been restated. 4
  • 6. Bank of America Corporation Capital Management (Dollars in millions) First Fourth Third Second First Quarter Quarter Quarter Quarter Quarter 2006(1) 2005 2005 2005 2005 Tier 1 capital $ 83,201 $ 74,375 $ 73,572 $ 69,633 $ 67,593 Total capital 111,481 99,901 99,531 95,760 94,240 Risk-weighted assets 984,190 901,469 889,643 853,086 817,862 Tier 1 capital ratio 8.45 % 8.25 % 8.27 % 8.16 % 8.26 % Total capital ratio 11.33 11.08 11.19 11.23 11.52 Tangible equity ratio(2) 4.04 4.26 4.41 4.38 4.29 Tier 1 leverage ratio 6.18 5.91 5.90 5.66 5.86 (1) Preliminary data on risk-based capital (2) Tangible equity ratio equals shareholders' equity less goodwill, core deposit intangibles and other intangibles divided by total assets less goodwill, core deposit intangibles and other intangibles. Share Repurchase Program 88.5 million common shares were repurchased in the first quarter of 2006 as a part of an ongoing share repurchase program. 65.7 million shares remain outstanding under the 2005 authorized program. 670.1 million shares were issued in the first quarter of 2006, of which 631.1 million were issued in the MBNA acquisition. 0.0821 Capital Management 5,000 9.00% 1,575 0.09 0.085 4,300 0.082 0.0821 4,581 1,550 4,500 0.0814,047 4,035 4,017 0.0806 4,000 0.085 (Shares in millions) 0.0825 8.48% 0.0821 0.082 0.08 0.081 4,013 1,525 0.0806 3,800 4,035 4,017 4,013 4,000 4,000 8.45% 8.50% 8.48% 0.08 0.0773 1,500 8.26% 8.27% 8.25% 0.075 3,300 3,500 8.16% 0.075 1,475 1,450 3,000 2,800 8.00% 0.07 Dec-04 37865 Mar-05 Dec-04 Jun-05 Mar-05 Mar-05 37956 Sep-05 Jun-05 Jun-05 Dec-05 38047 Sep-05 Sep-05 38139 Mar-06* Dec-05* Shares outstanding at period end end Shares outstanding at period end Shares outstanding atat period Shares outstanding period end Tier 1 capital ratio ratio Tier Tier capital ratio Tiercapital ratio 1 1 1 capital *Preliminary data on risk-based capital Information for periods beginning January 1, 2006 includes the MBNA acquisition; prior periods have not been restated. 5
  • 7. Bank of America Corporation Core Net Interest Income - Managed Basis (Dollars in millions) First Fourth Third Second First Quarter Quarter Quarter Quarter Quarter 2006 2005 2005 2005 2005 Net Interest Income As reported (fully taxable-equivalent basis) $ 9,040 $8,102 $7,933 $7,828 $7,706 Impact of market based net interest income (410) (419) (449) (519) (546) Core net interest income 8,630 7,683 7,484 7,309 7,160 Impact of securitizations 1,897 11 52 106 155 Core net interest income - managed basis $10,527 $7,694 $7,536 $7,415 $7,315 Average Earning Assets As reported $1,219,611 $1,145,550 $1,137,629 $1,118,518 $1,044,891 Impact of market based earning assets (336,496) (329,237) (334,992) (338,490) (285,414) Core average earning assets 883,115 816,313 802,637 780,028 759,477 Impact of securitizations 96,268 6,447 7,827 10,773 11,151 Core average earning assets - managed basis $ 979,383 $ 822,760 $ 810,464 $ 790,801 $ 770,628 Net Interest Yield Contribution As reported (fully taxable-equivalent basis) 2.98 % 2.82 % 2.78 % 2.80 % 2.96 % Impact of market based activities 0.95 0.93 0.94 0.95 0.82 Core net interest yield on earning assets 3.93 3.75 3.72 3.75 3.78 Impact of securitizations 0.39 (0.02) (0.01) - 0.03 Core net interest yield on earning assets - managed basis 4.32 % 3.73 % 3.71 % 3.75 % 3.81 % Certain prior period amounts have been restated reflecting realignment of business segments. Information for periods beginning January 1, 2006 includes the MBNA acquisition; prior periods have not been restated. 6
  • 8. Bank of America Corporation Quarterly Average Balances and Interest Rates - Fully Taxable-equivalent Basis (Dollars in millions) First Quarter 2006 Fourth Quarter 2005 First Quarter 2005 Interest Interest Interest Average Income/ Yield/ Average Income/ Yield/ Average Income/ Yield/ Balance Expense Rate Balance Expense Rate Balance Expense Rate Earning assets Time deposits placed and other short-term investments $ 14,347 $ 139 3.92 % $ 14,619 $ 132 3.59 % $ 14,327 $ 101 2.87 % Federal funds sold and securities purchased under agreements to resell 174,711 1,709 3.94 165,908 1,477 3.55 147,855 904 2.46 Trading account assets 133,361 1,623 4.89 139,441 1,648 4.72 117,748 1,203 4.10 Securities 234,606 3,043 5.19 221,411 2,842 5.13 204,574 2,559 5.01 Loans and leases (1): Residential mortgage 184,796 2,524 5.48 178,764 2,424 5.42 178,075 2,415 5.44 Credit card - domestic 68,169 2,180 12.94 56,858 1,747 12.19 51,310 1,373 10.85 Credit card - foreign 8,403 287 13.86 - - - - - - Home equity lines 64,198 1,112 7.02 60,571 1,012 6.63 51,477 692 5.45 Direct/Indirect consumer 55,025 986 7.24 47,181 703 5.91 41,620 573 5.58 Other consumer(2) 10,357 272 10.59 6,653 184 11.01 7,305 158 8.75 Total consumer 390,948 7,361 7.60 350,027 6,070 6.90 329,787 5,211 6.38 Commercial - domestic 144,693 2,490 6.97 137,224 2,280 6.59 123,803 1,954 6.40 Commercial real estate 36,676 632 6.99 36,017 597 6.58 33,016 430 5.29 Commercial lease financing 20,512 247 4.82 20,178 241 4.79 20,745 260 5.01 Commercial - foreign 23,139 427 7.48 20,143 378 7.45 17,570 259 5.97 Total commercial 225,020 3,796 6.83 213,562 3,496 6.50 195,134 2,903 6.03 Total loans and leases 615,968 11,157 7.32 563,589 9,566 6.75 524,921 8,114 6.25 Other earning assets 46,618 718 6.22 40,582 596 5.83 35,466 455 5.19 Total earning assets (3) 1,219,611 18,389 6.08 1,145,550 16,261 5.65 1,044,891 13,336 5.14 Cash and cash equivalents 34,857 33,693 31,382 Other assets, less allowance for loan and lease losses 161,905 125,814 124,586 Total assets $1,416,373 $1,305,057 $1,200,859 Interest-bearing liabilities Domestic interest-bearing deposits: Savings $ 35,550 $ 76 0.87 % $ 35,535 $ 68 0.76 % $ 37,000 $ 35 0.39 % NOW and money market deposit accounts 227,606 908 1.62 224,122 721 1.28 233,392 651 1.13 Consumer CDs and IRAs 135,068 1,177 3.53 120,321 1,029 3.39 118,989 965 3.29 Negotiable CDs, public funds and other time deposits 8,551 70 3.30 5,085 27 2.13 10,291 95 3.73 Total domestic interest-bearing deposits 406,775 2,231 2.22 385,063 1,845 1.90 399,672 1,746 1.77 Foreign interest-bearing deposits (4): Banks located in foreign countries 30,116 424 5.71 24,451 355 5.77 22,085 260 4.77 Governments and official institutions 10,200 107 4.25 7,579 73 3.84 6,831 43 2.58 Time, savings and other 35,136 245 2.83 32,624 203 2.46 30,770 133 1.75 Total foreign interest-bearing deposits 75,452 776 4.17 64,654 631 3.87 59,686 436 2.96 Total interest-bearing deposits 482,227 3,007 2.53 449,717 2,476 2.18 459,358 2,182 1.93 Federal funds purchased, securities sold under agreements to repurchase and other short-term borrowings 399,896 4,309 4.37 364,140 3,855 4.20 276,483 1,988 2.91 Trading account liabilities 52,466 517 3.99 56,880 619 4.32 44,507 427 3.89 Long-term debt 117,018 1,516 5.18 99,601 1,209 4.85 96,167 1,033 4.30 Total interest-bearing liabilities (3) 1,051,607 9,349 3.60 970,338 8,159 3.34 876,515 5,630 2.60 Noninterest-bearing sources: Noninterest-bearing deposits 177,594 179,205 168,062 Other liabilities 56,019 55,566 56,881 Shareholders' equity 131,153 99,948 99,401 Total liabilities and shareholders' equity $1,416,373 $1,305,057 $1,200,859 Net interest spread 2.48 2.31 2.54 Impact of noninterest-bearing sources 0.50 0.51 0.42 Net interest income/yield on earning assets $9,040 2.98 % $8,102 2.82 % $7,706 2.96 % (1) Nonperforming loans are included in the respective average loan balances. Income on these nonperforming loans is recognized on a cash basis. (2) Includes consumer finance of $3,012 million in the first quarter of 2006, and $2,916 million and $3,362 million in the fourth and first quarters of 2005; foreign consumer of $7,328 million in the first quarter of 2006, and $3,682 million and $3,532 million in the fourth and first quarters of 2005; and consumer lease financing of $17 million in the first quarter of 2006, and $55 million and $411 million in the fourth and first quarters of 2005. (3) Interest income includes the impact of interest rate risk management contracts, which increased interest income on the underlying assets $8 million in the first quarter of 2006, and $29 million and $421 million in the fourth and first quarters of 2005. Interest expense includes the impact of interest rate risk management contracts, which increased interest expense on the underlying liabilities $136 million in the first quarter of 2006, and $254 million and $504 million in the fourth and first quarters of 2005. (4) Primarily consists of time deposits in denominations of $100,000 or more. Information for periods beginning January 1, 2006 includes the MBNA acquisition; prior periods have not been restated. 7
  • 9. Bank of America Corporation Quarterly Average Balances and Interest Rates - Fully Taxable-equivalent Basis - Isolating Derivative Hedge Income/Expense (1) (Dollars in millions) First Quarter 2006 Fourth Quarter 2005 First Quarter 2005 Interest Interest Interest Average Income/ Yield/ Average Income/ Yield/ Average Income/ Yield/ Balance Expense Rate Balance Expense Rate Balance Expense Rate Earning assets (2) Time deposits placed and other short-term investments $ 14,347 $ 142 4.01 % $ 14,619 $ 134 3.63 % $ 14,327 $ 102 2.88 % Federal funds sold and securities purchased under agreements to resell (2) 174,711 1,800 4.15 165,908 1,538 3.70 147,855 851 2.32 Trading account assets 133,361 1,623 4.89 139,441 1,648 4.72 117,748 1,203 4.10 Securities(2) 234,606 3,043 5.19 221,411 2,843 5.13 204,574 2,562 5.01 Loans and leases(3): Residential mortgage (2) 184,796 2,524 5.48 178,764 2,425 5.42 178,075 2,410 5.43 Credit card - domestic 68,169 2,180 12.94 56,858 1,747 12.19 51,310 1,373 10.85 Credit card - foreign 8,403 287 13.86 - - - - - - Home equity lines 64,198 1,112 7.02 60,571 1,012 6.63 51,477 692 5.45 Direct/Indirect consumer 55,025 986 7.24 47,181 703 5.91 41,620 573 5.58 (4) Other consumer 10,357 272 10.59 6,653 184 11.01 7,305 158 8.75 Total consumer 390,948 7,361 7.60 350,027 6,071 6.90 329,787 5,206 6.37 Commercial - domestic (2) 144,693 2,379 6.66 137,224 2,168 6.26 123,803 1,538 5.04 Commercial real estate 36,676 632 6.99 36,017 597 6.58 33,016 430 5.29 Commercial lease financing 20,512 247 4.82 20,178 241 4.79 20,745 260 5.01 Commercial - foreign(2) 23,139 426 7.46 20,143 377 7.44 17,570 257 5.94 Total commercial 225,020 3,684 6.63 213,562 3,383 6.29 195,134 2,485 5.16 Total loans and leases 615,968 11,045 7.24 563,589 9,454 6.67 524,921 7,691 5.92 Other earning assets (2) 46,618 728 6.31 40,582 615 6.01 35,466 506 5.77 Total earning assets - excluding hedge impact 1,219,611 18,381 6.07 1,145,550 16,232 5.64 1,044,891 12,915 4.98 Net derivative income (expense) on assets 8 29 421 Total earning assets - including hedge impact 1,219,611 18,389 6.08 1,145,550 16,261 5.65 1,044,891 13,336 5.14 Cash and cash equivalents 34,857 33,693 31,382 Other assets, less allowance for loan and lease losses 161,905 125,814 124,586 Total assets $1,416,373 $1,305,057 $1,200,859 Interest-bearing liabilities Domestic interest-bearing deposits: Savings $ 35,550 $ 76 0.87 % $ 35,535 $ 68 0.76 % $ 37,000 $ 35 0.39 % (2) NOW and money market deposit accounts 227,606 906 1.61 224,122 721 1.28 233,392 635 1.10 Consumer CDs and IRAs (2) 135,068 1,022 3.07 120,321 828 2.73 118,989 649 2.21 (2) Negotiable CDs, public funds and other time deposits 8,551 68 3.21 5,085 26 2.02 10,291 66 2.61 Total domestic interest-bearing deposits 406,775 2,072 2.07 385,063 1,643 1.69 399,672 1,385 1.41 (5) Foreign interest-bearing deposits : Banks located in foreign countries (2) 30,116 403 5.43 24,451 326 5.30 22,085 199 3.66 Governments and official institutions 10,200 107 4.25 7,579 73 3.84 6,831 43 2.58 Time, savings and other 35,136 245 2.83 32,624 203 2.46 30,770 133 1.75 Total foreign interest-bearing deposits 75,452 755 4.06 64,654 602 3.70 59,686 375 2.55 Total interest-bearing deposits 482,227 2,827 2.38 449,717 2,245 1.98 459,358 1,760 1.55 Federal funds purchased, securities sold under agreements (2) to repurchase and other short-term borrowings 399,896 4,375 4.43 364,140 3,789 4.13 276,483 1,837 2.69 Trading account liabilities 52,466 517 3.99 56,880 619 4.32 44,507 427 3.89 (2) Long-term debt 117,018 1,494 5.11 99,601 1,252 5.03 96,167 1,102 4.58 Total interest-bearing liabilities - excluding hedge impact 1,051,607 9,213 3.54 970,338 7,905 3.24 876,515 5,126 2.37 Net derivative (income) expense on liabilities 136 254 504 Total interest-bearing liabilities - including hedge impact 1,051,607 9,349 3.60 970,338 8,159 3.34 876,515 5,630 2.60 Noninterest-bearing sources: Noninterest-bearing deposits 177,594 179,205 168,062 Other liabilities 56,019 55,566 56,881 Shareholders' equity 131,153 99,948 99,401 Total liabilities and shareholders' equity $1,416,373 $1,305,057 $1,200,859 Net interest spread 2.53 2.40 2.61 Impact of noninterest-bearing sources 0.49 0.50 0.38 Net interest income/yield on earning assets - excluding hedge impact $9,168 3.02 $8,327 2.90 $7,789 2.99 Net impact of derivative hedge income/(expense) (128) (0.04) (225) (0.08) (83) (0.03) Net interest income/yield on earning assets $9,040 2.98 % $8,102 2.82 % $7,706 2.96 % (1) This table presents a non-GAAP financial measure. The impact of interest rate risk management derivatives is shown separately. Interest income and interest expense amounts, and the yields and and rates have been adjusted. Management believes this presentation is useful to investors because it adjusts for the impact of our hedging decisions and provides a better understanding of our hedging activities. The impact of interest rate management derivatives is not material to the average balances presented above. (2) Interest income excludes the impact of interest rate risk management contracts, which increased(decreased) interest income on time deposits placed and other short-term investments $(3) million, federal funds sold and securities purchased under agreements to resell $(91) million, commercial - domestic $111 million, commercial - foreign $1 million, and other earning assets $(10) million in the first quarter of 2006. Interest expense excludes the impact of interest rate risk management contracts which increased(decreased) interest expense on NOW and money market deposit accounts $2 million, consumer CDs and IRAs $155 million, negotiable CDs, public funds and other time deposits $2 million, banks located in foreign countries $21 million, federal funds purchased, securities sold under agreements to repurchase and other short-term borrowings $(66) million and long-term debt $22 million in the first quarter of 2006. Interest income excludes the impact of interest rate risk management contracts, which increased(decreased) interest income on time deposits placed and other short-term investments $(2) million, federal funds sold and securities purchased under agreements to resell $(61) million, securities $(1) million, residential mortgage $(1) million, commercial - domestic $112 million, commercial - foreign $1 million, and other earning assets $(19) million in the fourth quarter of 2005. Interest expense excludes the impact of interest rate risk management contracts which increased(decreased) interest expense on consumer CDs and IRAs $201 million, negotiable CDs, public funds and other time deposits $1 million, banks located in foreign countries $29 million, federal funds purchased, securities sold under agreements to repurchase and other short-term borrowings $66 million and long-term debt $(43) million in the three months ended December 31, 2005. Interest income excludes the impact of interest rate risk management contracts, which increased(decreased) interest income on time deposits placed and other short-term investments $(1) million, federal funds sold and securities purchased under agreements to resell $53 million, securities $(3) million, residential mortgage $5 million, commercial - domestic $416 million, commercial - foreign $2 million, and other earning assets $(51) million in the first quarter of 2005. Interest expense excludes the impact of interest rate risk management contracts which increased(decreased) interest expense on NOW and money market deposit accounts $16 million, consumer CDs and IRAs $316 million, negotiable CDs, public funds and other time deposits $29 million, banks located in foreign countries $61 million, federal funds purchased, securities sold under agreements to repurchase and other short-term borrowings $151 million and long-term debt $(69) million in the first quarter of 2005. (3) Nonperforming loans are included in the respective average loan balances. Income on these nonperforming loans is recognized on a cash basis. (4) Includes consumer finance of $3,012 million in the first quarter of 2006, and $2,916 million and $3,362 million in the fourth and first quarters of 2005; foreign consumer of $7,328 million in the first quarter of 2006, and $3,682 million and $3,532 million in the fourth and first quarters of 2005; and consumer lease financing of $17 million in the first quarter of 2006, and $55 million and $411 million in the fourth and first quarters of 2005. (5) Primarily consists of time deposits in denominations of $100,000 or more. Information for periods beginning January 1, 2006 includes the MBNA acquisition; prior periods have not been restated. 8
  • 10. Bank of America Corporation Business Segment View Net Income First Quarter 2006 Global Wealth and Investment Management 12% Global Corporate and Investment Banking 32% Global Consumer and Small Business Banking 54% All Other 2% Revenue* First Quarter 2006 Global Corporate and Investment Banking 31% Global Wealth and Investment Management 11% All Other Global Consumer and Small Business 1% Banking 57% *Fully taxable-equivalent basis Information for periods beginning January 1, 2006 includes the MBNA acquisition; prior periods have not been restated. 9
  • 11. Bank of America Corporation (1) Global Consumer and Small Business Banking Segment Results (Dollars in millions; except as noted) First Fourth Third Second First Quarter Quarter Quarter Quarter Quarter 2006 2005 2005 2005 2005 Net interest income(2) $5,400 $4,325 $4,224 $4,089 $4,215 Noninterest income Service charges 1,190 1,262 1,386 1,244 1,104 Mortgage banking income 205 271 230 237 274 Card income 3,268 1,325 1,344 1,272 1,144 All other income 138 97 70 57 116 Total noninterest income 4,801 2,955 3,030 2,810 2,638 Total revenue(2) 10,201 7,280 7,254 6,899 6,853 Provision for credit losses 1,257 1,299 1,107 1,155 710 Gains (losses) on sales of debt securities (1) (1) (1) - (1) Noninterest expense 4,693 3,325 3,271 3,346 3,238 Income before income taxes 4,250 2,655 2,875 2,398 2,904 Income tax expense 1,575 945 1,051 866 1,026 Net income $2,675 $1,710 $1,824 $1,532 $1,878 Shareholder value added $1,310 $970 $1,159 $874 $1,240 Net interest yield(2) 7.60 % 5.76 % 5.59 % 5.53 % 5.68 % Return on average equity 16.89 21.56 24.99 21.14 26.46 Efficiency ratio(2) 46.01 45.68 45.10 48.49 47.25 Balance Sheet Average Total loans and leases $187,048 $149,239 $145,714 $141,352 $139,644 Total earning assets 288,311 297,747 299,673 296,573 301,193 Total assets 349,802 325,538 326,940 323,087 329,620 Total deposits 330,204 306,579 310,485 306,471 300,562 Common equity/Allocated equity 64,228 31,463 28,964 29,077 28,789 Period End Total loans and leases $184,236 $151,646 $147,702 $143,074 $138,873 Total assets 359,131 331,244 327,004 324,786 331,769 Total deposits 340,437 306,064 313,022 307,340 306,089 Period End (in billions) Mortgage servicing portfolio $302.4 $296.8 $288.5 $280.1 $275.5 (1) Global Consumer and Small Business Banking's most significant product groups are Deposits, Mortgage, Card Services, Home Equity Line of Credit (HELOC), and Other. (2) Fully taxable-equivalent basis Certain prior period amounts have been reclassified among the segments to conform to the current period presentation. Information for periods beginning January 1, 2006 includes the MBNA acquisition; prior periods have not been restated. 10
  • 12. Bank of America Corporation Global Consumer and Small Business Banking Sub-Segment Results (Dollars in millions) First Quarter 2006 Card Total Deposits (1) Mortgage Services (2) HELOC ALM Other Net interest income(3) $5,400 $ 2,351 $ 146 $ 2,210 $ 334 $ 315 $ 44 Noninterest income Service charges 1,190 1,190 - - - - - Mortgage banking income 205 - 188 - 17 - - Card income 3,268 444 - 2,824 - - - All other income 138 - 13 244 - - (119) Total noninterest income 4,801 1,634 201 3,068 17 - (119) (3) Total revenue 10,201 3,985 347 5,278 351 315 (75) Provision for credit losses 1,257 28 4 1,166 12 - 47 Gains (losses) on sales of debt securities (1) - - - - - (1) Noninterest expense 4,693 2,206 229 2,016 154 - 88 Income before income taxes 4,250 1,751 114 2,096 185 315 (211) Income tax expense 1,575 649 42 777 69 117 (79) Net income $2,675 $ 1,102 $ 72 $ 1,319 $ 116 $ 198 $ (132) Shareholder value added $1,310 $784 $21 $578 $85 $ 198 $ (356) Net interest yield(3) 7.60 % 2.76 % 1.72 % 9.15 % 2.56 % - % n/m Return on average equity 16.89 29.93 15.25 14.07 40.08 - n/m Efficiency ratio(3) 46.01 55.37 65.86 38.19 43.79 - n/m (1) Deposit balances reflect Premier migration average impact of $45.4 billion for the three months ended March 31, 2006. (2) Card Services presented on a held view (3) Fully taxable-equivalent basis n/m = not meaningful Information for periods beginning January 1, 2006 includes the MBNA acquisition; prior periods have not been restated. 11
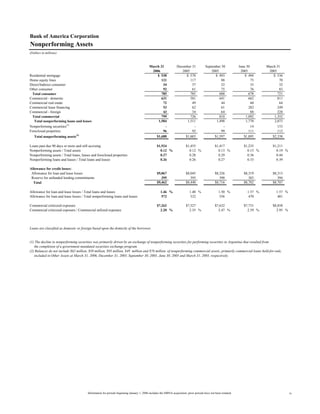
  • 13. Bank of America Corporation Global Consumer and Small Business Banking Sub-Segment Results (Dollars in millions) First Quarter 2005 Card Total Deposits (1) Mortgage Services (2) HELOC ALM Other Net interest income(3) $4,215 $1,970 $ 192 $ 1,148 $ 304 $ 547 $ 54 Noninterest income Service charges 1,104 1,104 - - - - - Mortgage banking income 274 - 256 - 19 - (1) Card income 1,144 352 - 792 - - - All other income 116 - 4 55 - - 57 Total noninterest income 2,638 1,456 260 847 19 - 56 Total revenue(3) 6,853 3,426 452 1,995 323 547 110 Provision for credit losses 710 (7) 6 698 8 - 5 Gains (losses) on sales of debt securities (1) - - - - - (1) Noninterest expense 3,238 1,931 276 758 182 - 91 Income before income taxes 2,904 1,502 170 539 133 547 13 Income tax expense 1,026 530 60 190 47 194 5 Net income $1,878 $ 972 $ 110 $ 349 $ 86 $ 353 $ 8 Shareholder value added $1,240 $648 $66 $260 $57 $353 $(144) Net interest yield(3) 5.68 % 2.53 % 2.11 % 8.75 % 2.76 % - % n/m Return on average equity 26.46 26.13 26.87 26.62 33.06 - n/m Efficiency ratio(3) 47.25 56.37 61.17 37.97 56.35 - n/m (1) Deposit balances reflect Premier migration average impact of $32.4 billion for the three months ended March 31, 2006. (2) Card Services presented on a held view (3) Fully taxable-equivalent basis n/m = not meaningful Information for periods beginning January 1, 2006 includes the MBNA acquisition; prior periods have not been restated. 12
  • 14. Bank of America Corporation Global Consumer and Small Business Banking - Key Indicators (Dollars in millions; except as noted) First Fourth Third Second First Quarter Quarter Quarter Quarter Quarter 2006 2005 2005 2005 2005 Deposits Key Indicators Average Deposit Balances Checking $ 126,333 $ 125,491 $ 124,398 $ 123,022 $ 119,750 Savings 32,104 31,897 32,016 32,465 31,496 MMS 76,920 71,936 68,841 67,659 69,742 CD's & IRA's 84,836 69,375 76,779 75,720 73,147 Foreign and Other 10,011 7,880 8,451 7,605 6,427 Total $ 330,204 $ 306,579 $ 310,485 $ 306,471 $ 300,562 Average Cumulative Balances migrated to Premier Banking and Investments $ 45,367 $ 44,692 $ 41,672 $ 38,257 $ 32,407 Deposit Spreads (excludes noninterest costs) Checking 4.18 % 4.16 % 4.18 % 4.14 % 4.24 % Savings 3.36 3.53 3.78 4.02 4.38 MMS 2.53 2.69 2.02 1.64 1.43 CD's & IRA's 1.21 1.19 0.90 0.80 0.66 Foreign and Other 3.68 4.19 3.88 3.67 3.52 Total 2.93 3.06 2.82 2.72 2.70 Net New Checking (units in thousands) 603 426 635 629 611 Debit Purchase Volumes 38,618 39,623 36,008 35,049 31,230 Online Banking (End of Period) Active Accounts (units in thousands) 19,643 14,698 14,338 13,514 13,047 Active Billpay Accounts (units in thousands) 10,088 7,281 6,987 6,529 6,256 Credit Key Indicators Managed Card - North American Only Gross Interest Yield 12.65 % 12.25 % 11.99 % 11.58 % 11.27 % (1) Risk Adjusted Margin 10.26 4.25 8.36 7.72 7.63 Loss Rates 3.12 9.49 5.74 6.23 6.17 Average Outstandings (in millions) $ 143,463 $ 59,722 $ 59,762 $ 58,537 $ 58,145 New Account Growth (in thousands) 2,076 930 1,466 1,564 1,353 Purchase Volumes (in millions) 49,568 24,116 22,736 21,577 19,134 Delinquencies 30 Day 4.45 % 4.17 % 4.59 % 4.25 % 4.20 % 60 Day 2.99 2.93 3.21 2.88 2.98 12 month Lag Loss Rate 3.24 10.04 6.30 6.94 6.67 Mortgage Mortgage Originations (in millions) $ 17,262 $ 20,662 $ 27,511 $ 21,135 $ 17,471 Mortgage Servicing Rights Period End Balance (in millions) 2,925 2,658 2,623 2,233 2,547 Capitalized Mortgage Servicing Rights (% of loans serviced) 132 bps 122 bps 124 bps 108 bps 128 bps Mortgage Loans Serviced for Investors (in billions) $ 221 $ 218 $ 212 $ 207 $ 199 Home Equity Originations (in millions) 18,589 19,670 17,897 19,379 15,033 (1) Reflects margin and noninterest revenue, adjusted for loss rates. Information for periods beginning January 1, 2006 includes the MBNA acquisition; prior periods have not been restated. 13