Location via proxy:   [ UP ]  
[Report a bug]   [Manage cookies]                
SlideShare a Scribd company logo
We are doing it wrong. 
10th international TYPO3 conference 
! 
Robert Weißgraeber, aexea
/me 
Robert Weißgraeber 
Principal @ aexea
what we do: 
Diesel EXPOSURE LOW - Sneaker - black 
I love jeans! These black EXPOSURE LOW sneakers by Diesel are 
avowed fans of denim and therefore come in a trendy jeans look, as 
reflected by the traditional denim elements, for instance the coin 
pocket, the typical rivets and a deep pocket. A declaration of love for 
the popular denim look: Diesel EXPOSURE LOW sneakers in black. 
x10000 
x! 
"#$% 
&'
!@robert_we 
#foodkoma
#NoEstimates 
http://www.pleacher.com/mp/mgifs/gifs16/imp.jpg
“We are doing it wrong.” 
This talk may contain subversive ideas. You have been warned. 
Do try this at home.
“We are doing it wrong.” 
! 
Aspects of project management in modern software development.
№? 
Why do we need to change something?
Technology adaption rate is getting stellar. 
Graphic: Technology adaption rate in the US (Consumer Technologies,10-90%). 
Adoption Rates of Consumer Technologies: commercekitchen.com
Technology life cycles go down. 
Graphic: Duration of technologies as growth pulses (Consumer Technologies,10-90%). 
Adoption Rates of Consumer Technologies: commercekitchen.com
Can you deliver 
fast enough? 
past? present? future? 
Maersk Agile Journey.
Rethink the role of software in your business. 
• Separation of software & business? 
• Software solutions in a support role or as a solution in its own right? 
• Adoption of mega-trends? Secure? 
• Software as game changer?
”Today every company is a 
software company. That includes 
John Deere and Nordstrom.“ 
@barry_crist (CEO @ Chef)
There will be no 
4th Industrial 
Revolution. 
The evolution is already here. 
And its not coming with a version 
number attached anymore. 
Industry 4.0 Graphic: http://www.siemens.com/annual/13/en/company-report/report-industry-solutions/strategic-context/img/130E_StrategieUSA_E_Grafiken02_%5BWeb%5D.png 
Jenkins Logo Adaption: http://www.praqma.com/sites/default/files/cool-jenkins2x3.png
Not every system 
is mission critical. 
If you don’t care about your 
brand or (possible) employees.
http://mkhmarketing.files.wordpress.com/2013/01/orange-keep-calm-sign.png
№1 
Metaphors. 
Our analogies are wrong.
hdwallpapersinn.com
http://www.maurerunited.nl/wp-content/uploads/2009/07/090731_day_1024x768.jpg
Create the 
Impossible. 
You are not limited to physical 
boundaries. 
http://www.mcescher.com/gallery/impossible-constructions/waterfall/
other analogies & metaphors 
• building a bridge 
• comparing software to art 
• sports metaphors 
• gardening, landscaping
№2 
Extensive Process Governance
What we do: 
• We want predictive and reliable software releases 
• Long term plan/backlog of features 
• High Inventory on Ideas & Work in Progress 
• Extensive prioritization and contracts 
• Risk aversion by agent 
• Linear process with multiple sign offs
№3 
Optimizing on Resource Utilization. 
*: resource = human people
Resource Planning! 
• Backlog of work / orders 
• Long time commitment 
• Committed salaries/resources 
• Resource planning as system process 
*: resource = human people
Client/Business 
• fast implementation 
• costs 
• problem fitting software („the right 
one“) 
! 
! 
• „the way we work together has to 
integrate with how our company 
works“ 
Dev Shop/Agency 
• getting paid 
• averting risks 
• mid/long term commitment 
! 
• „we have more problems finding 
developers than fitting projects“ 
Dev Team 
• making a difference by delivering 
meaningful software 
• working with experts 
• „craftsmanship“, clean code… 
• salary, job security, … 
! 
• live is too short for bad jobs 
Conflict of Interest?
Stefan Roock
Little's law 
Throughput 
*: resource = human people 
Work in Progress 
Lead Time 
=
Little's law 
*: resource = human people 
Work in Progress 
= 
Throughput 
Lead Time
Cycle Time as a 
Function of 
Utilization (and 
Batch Size) 
leanessays.com 
30x 
Cycle Time 
0 
1 
II 
III 
Resource Utilization: 40% 60% 80% 100%
Reduced Lead time 
• delivering fast is valuable 
• increases throughput 
• faster payout 
• enables a faster delivery of value (testable on fit) 
• reduced risk 
• shorter feedback cycles (e.g. cash flow) can replace planning 
processes 
Needed Changes 
• minimize Work in Progress (wip limit, process steps) 
• Focusing on flow instead of utilization 
• smaller batch size 
Where is the $$?
№4 
Heijunka 
Choosing a non-adaptive technique for non-standardized activities.
Value Chain und Work in Progress. 
*: resource = human people 
Work in Progress 
= 
Throughput 
Lead Time
Architecture / Design 
Needs Live 
Software Development Value Stream 
softwarecreation.org 
Feature 
Analysis / Requirements 
Programming 
Testing / Acceptance 
Deployment / Delivery 
Customer not available 
Business Approval 
Excessive up-front 
architecture 
Design approval 
Meetings 
Over-engineering 
Developers involvement 
in other Projects 
Fixing Bugs 
Redoing because of 
incorrect requirement 
and stress 
Deferred Integration Debt
Software Development Flow 
cut back on 
• sitting idle 
• waiting for somebody to work on it 
fast exchange of information 
• move design, code and information fast 
• link processes and people together to make problems surface 
right away 
• remove linear sequences
“One-Piece Continous Flow.” Citrix Online applied this pattern at the enterprise level and reduced release cycles from 42 months to less than 10 
months resulting in substantial gains in market share for their products. 
scrumplop.org
“All the brilliant minds working on 
! 
the same thing… 
at the same time… 
in the same space 
on the same computer… 
! 
just like a real mob.” 
! 
– Woody Zuill 
It exists. it’s called „Mob Programming“.
№5 
Projects. 
Moving #BeyondProjects. 
Start thinking small: Diseconomies of Scale.
a Project 
• a temporary organization 
• to achieve predefined result 
• at a pre-specified time 
• using predetermined results. 
Success Criteria 
• On Schedule 
• On Budget 
• On Quality (~ Features) 
Assumptions 
• The Value is knowable (at the start) 
• There is no value in flexibility. 
Intrinsic Properties
“Delivering on schedule, budget & features 
is a sign of failure, not success.” 
Allan Kelly, #NoProjects 
@allankellynet
We make 
decisions, when 
we know the 
least. 
Decision 
Impact 
Time in Project 
Knowledge Learned 
Stuff
Projects are, where software 
goes to die. 
Successful Software does not end. 
http://www.dorkly.com/post/1243/pacman-graves
Software is state, not result. 
• Treat everything as Service Creation & Service Delivery 
• Don’t limit your options by long-term determination
Bring work to stable teams 
• Create stable performing teams 
• Close to the business 
• Bring the work to the team 
• Manage different teams as queues with capacity, not via queue switching.
16% 
16% 
3% 3% 4% 5% 
1 2 3 4 5 6 7 8 9 10 11 12 13 14 
3% 3% 4% 5% 
Requirement 
12% 
6% 5% 
7% 
12% 
1% 1% 
21% 
3% 
1 2 3 4 5 6 7 8 9 10 11 12 13 14 
Figure 2. The value distribution of the 14 requirements in the RAN project. 
Requirement 
Value (percent) 
Value (percent) 
20 
15 
10 
5 
0 
20 
15 
10 
5 
0 
12% 
6% 5% 
7% 
12% 
1% 1% 
21% 
3% 
Figure 2. The value distribution of the 14 requirements in the RAN project. 
Requirement 
6 
The Value Distribution of Requirements in a Project is not linear. 
discussion, 
re-quirements 
actu-ally 
use 
for 
Systems 
Computer 
Linköping 
joint 
and 
phases 
As 
January 
in-dustry- 
per-forming 
in-dustrial 
study, 
Access 
was to 
for a 
infor-mation 
system 
small, 
our 
now an 
research 
using the cost–value approach. 
We asked a group of experienced pro-ject 
members to represent customers’ 
views and carefully instructed them on 
Requirement 
implementation cost. 
We let the participants work with the 
requirement pairs in any order they chose, 
allowing for retraction during the com-parison 
Cost (percent) 
20 
15 
10 
5 
0 
1% 2% 3% 4% 
6% 
11% 
4% 
6% 7% 
12% 
4% 
6% 
23% 
10% 
1 2 3 4 5 6 7 8 9 10 11 12 13 14 
Figure 3. Estimated cost of requirements implementation in the RAN project. 
Requirements 6, 10, 13, and 14 constitute 56 percent of the total implementation costs. 
discussion, 
re-quirements 
actu-ally 
use 
for 
Systems 
Computer 
Linköping 
joint 
and 
phases 
As 
January 
in-dustry- 
per-forming 
in-dustrial 
study, 
Access 
was to 
for a 
infor-mation 
system 
small, 
our 
now an 
research 
level 
the 
high-level 
using the cost–value approach. 
We asked a group of experienced pro-ject 
members to represent customers’ 
views and carefully instructed them on 
prioritizing requirements, making pair-wise 
comparisons, choosing the scale to 
be used, and deciding how many com-parisons 
would be needed. We also ex-plained 
implementation cost. 
We let the participants work with the 
requirement pairs in any order they chose, 
allowing for retraction during the com-parison 
process. The session was not 
moderated and participants worked at 
their own pace. Discussions were allowed, 
though in fact there were very few. 
Cost (percent) 
20 
15 
10 
5 
0 
1% 2% 3% 4% 
6% 
11% 
4% 
6% 7% 
12% 
4% 
6% 
23% 
10% 
1 2 3 4 5 6 7 8 9 10 11 12 13 14 
Figure 3. Estimated cost of requirements implementation in the RAN project. 
Requirements 6, 10, 13, and 14 constitute 56 percent of the total implementation costs. 
a ratio scale. This means that a require-ment 
whose determined value is 0.10 is 
twice as valuable as a requirement with a 
determined value of 0.05. Moreover, the 
sum of all requirements value measures is 
1, 2, 3, and 11—account 
for only 10 percent. Looking again at the 
extreme values, requirement number 13 
is about 20 times as expensive to imple-ment 
as requirement number 1. 
12, reduced by that cost CASE THE and a second that Performance mobile project of 15 of 5 15 
Value (percent) 
25 
20 
15 
10 
5 
0 
0 10 20 25 
Cost (percent) 
1 5 
2 
4 
3 
7 
9 
11 12 
14 
10 
13 
8 
Figure 4. Cost–value diagram for the RAN project requirements. By not implement-ing 
the requirements that contribute little to stakeholder satisfaction, such as 10, 11, and 
12, you can significantly reduce the cost and duration of development. 
Karlsson/Ryan: „a cost-value approach for prioritizing requirements“, IEEE 1997
Reduce Batch Size 
• „Elephant carpaccio“, „hamburger method“ 
• identify non-linear value distributions 
• early, provable value delivery 
• enables options by selection 
• create portfolio of options 
! 
• Deliver features, not projects.
№6 
„Investment Decisions“
Estimating software is fed from our believe 
in the omnipotence of project managers. 
#NoEstimates
Software development is a 
learning process. 
!Working code is a side effect. 
Learning is non linear. 
- Alberto Brandolini 
http://www.astro.princeton.edu/~jstone/images/sp.gif
Cost of Delay 
End dates are bad. 
Deadlines are good.
"We are doing it wrong."
“Technical debt is not like debt with the 
bank. It's debt with the mob.” 
- Alberto Brandolini (@ziobrando)
№7 
Doing things, that are 
technically possible.
What is „Done“? 
Software that's out in production doing its job. 
Anything else is just self-delusion.
"We are doing it wrong."
blog.endpoint.com stackoverflow.com blog.spearce.org
Continous Delivery should be a mutual interest of everyone. 
http://electric-cloud.com/blog/2014/10/the-big-bang-and-why-we-are-here/
Released software starts delivering value. 
Value 
Time / Releases Time / Releases 
Value
The software is ready for 
release. Every single 
moment.
Continous 
Delivery requires 
automation. 
wikipedia.com
ポカヨケ 
(Poka Yoke)
“If Google has no branches, why do you 
think you might need them?” 
Amazon releases to production every 11.6 seconds. 
(Number from May 2011)
Summary
Work with aligned interests. 
Trust in working together. Make everything transparent.
Do valuable software. 
Meaningful software is far beyond some %s. Change the game.
Deliver early and continuously. 
Deliver value and make it provable.
Focus on flow and service state. 
Flow, throughput, velocity, flexibility.
Thank you. 
Robert Weißgraeber, @robert_we

More Related Content

"We are doing it wrong."

  • 1. We are doing it wrong. 10th international TYPO3 conference ! Robert Weißgraeber, aexea
  • 2. /me Robert Weißgraeber Principal @ aexea
  • 3. what we do: Diesel EXPOSURE LOW - Sneaker - black I love jeans! These black EXPOSURE LOW sneakers by Diesel are avowed fans of denim and therefore come in a trendy jeans look, as reflected by the traditional denim elements, for instance the coin pocket, the typical rivets and a deep pocket. A declaration of love for the popular denim look: Diesel EXPOSURE LOW sneakers in black. x10000 x! "#$% &'
  • 6. “We are doing it wrong.” This talk may contain subversive ideas. You have been warned. Do try this at home.
  • 7. “We are doing it wrong.” ! Aspects of project management in modern software development.
  • 8. №? Why do we need to change something?
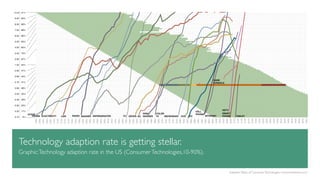
  • 9. Technology adaption rate is getting stellar. Graphic: Technology adaption rate in the US (Consumer Technologies,10-90%). Adoption Rates of Consumer Technologies: commercekitchen.com
  • 10. Technology life cycles go down. Graphic: Duration of technologies as growth pulses (Consumer Technologies,10-90%). Adoption Rates of Consumer Technologies: commercekitchen.com
  • 11. Can you deliver fast enough? past? present? future? Maersk Agile Journey.
  • 12. Rethink the role of software in your business. • Separation of software & business? • Software solutions in a support role or as a solution in its own right? • Adoption of mega-trends? Secure? • Software as game changer?
  • 13. ”Today every company is a software company. That includes John Deere and Nordstrom.“ @barry_crist (CEO @ Chef)
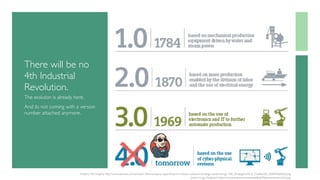
  • 14. There will be no 4th Industrial Revolution. The evolution is already here. And its not coming with a version number attached anymore. Industry 4.0 Graphic: http://www.siemens.com/annual/13/en/company-report/report-industry-solutions/strategic-context/img/130E_StrategieUSA_E_Grafiken02_%5BWeb%5D.png Jenkins Logo Adaption: http://www.praqma.com/sites/default/files/cool-jenkins2x3.png
  • 15. Not every system is mission critical. If you don’t care about your brand or (possible) employees.
  • 17. №1 Metaphors. Our analogies are wrong.
  • 20. Create the Impossible. You are not limited to physical boundaries. http://www.mcescher.com/gallery/impossible-constructions/waterfall/
  • 21. other analogies & metaphors • building a bridge • comparing software to art • sports metaphors • gardening, landscaping
  • 23. What we do: • We want predictive and reliable software releases • Long term plan/backlog of features • High Inventory on Ideas & Work in Progress • Extensive prioritization and contracts • Risk aversion by agent • Linear process with multiple sign offs
  • 24. №3 Optimizing on Resource Utilization. *: resource = human people
  • 25. Resource Planning! • Backlog of work / orders • Long time commitment • Committed salaries/resources • Resource planning as system process *: resource = human people
  • 26. Client/Business • fast implementation • costs • problem fitting software („the right one“) ! ! • „the way we work together has to integrate with how our company works“ Dev Shop/Agency • getting paid • averting risks • mid/long term commitment ! • „we have more problems finding developers than fitting projects“ Dev Team • making a difference by delivering meaningful software • working with experts • „craftsmanship“, clean code… • salary, job security, … ! • live is too short for bad jobs Conflict of Interest?
  • 28. Little's law Throughput *: resource = human people Work in Progress Lead Time =
  • 29. Little's law *: resource = human people Work in Progress = Throughput Lead Time
  • 30. Cycle Time as a Function of Utilization (and Batch Size) leanessays.com 30x Cycle Time 0 1 II III Resource Utilization: 40% 60% 80% 100%
  • 31. Reduced Lead time • delivering fast is valuable • increases throughput • faster payout • enables a faster delivery of value (testable on fit) • reduced risk • shorter feedback cycles (e.g. cash flow) can replace planning processes Needed Changes • minimize Work in Progress (wip limit, process steps) • Focusing on flow instead of utilization • smaller batch size Where is the $$?
  • 32. №4 Heijunka Choosing a non-adaptive technique for non-standardized activities.
  • 33. Value Chain und Work in Progress. *: resource = human people Work in Progress = Throughput Lead Time
  • 34. Architecture / Design Needs Live Software Development Value Stream softwarecreation.org Feature Analysis / Requirements Programming Testing / Acceptance Deployment / Delivery Customer not available Business Approval Excessive up-front architecture Design approval Meetings Over-engineering Developers involvement in other Projects Fixing Bugs Redoing because of incorrect requirement and stress Deferred Integration Debt
  • 35. Software Development Flow cut back on • sitting idle • waiting for somebody to work on it fast exchange of information • move design, code and information fast • link processes and people together to make problems surface right away • remove linear sequences
  • 36. “One-Piece Continous Flow.” Citrix Online applied this pattern at the enterprise level and reduced release cycles from 42 months to less than 10 months resulting in substantial gains in market share for their products. scrumplop.org
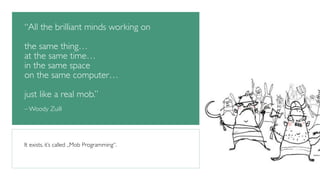
  • 37. “All the brilliant minds working on ! the same thing… at the same time… in the same space on the same computer… ! just like a real mob.” ! – Woody Zuill It exists. it’s called „Mob Programming“.
  • 38. №5 Projects. Moving #BeyondProjects. Start thinking small: Diseconomies of Scale.
  • 39. a Project • a temporary organization • to achieve predefined result • at a pre-specified time • using predetermined results. Success Criteria • On Schedule • On Budget • On Quality (~ Features) Assumptions • The Value is knowable (at the start) • There is no value in flexibility. Intrinsic Properties
  • 40. “Delivering on schedule, budget & features is a sign of failure, not success.” Allan Kelly, #NoProjects @allankellynet
  • 41. We make decisions, when we know the least. Decision Impact Time in Project Knowledge Learned Stuff
  • 42. Projects are, where software goes to die. Successful Software does not end. http://www.dorkly.com/post/1243/pacman-graves
  • 43. Software is state, not result. • Treat everything as Service Creation & Service Delivery • Don’t limit your options by long-term determination
  • 44. Bring work to stable teams • Create stable performing teams • Close to the business • Bring the work to the team • Manage different teams as queues with capacity, not via queue switching.
  • 45. 16% 16% 3% 3% 4% 5% 1 2 3 4 5 6 7 8 9 10 11 12 13 14 3% 3% 4% 5% Requirement 12% 6% 5% 7% 12% 1% 1% 21% 3% 1 2 3 4 5 6 7 8 9 10 11 12 13 14 Figure 2. The value distribution of the 14 requirements in the RAN project. Requirement Value (percent) Value (percent) 20 15 10 5 0 20 15 10 5 0 12% 6% 5% 7% 12% 1% 1% 21% 3% Figure 2. The value distribution of the 14 requirements in the RAN project. Requirement 6 The Value Distribution of Requirements in a Project is not linear. discussion, re-quirements actu-ally use for Systems Computer Linköping joint and phases As January in-dustry- per-forming in-dustrial study, Access was to for a infor-mation system small, our now an research using the cost–value approach. We asked a group of experienced pro-ject members to represent customers’ views and carefully instructed them on Requirement implementation cost. We let the participants work with the requirement pairs in any order they chose, allowing for retraction during the com-parison Cost (percent) 20 15 10 5 0 1% 2% 3% 4% 6% 11% 4% 6% 7% 12% 4% 6% 23% 10% 1 2 3 4 5 6 7 8 9 10 11 12 13 14 Figure 3. Estimated cost of requirements implementation in the RAN project. Requirements 6, 10, 13, and 14 constitute 56 percent of the total implementation costs. discussion, re-quirements actu-ally use for Systems Computer Linköping joint and phases As January in-dustry- per-forming in-dustrial study, Access was to for a infor-mation system small, our now an research level the high-level using the cost–value approach. We asked a group of experienced pro-ject members to represent customers’ views and carefully instructed them on prioritizing requirements, making pair-wise comparisons, choosing the scale to be used, and deciding how many com-parisons would be needed. We also ex-plained implementation cost. We let the participants work with the requirement pairs in any order they chose, allowing for retraction during the com-parison process. The session was not moderated and participants worked at their own pace. Discussions were allowed, though in fact there were very few. Cost (percent) 20 15 10 5 0 1% 2% 3% 4% 6% 11% 4% 6% 7% 12% 4% 6% 23% 10% 1 2 3 4 5 6 7 8 9 10 11 12 13 14 Figure 3. Estimated cost of requirements implementation in the RAN project. Requirements 6, 10, 13, and 14 constitute 56 percent of the total implementation costs. a ratio scale. This means that a require-ment whose determined value is 0.10 is twice as valuable as a requirement with a determined value of 0.05. Moreover, the sum of all requirements value measures is 1, 2, 3, and 11—account for only 10 percent. Looking again at the extreme values, requirement number 13 is about 20 times as expensive to imple-ment as requirement number 1. 12, reduced by that cost CASE THE and a second that Performance mobile project of 15 of 5 15 Value (percent) 25 20 15 10 5 0 0 10 20 25 Cost (percent) 1 5 2 4 3 7 9 11 12 14 10 13 8 Figure 4. Cost–value diagram for the RAN project requirements. By not implement-ing the requirements that contribute little to stakeholder satisfaction, such as 10, 11, and 12, you can significantly reduce the cost and duration of development. Karlsson/Ryan: „a cost-value approach for prioritizing requirements“, IEEE 1997
  • 46. Reduce Batch Size • „Elephant carpaccio“, „hamburger method“ • identify non-linear value distributions • early, provable value delivery • enables options by selection • create portfolio of options ! • Deliver features, not projects.
  • 48. Estimating software is fed from our believe in the omnipotence of project managers. #NoEstimates
  • 49. Software development is a learning process. !Working code is a side effect. Learning is non linear. - Alberto Brandolini http://www.astro.princeton.edu/~jstone/images/sp.gif
  • 50. Cost of Delay End dates are bad. Deadlines are good.
  • 52. “Technical debt is not like debt with the bank. It's debt with the mob.” - Alberto Brandolini (@ziobrando)
  • 53. №7 Doing things, that are technically possible.
  • 54. What is „Done“? Software that's out in production doing its job. Anything else is just self-delusion.
  • 57. Continous Delivery should be a mutual interest of everyone. http://electric-cloud.com/blog/2014/10/the-big-bang-and-why-we-are-here/
  • 58. Released software starts delivering value. Value Time / Releases Time / Releases Value
  • 59. The software is ready for release. Every single moment.
  • 60. Continous Delivery requires automation. wikipedia.com
  • 62. “If Google has no branches, why do you think you might need them?” Amazon releases to production every 11.6 seconds. (Number from May 2011)
  • 64. Work with aligned interests. Trust in working together. Make everything transparent.
  • 65. Do valuable software. Meaningful software is far beyond some %s. Change the game.
  • 66. Deliver early and continuously. Deliver value and make it provable.
  • 67. Focus on flow and service state. Flow, throughput, velocity, flexibility.
  • 68. Thank you. Robert Weißgraeber, @robert_we