How a Data-Driven Culture Improves Organizational Performance

In the last few years, many researchers and analysts have predicted power shifts in business intelligence and analytics world. Today, self-service analytical tools are enabling information workers everywhere identify new insights and drive business performance. In this slideshare, learn from IDC research and Amaysim BI Manager about: Why meeting the analytical needs of business users matter to organizational performance What’s driving leaders in APAC enterprises towards a self-service paradigm? How to encourage adoption of analytical tools in your organization How leading Asia Pacific enterprises such as Amaysim are adopting self-service analytics and the benefits they’ve experienced. This slideshare came from a full webinar delivered by Tableau. You can the full length webinar at http://www.tableau.com/learn/webinars/how-analytic-culture-drives-performance-asia-pacific-organizations


How a Data-Driven Culture Improves Organizational Performance
- 1. An Analytic Culture Drives Performance in Asia Pacific Organizations Brian McDonough IDC June 2015
- 2. Analytics In Asia Pacific IDC examined two groups of analytic-using organizations in AP • Outperformers – A segment that derived more benefits from analytics than their peers • Peers – Organizations that still experienced benefits from analytics but not to the extent of the outperformers Benefits included: • Cost Reduction • Revenue Increases • Productivity Improvements • Innovation Improvements N=207, 50% IT, 50% LOB . Singapore, India, Japan Australia = 25% each © IDC Visit us at IDC.com and follow us on Twitter: @IDC 2
- 3. Analytically-oriented Cultures Better Address User’s Analytic Needs © IDC Visit us at IDC.com and follow us on Twitter: @IDC 3 5% 33% 9% 31% 0% 10% 20% 30% 40% 50% 60% Less Involved More Involved Less Reliant More Reliant 1 = Do not meet requirements at all 2 3 4 5 = Fully meet requirements Managers involvement in promoting the use of the BI solution Managers reliance on analytics for decision making More involvement and reliance on analytics results in twice the level of benefits derived from an analytics initiative than in other organizations.
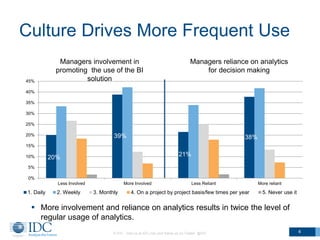
- 4. Culture Drives More Frequent Use © IDC Visit us at IDC.com and follow us on Twitter: @IDC 4 20% 39% 21% 38% 0% 5% 10% 15% 20% 25% 30% 35% 40% 45% Less Involved More Involved Less Reliant More reliant 1. Daily 2. Weekly 3. Monthly 4. On a project by project basis/few times per year 5. Never use it Managers involvement in promoting the use of the BI solution Managers reliance on analytics for decision making More involvement and reliance on analytics results in twice the level of regular usage of analytics.
- 5. © IDC Visit us at IDC.com and follow us on Twitter: @IDC 5 A strong analytics culture (when managers are more reliant on analytics for decision making) leads to availability of ad-hoc data analysis and visualization technology that meets user requirements 3.5 times more frequently than at less analytically oriented organizations. 3.5x
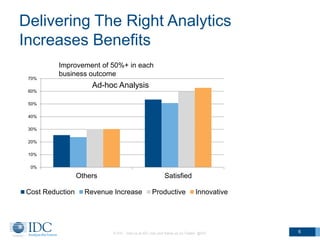
- 6. Delivering The Right Analytics Increases Benefits © IDC Visit us at IDC.com and follow us on Twitter: @IDC 6 0% 10% 20% 30% 40% 50% 60% 70% Others Satisfied Cost Reduction Revenue Increase Productive Innovative Improvement of 50%+ in each business outcome Ad-hoc Analysis
- 7. User Needs for Self-service Analytics are not Being Met © IDC Visit us at IDC.com and follow us on Twitter: @IDC 7 67% 68% 69% 74% 71% 32% 32% 31% 25% 24% 0% 10% 20% 30% 40% 50% 60% 70% 80% 90%100% Performance (speed of query response or data loading) Data visualization Reporting/Dashboards Ad-hoc, on-demand data access and manipulation or multi-dimensional analysis Access on mobile device(s) 1 -4 = Needs Not Fully Met 5 = Fully meet requirements Do not know 67-71% of users are not getting the analytics they need
- 8. New Analytics Requirements © IDC Visit us at IDC.com and follow us on Twitter: @IDC 8 AnalystsFont line staff ManagersWho? React faster Anticipate sooner Optimize managementWhy? Model & Predict Sense & Respond Plan & Analyze How? Exploration & Discovery Operational Intelligence Performance ManagementWhat? Fit the right analytics to the right use case to better meet requirements for end-user analytic technologies. Begin with descriptive analytics, move to predictive and optimized.
- 9. © IDC Visit us at IDC.com and follow us on Twitter: @IDC 9 Transactional data Descriptive data Performance data Attitudinal data Data warehouseEvent processing Data repository Behavioral data Exploration & Discovery Operational Intelligence Performance Management Industry and/or process analytic applications Information Access and Analysis Tools Interactional data React faster Anticipate sooner Optimize management Model & Predict Sense & Respond Plan & Analyze Business analysts and data scientists Font line staff and systems Executives and managers Provide access to data and tools needed for each use case
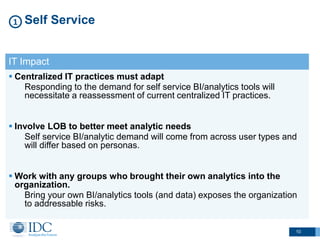
- 10. 10 Self Service1 IT Impact Centralized IT practices must adapt Responding to the demand for self service BI/analytics tools will necessitate a reassessment of current centralized IT practices. Involve LOB to better meet analytic needs Self service BI/analytic demand will come from across user types and will differ based on personas. Work with any groups who brought their own analytics into the organization. Bring your own BI/analytics tools (and data) exposes the organization to addressable risks.
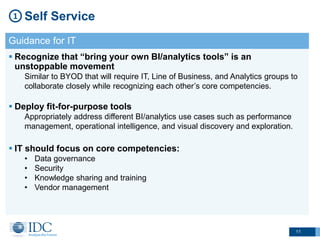
- 11. 11 Self Service1 Guidance for IT Recognize that “bring your own BI/analytics tools” is an unstoppable movement Similar to BYOD that will require IT, Line of Business, and Analytics groups to collaborate closely while recognizing each other’s core competencies. Deploy fit-for-purpose tools Appropriately address different BI/analytics use cases such as performance management, operational intelligence, and visual discovery and exploration. IT should focus on core competencies: • Data governance • Security • Knowledge sharing and training • Vendor management
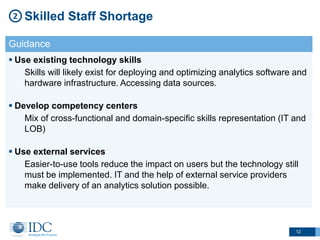
- 12. 12 Skilled Staff Shortage2 Guidance Use existing technology skills Skills will likely exist for deploying and optimizing analytics software and hardware infrastructure. Accessing data sources. Develop competency centers Mix of cross-functional and domain-specific skills representation (IT and LOB) Use external services Easier-to-use tools reduce the impact on users but the technology still must be implemented. IT and the help of external service providers make delivery of an analytics solution possible.
- 13. Questions, Comments Brian McDonough Research Manager, IDC Email: bmcdonough@idc.com Twitter: @briantheanalyst © IDC Visit us at IDC.com and follow us on Twitter: @IDC 13