Tableau vs. Power BI by Juan Manuel Perafan - GoDataFest 2022
- 1. TABLEAU VS POWER BI The Ultimate BI Tool For Mature Data Teams
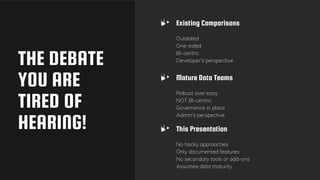
- 2. THE DEBATE YOU ARE TIRED OF HEARING! Existing Comparisons Outdated One-sided BI-centric Developer's perspective Mature Data Teams Robust over easy NOT BI-centric Governance in place Admin's perspective This Presentation No hacky approaches Only documented features No secondary tools or add-ons Assumes data maturity
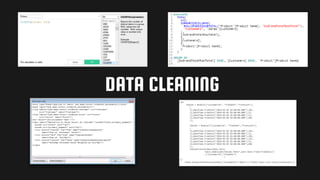
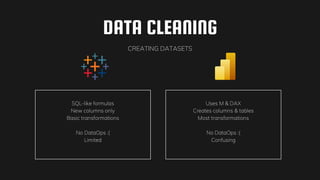
- 4. DATA CLEANING CREATING DATASETS SQL-like formulas New columns only Basic transformations No DataOps :( Limited Uses M & DAX Creates columns & tables Most transformations No DataOps :( Confusing
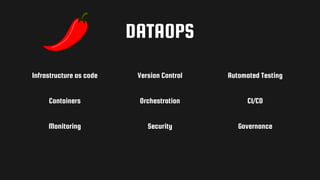
- 5. DATAOPS Infrastructure as code Version Control Automated Testing Containers Orchestration CI/CD Monitoring Security Governance
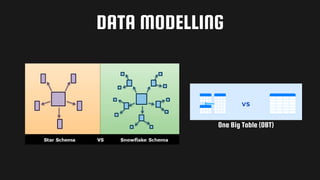
- 7. DATA MODELLING One Big Table (OBT)
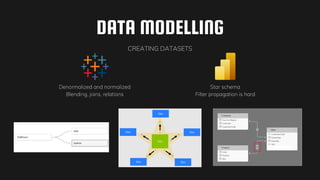
- 8. DATA MODELLING CREATING DATASETS Denormalized and normalized Blending, joins, relations Star schema Filter propagation is hard
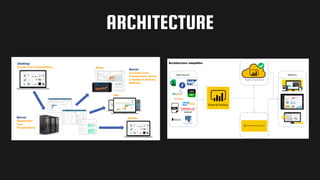
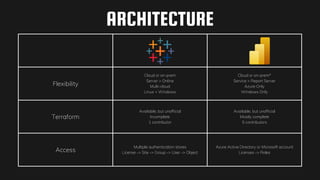
- 9. ARCHITECTURE
- 11. Flexibility Cloud or on-prem Server > Online Multi-cloud Linux + Windows Cloud or on-prem* Service > Report Server Azure Only Windows Only Terraform Available, but unofficial Incomplete 1 contributor Available, but unofficial Mostly complete 5 contributors Access Multiple authentication stores License -> Site -> Group -> User -> Object Azure Active Directory or Microsoft account Licenses -> Roles ARCHITECTURE
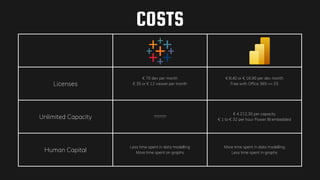
- 13. Licenses € 70 dev per month € 35 or € 12 viewer per month € 8.40 or € 16.90 per dev month Free with Office 365 <= E5 Unlimited Capacity ??????? € 4.212,30 per capacity € 1 to € 32 per hour Power BI embedded Human Capital Less time spent in data modelling More time spent on graphs More time spent in data modelling Less time spent in graphs COSTS

