


Taking Splunk to the Next Level - Management Breakout Session
- 1. Taking Splunk to the Next Level for Management David Caradonna Director, Global Business Value Consulting Splunk> July, 2015
- 2. Legal Notice During the course of this presentation, we may make forward looking statements regarding future events or the expected performance of the company. We caution you that such statements reflect our current expectations and estimates based on factors currently known to us and that actual events or results could differ materially. For important factors that may cause actual results to differ from those contained in our forward-looking statements, please review our filings with the SEC. The forward-looking statements made in this presentation are being made as of the time and date of its live presentation. If reviewed after its live presentation, this presentation may not contain current or accurate information. We do not assume any obligation to update any forward looking statements we may make. In addition, any information about our roadmap outlines our general product direction and is subject to changeatany timewithoutnotice.Itisforinformationalpurposesonlyand shall not beincorporated intoany contract or other commitment. Splunk undertakes no obligation either to develop the features or functionality described or to include anysuch feature orfunctionality in afuture release. Splunk®, Splunk>®, Listen to Your Data®, The Engine for Machine Data®, Hunk™, Splunk Cloud™, Splunk Storm® and SPL™ are registered trademarks or trademarks of Splunk Inc. in the United States and/or other countries. All other brand names, product names or trademarks belong to their respective owners. © 2014 Splunk Inc. All rights reserved.
- 3. Help Splunk customers, prospects, and partners document the projected and already realized business value of making machine data accessible, usable, and valuable for everyone Common Deliverables: › CFO-Ready Business Cases › Value Realization Studies › Adoption Roadmaps and Maturity Assessments › Customer and Use Case Benchmarks Business Value Consulting @Splunk 3
- 4. Splunk is a Hidden Gem 4 Way cool, dude. What business value do I get? I can search Syslog way faster now!
- 5. IT Operations Application Delivery Security & Compliance IT Value Centers An overview of Splunk efficiencies, as reported by Splunk Customers
- 6. 6 Failure detection Incident Triage Incident Troubleshooting Service Restoration Root Cause Analysis Up to 30% unknown root causes, causing incidents to recur Lengthy log analysis done manual All hands on deck, taking up 30 to 40 minutes Customer informs IT Before Splunk Fix is implemented MTTR reduced from 3-4 hours to < 1 hour Faster and more comprehensive root cause analysis helping to reduce incident recurrence Faster troubleshooting through Splunk log search and correlation capabilities Faster triage often conducted by 1st level staff without all hands on deck Better detection customer is notified by IT With Splunk Fix is implemented Splunk efficiencies with IT Operations
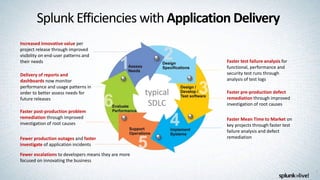
- 7. 7 Splunk Efficiencies with Application Delivery typical SDLC Delivery of reports and dashboards now monitor performance and usage patterns in order to better assess needs for future releases Faster Mean Time to Market on key projects through faster test failure analysis and defect remediation Increased innovative value per project release through improved visibility on end-user patterns and their needs Faster pre-production defect remediation through improved investigation of root causes Faster post-production problem remediation through improved investigation of root causes Faster test failure analysis for functional, performance and security test runs through analysis of test logs Fewer production outages and faster investigate of application incidents Fewer escalations to developers means they are more focused on innovating the business
- 8. 8 Splunk Efficiencies with Security & Compliance 1. Constant Triage of security events 2. Critical Decision on whether an event is worthy of deeper investigation 3. Deep Dive investigation of defined incidents Source: 2014 Cyber Security Intelligence Index
- 9. Assess Risk Deep Analysis Monitor Controls Audit & Comply 9 Splunk Efficiencies with Security & Compliance Continuous compliance on ALL components and policies resulting in faster and simpler audits Faster implementation of critical security controls (ex: SANS 20) across ALL layers of the organization, ultimately resulting in full enterprise visibility and a reduction in risks Faster deep dive investigation on security incidents that require further proactive and reactive analysis Faster 1st level triage on ALL security events/attacks with less resources as opposed to reviewing only a subset of events
- 10. Splunk Security & Compliance Best Practices 10 RefertotheSplunkSANS20 whitepaperfordetailedusecasesand examplesofhowcustomersuse Splunkforsecuritytoachievethe anticipatedimprovementwith: FasterDetectionofSecurityEvents FasterResearchandInvestigation ReducedRiskswithDataBreachandFraud
- 11. 11 Benchmarking Splunk Customer Success IT & App Operations 15-45% reduction in high priority incidents 70-90% reduction in incident investigation time 67-82% reduction in business impact 5-20% increase in infrastructure capacity utilization 80-90% faster development of reports and dashboards 70-90% reduction in QA test failure analysis and pre-prod defect investigation 10-50% improvement in time to market 10-50% increase in value for key projects 70-90% faster detection and triage of security events 70-90% reduction in incident response time 10-50% reduction in risk of data breach, IP theft, fraud 70-90% reduction in compliance reporting time App Development Security & Compliance Documented through 400+ engagements worldwide
- 12. 12 Benchmarking Splunk Customer Success Documented through 400+ engagements worldwide Reduced Sev1 and Sev2 incidents by 43% Improved capacity utilization and avoided $200k in infrastructure Reduced troubleshooting time by 70% and user impact by 40% IT & App Operations Went from 1 release/day to 8 with Splunk and added no new staff Reduced developer time troubleshooting by 95% and shortened their development cycles by 30% App Development Reduced the number of security incidents by 80% with faster detection Reduced investigation effort by more than 75% Reduced the time to report on SAS70 compliance by 83% Security & Compliance
- 13. Best Practices for Documenting and Positioning Value 41 3 Quantify anticipated benefits Qualify business value 2 Taking your Splunk Deployment to the Next Level Align with key objectives Measure your success
- 14. Steps to Aligning with key objectives 1 Align with key objectives • Align your project with something strategic • Take a top-down approach • Link your plan to Top-5 key objectives • Explain how Splunk aligns to they objectives • Use the Splunk Value Benchmarks to help you
- 15. 15 Common IT Goals Achieved with Splunk Reduce/Avoid Business Expenditures Infrastructure cost avoidance Future headcount avoidance Tools consolidation Improve Internal Efficiencies Labor savings with common IT processes such as incident, problem, change, release, security, audit, test and defect management Increase Revenue Avoid revenue impact from fewer business outages Faster delivery of real-time business analytics Improved innovation value for key business initiatives Accelerate Time to Market Faster test failure analysis Faster remediation of bugs and defects Fewer developer disruptions Protect & Improve our Brand More reliable business services Faster response to customer requirements Continuously Secure our Environment Better detection of cyber attacks Faster response to security incidents Continuous compliance monitoring Reduction in risk for data breach, fraud and IP theft
- 16. Qualify business value 2 Steps to Qualifying Business Value • Identify common issues and roadblocks • What’s hindering your key objectives • Document why something should change or be added • Describe the current challenges and pain points • Describe the desired state
- 17. Example of Qualifying Business Value Visibility to Environment Health & User Exp. Brute force approach providing visibility to key processes isn’t working and won’t scale Operations still lacks complete end-to-end visibility to the environment’s health, use and trends Blinds spots still exist in monitoring and data access for Operations which could help improve troubleshooting and uptime / availability Incident / Issue Notification Brute force approach to proactive monitoring isn’t working consistently and won’t scale There’s a “Waterfall effect” – small issues go without broader notification triggering other issues eventually leading to a bigger incident Users are aware of issues before Operations and call the helpdesk All the lights are “green” but still ~65% of incidents overall are reported first by the business Troubleshooting Incidents / Issues Operations troubleshooting is cumbersome and suboptimal It’s still manual across IT silos It’s difficult to find root cause of incidents quickly Performance issues are difficult to resolve Outages and impact are elongated due to manual efforts and silos Teams are distracted from their core work when they’re troubleshooting Recurring Incidents / Issues The Problem Management process isn’t working because there are many high severity incidents still without root cause determined As a result, Operations is solving the same problems again and again Opportunities exist to improve on incident avoidance since @25%+ of incidents are repeats DESIRED STATE VISION: Complete visibility to environment health & trends across full application stack for all stakeholders Proactively avoid issues before the business is impacted Reduce MTTR with rapid root cause analysis
- 18. Example of Qualifying Business Value Production Support • Complex layers of technology stack • Complex flow of data and calls across each layer • Lack of end to end visibility on data flow • Unclear customer impact during incidents • Lengthy manual investigation of logs cause longer outages • Investigation delays prevent real-time collaboration across teams • Developer escalations required to assist with production issues • Intermittent errors go unresolved for years (e-statements) Application Releases • Lengthy manual investigation to address release errors • Impossible to gain real-time collaboration between support staff and developers • Often unclear whether errors are caused by code or infrastructure • Not enough time during change windows to fix errors • Releases at risk due to slow determination of errors • Business can be impacted by 30-day release delays if release is backed out DESIRED STATE VISION: • Complete visibility of data flow across all layers • Quickly isolate the particular area in the stack that is causing issues • Real-time collaboration between teams to accelerate investigations of incidents and/or release errors • Proactively avoid issues before the business is impacted • Reduce MTTR with rapid log correlation and root cause analysis • Accelerate speed to investigate functional, performance and security QA test runs and resulting defects • Deliver faster time to value on key business projects
- 19. Steps to Quantifying Anticipated Benefits • Collect internal Key Performance Metrics • Leverage External Benchmarks to fill in the gaps • Use Splunk Customer Benchmarks to guide your efficiency calculations • Business cases are not an exact science, don’t worry about being too meticulous • Keep it conservative! 3 Quantify anticipated benefits
- 20. Key Performance Metrics thatDrive Value IT OPERATIONS › # of sev1, sev2, sev3 incidents per month › avg MTTR per Incident by severity › # people involved in Incident investigation › $ per hour of business impact › % incidents requiring post incident reviews › # hours for root cause analysis per incident › # servers (physical + virtual) › % servers virtualized › $ cost per physical vs. virtual server APP DELIVERY › # developers › % developer time spent troubleshooting › # request for dashboards and reports per month › # people to develop dashboards and reports › # large, medium, small project releases per year › $ business value per project release › # months from project kick-off to prod release › # test runs conducted per month › # pre-prod defects investigated per month SECURITY & COMPLIANCE › # of security alerts per week › # people for 1st first level triage › avg time to triage an alert › # security incidents per week › # people involved per incident › # sensitive records › $ business fraud per year › # audit activities per year › # people hours per audit activity Less than 10 KPIs per Value Center
- 21. Financial Analysis Made Easy • Over 50 Value Calculators • Driven by Actual Customer Results • Complete Financial Analysis • Best Practice TCO Models Don’t Forget • Follow the Impact • Capture All the Value • Summarize and Socialize 21 Quantifying Value with Splunk Tools
- 22. Fine tune your Anticipated Efficiencies
- 23. Forecast Future Value and ROI “Work with your Rep to gain access to the IVA – Interactive Value Assessment” Executive Report with Business Case Analysis Detailed use cases Benefit calculations Investment details ROI analysis Key goals Current pain points Proposed solution Adoption speed
- 24. Steps to Measuring your Success • Demonstrating success will help further the cause • Tell the story of your current Splunk usage • Identify your Top-3 success stories • Document specific challenges that existed prior to Splunk • Explain the business impact • Describe the solution achieved with Splunk 4 Measure your success
- 25. Measuring your Success With Splunk 1. How did Splunk help us address this scenario? 2. How fast were we able to implement a solution with Splunk? 3. Are we able to detect or isolate circumstances that were previously unnoticed or impossible to find? 4. How often has this type of scenario surfaced since Splunk has been in place? Guidelines - Before | After Questions for each Success Story Before Splunk 1. How often did this type of scenario occur, how long did it take to resolve and how many people were required? 2. What challenges did we face handling this type of scenario before Splunk? 3. Did we have to do any manual work? 4. Did we invest in infrastructure or other resources to address this before Splunk? 5. Did this cause direct financial impact? 6. Was customer service or customer loyalty affected? 7. How did this impact end-user productivity? 8. Did it affect our brand negatively, i.e. bad press or negative social media hits? 5. How faster are we able to respond? 6. Has this freed a % of our staff time to focus on other more important tasks? 7. Was this possible before Splunk? 8. Can we provide a dashboard screenshot?
- 26. Examples of a Customer Success Story “Money follows money well spent”
- 27. Plan your Splunk Staffing Roles Besureyouhavethestaffandskillstomaximizevalue 27 A successful and scalable deployment of Splunk relies on the orchestration of key roles and responsibilities, primarily centered around: Architecture Administration User adoption (Power User) Application development
- 28. Splunk Roles & Recommended Training 28 Splunk Roles Using Splunk Splunk Administration Searching and Reporting Creating Knowledge Objects Advanced Searching & Reporting Developing Apps with Splunk Developing with Splunk SDKs Architect Required Required Optional Optional Optional Optional Optional Admin Required Required Optional Optional Power User Required Required Required Optional Developer Required Optional Required Required Optional Required Optional for Splunk on-premises
- 29. Splunk Roles & Recommended Training 29 for Splunk Cloud Splunk Roles Using Splunk Splunk Administration Searching and Reporting Creating Knowledge Objects Advanced Searching & Reporting Developing Apps with Splunk Developing with Splunk SDKs Architect Required Optional Optional Optional Optional Optional Admin Required Optional Optional Power User Required Required Required Optional Developer Required Required Required Optional Required Optional
- 30. Map Your Roles & Highlight Training Gaps 30 Splunk Admin #name Splunk Developer #name Security Power User #name Collaboration Power User #name Database Power User #name CRM Power User #name Network Power User #name Financial Apps Power User #name Splunk Architect #name = Fully Trained = Partially Trained = Not assigned Web Power User #name Server Power User #name Your Company
- 31. Bring it all together! Quantified Benefits Drill down Use Cases Adoption Curve Key Objectives Alignment Current Pain Paints Desired End State Investment Schedule Financial Performance Training Plan Splunk Customer Benchmarks Current Success Stories Covered by the WEB IVA
- 32. 32 www.splunk.com/apptitude July 20th, 2015 Submission deadline
- 33. The 6th Annual Splunk Worldwide Users’ Conference September 21-24, 2015 The MGM Grand Hotel, Las Vegas • 50+ Customer Speakers • 50+ Splunk Speakers • 35+ Apps in Splunk Apps Showcase • 65 Technology Partners • 4,000+ IT & Business Professionals • 2 Keynote Sessions • 3 days of technical content (150+ Sessions) • 3 days of Splunk University – Get Splunk Certified – Get CPE credits for CISSP, CAP, SSCP, etc. – Save thousands on Splunk education! 33 Register at: conf.splunk.com
- 34. 34 We Want to Hear your Feedback! Afterthe Breakout Sessions conclude TextSplunk to878787 Andbeenteredforachancetowina$100AMEXgiftcard!
Editor's Notes
- You all know what a great platform Splunk is. So if it’s so great, why does our team exist? Well…Users love Splunk and clearly understand the value it delivers to them operationally, but they struggle with articulating it to their senior management in business terms. This leaves executives asking what THEY get from Splunk. They understand their people love it, but can’t put dollars, euros, yuan, or yen on it easily. The Value that Splunk brings to the business is a hidden gem for most executives. When they are able to understand the business value it delivers for them, in most cases it’s priceless.
- And finally, I would like to encourage all of you to attend our user conference in September. The energy level and passion that our customers bring to this event is simply electrifying. Combined with inspirational keynotes and 150+ breakout session across all areas of operational intelligence, It is simply the best forum to bring our Splunk community together, to learn about new and advanced Splunk offerings, and most of all to learn from one another.