


Tata steel ideation contest
- 1. Use of Analytics for improving Value Chain Visibilty Submitted by : Dev Karan Singh Maletia (12BM60060) Ashwini Kumar Rao (12BM60047)
- 2. Steel Industry • World crude steel production in 2011: 1518 million tonnes (mt). Annual Growth rate: 6.2% • Top Steel Producing countries: China (684 mt) > Japan (108 mt) > USA (86.4 mt) > India (72.2 mt) • Globally, revenue forecasted to reach $1,715 billion by 2017 with a CAGR of 5.1%(LUCINTEL Report) • Some Major Players worldwide: Arcelormittal, ThyssenKrupp, Nippon Steel, and POSCO • The emerging markets of China and India are expected to witness growth due to boom in sectors like construction, automotive and consumer durables.
- 3. Need of the hour - The use of Analytics • Data Management - Development & execution of architectures, policies, practices & procedures that manage the collection quality, standardization integration & aggregation of data across the enterprise • Business Intelligence - Business Intelligence or BI is the ability of an organisation to use its data and bring valuable information out of it and make it available to the right people at the right time at the right place via right channel and that too quickly • Advanced Analytics - Use of modern data mining, pattern matching, data visualization and predictive modelling to produce analyses and algorithms that help businesses make more meaningful and proactive decisions • Performance Management - Advanced methodologies, comprehensive metrics processes & analytical applications used to monitor and manage the business performance of the enterprise
- 4. Benefits & Trends in Analytics Easy Management of high data volumes Changing nature of data along 3 dimensions • Globally data continues to grow exponentially • Volume – Separating useful data & Better Compliance to Regulations output value information • Sources – Ever growing range of new • From carbon emission to compliance with sources of information like social media, Corruption Practices, Mitigating risks, etc blogs, etc for trends, brand, reputation, etc. • Types – with the rise of Web 2.0, newer Profitable Growth data types have evolved - Voice, Text & Video Analytics • Where to focus NPD, identify challenges, customer retention, lower costs New Signals • Real time operation insights & decision making using signals from voice, email, social networks, etc. Hidden Insight • Manage growing complexities of global businesses
- 5. Implications for the Steel Industry • Advanced analytics - Margin improvement of 2-4% • Parametric pricing - Better negotiation on price & avoidance of overpayment to vendors based on marginal changes in products • Commodities volatility - Better hedging against future losses due to price fluctuations in raw materials • M&A integration - Smooth integration of big companies to bring them to a common platform and have a single business entity by having similar product coding • As the complexity in the steel sector is high and due to the central role played by the supply chain in cost structure and profits, analytics is the field to look forward to • The supply chain may appear to be simpler in Steel Industry but the maximum margins are trapped inside different layers
- 6. Cost Benefit Analysis – Scorecard Method • Compares wildly different approaches in a common framework • Explains why one approach is measurably superior to another • Quantify trade-offs when no approach dominates all metrics • Tries to evaluate any visibility initiative in terms of expected visibility outputs Vs its cost & timeline inputs • To keep the scorecard realistic and concrete, it should be tied to specific business decisions Categories of visibility effectiveness: • Sensitivity: Measures the effectiveness of a supply chain visibility process in capturing data • Accessibility: Evaluates the integrity of the visibility with data model • Intelligence: Checks the effectiveness of the routines used to process data and render it into relevant information • Decision-Relevance: Measures how well the visibility solution integrates into business decisions. • Thinking in terms of “Fit”: Functionality or features of a visibility system or process are only valuable to the degree that they fit into the targeted business decision. • Other Considerations: The probable risks are not included in the visibility scorecard
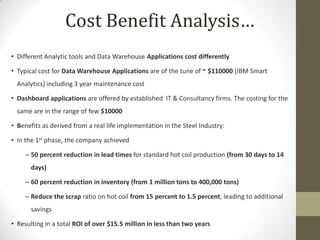
- 7. Cost Benefit Analysis… • Different Analytic tools and Data Warehouse Applications cost differently • Typical cost for Data Warehouse Applications are of the tune of ~ $110000 (IBM Smart Analytics) including 3 year maintenance cost • Dashboard applications are offered by established IT & Consultancy firms. The costing for the same are in the range of few $10000 • Benefits as derived from a real life implementation in the Steel Industry: • In the 1st phase, the company achieved – 50 percent reduction in lead times for standard hot coil production (from 30 days to 14 days) – 60 percent reduction in inventory (from 1 million tons to 400,000 tons) – Reduce the scrap ratio on hot coil from 15 percent to 1.5 percent, leading to additional savings • Resulting in a total ROI of over $15.5 million in less than two years
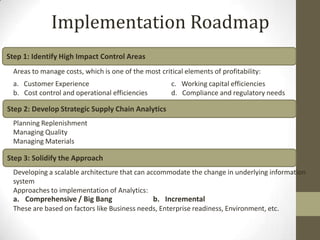
- 9. Implementation Roadmap Step 1: Identify High Impact Control Areas Areas to manage costs, which is one of the most critical elements of profitability: a. Customer Experience c. Working capital efficiencies b. Cost control and operational efficiencies d. Compliance and regulatory needs Step 2: Develop Strategic Supply Chain Analytics Planning Replenishment Managing Quality Managing Materials Step 3: Solidify the Approach Developing a scalable architecture that can accommodate the change in underlying information system Approaches to implementation of Analytics: a. Comprehensive / Big Bang b. Incremental These are based on factors like Business needs, Enterprise readiness, Environment, etc.
- 10. Step 4: Build a Business Case for the Implementation Quantifying the expected benefits and carefully analyzing the costs will help build a business case as well as set objective metrics for post implementation Step 5: Conceptualize the Solution • Choosing the right consulting and implementation partner • Determining the technology architecture and high-level business requirements • Selecting the optimal tools and technologies • Adopting the correct solution approach Step 6: Implement the Solution • 2 sub phases: development and deployment Step 7: Operationalize the Solution • Enhancing or upgrading solution occasionally to meet changing business requirements • Following reporting routines & staying abreast with the changes in the environment
- 11. Case Studies & Real Time Feasibility Analysis Applications of advanced analytics for the steel sector: • Product costs and margins: An established global steel producer’s legacy systems was not providing sufficient granularity into cost and profitability by product, order, mill, or customer. The system was slow to respond to changing market conditions. The company then implemented advanced analytic capabilities on top of a contemporary ERP backbone. The combination gave management faster and more accurate insights and helped to improve decision-making on pricing, demand management, production scheduling, and operational investments. • Customer insights and risk management: The most recent financial crisis and recession hit the automotive sector especially hard. This created huge risks for the steel industry. With the help of analytics risk scorecard for automotive supplier industry were made. This scorecard combined traditional financial metrics with non traditional indicators were used in making the dashboards. These dashboards allowed automakers and suppliers to make informed decisions at both a tactical, daily order level and, for the longer term, looking at their mix of customers and product offerings. • Capital investment decisions: The steel and process industries have long had tools available to simulate production processes. In the past, however, the tools were cumbersome, required highly trained experts to use them, and took weeks to provide answers. The new generation of tools combines visualization and dynamic simulation with traditional numerical results, and does so in a vastly more user-accessible fashion.
- 12. Supply Chain Visibility Dashboard
- 13. How Dashboard Works Select a Business Segment to view the different KPIs for that particular business segment. The selected business segment becomes green to indicate selection. Other values those are somehow related to the selected business segment will become white showing the relation. Values with no relation to the selected business segment will become grey. Similarly you can select a product and view the data related to that product. If the data is not available/applicable for the selected product, the dashboard will show a message “No data available”.
- 14. References: Aakhein Inc. Supply chain Supply Chain Analytics Business Intelligence- Infosys A sharper view: Analytics in global steel industry – Deloitte Business Intelligence in Manufacturing Team Informatics: Why Enterprise 2.0 is important to you Indiasteelexpo.in steel.gov.in Leveling the playing field: Business analytics for mid-sized companies – Deloitte Process analytics in the Iron and Steel Industry – Siemens Supply Chain Analytics: How Hard Should You Squeeze? - Deloitte