The Power of Infographics
- 1. The Power of InfographicsThe Business of Visualization Mark Smiciklas, Digital Strategist, IntersectionConsulting.com
- 2. Infographics have emerged as one of the most popular and shareable forms of social content.Robin Richards – JESS3
- 3. Same Search ~120 days ago = 574k** http://www.web-strategist.com/blog/2011/07/07/infographics-are-useful-but-they-must-evolve/
- 4. Why?
- 5. Easy to digest.Credit: http://www.flickr.com/photos/will-lion/2595497078/
- 6. Easy to share.Source: http://www.flickr.com/photos/webtreatsetc/5321658646/
- 7. They are cool..Source: http://www.flickr.com/photos/7372907@N07/3428778556/
- 8. One definition. Infographics are visual representations of information, data or knowledge that present complex information quickly and clearly.Wikipedia
- 9. For some it means data visualization.Source: http://www.flickr.com/photos/gdsdigital/4423754587
- 10. For others it’s idea art.Source: David Armano, darmano.typepad.com
- 11. Infographic types and applications.
- 12. StatisticsApplications: presenting company information, industry research.Source: http://www.flickr.com/photos/gdsdigital/4361707483/
- 13. ConceptsApplications: illustrating thought leadership or philosophy.
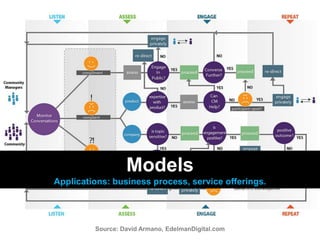
- 14. ModelsApplications: business process, service offerings.Source: David Armano, EdelmanDigital.com
- 15. CartoonsApplications: ideas, concepts, scenarios, culture.
- 16. InformationApplications: industry resources, specs, “cheat sheets”, comparisonsSource: http://jess3.com/the-blog-tree/
- 17. TimelinesApplications: evolution, progress, history, schedules.Source: http://conversations.nokia.com/2011/02/10/social-media-week-inside-nokia/?mobile
- 18. Getting started.
- 19. Explore new ways to inform.Source: http://www.flickr.com/photos/iareef/4478057025/
- 20. Record your thoughts.Source: http://www.flickr.com/photos/47388015@N00/5546771797/
- 21. Process and refine ideas.Source: David Armano, http://www.flickr.com/photos/7855449@N02/2780461830/
- 23. A few things to remember. Keep it simple.
- 24. Tell a story.
- 26. Your ideas > your software.
- 27. Just do it.Workflow example. Visualizing the idea that a heavy investment in social media won’t solve your organizational issues.
- 29. That morphed into a “house of cards”http://www.flickr.com/photos/peter_roberts/4457615801/
- 30. Which turned into a (bad) sketch
- 32. Infographic ROI. Infographics are cool but also add business value.
- 33. Brand Awareness1168 tweets, 722 inbound links, 58 blog articles, 3003 offsite views Source: http://www.slideshare.net/Eloqua/infographics-in-15-minutes
- 35. Improved ResultsSource: Dave Gray, Visual Thinking in Management, http://www.youtube.com/watch?v=fKADCvIBBeY
- 36. Content creation options. DIY.
- 38. Outsource to a pro.
- 39. Partner with an art student.About Mark SmiciklasMark’s background includes over 18 years in senior marketing roles, accumulating broad experience in the areas of marketing strategy, communication, business development and sales management. Blending strategic thinking with a practical approach, he teaches organizations how to leverage the dynamics of web 2.0 to achieve business objectives.Mark’s service offering is framed by his core beliefs in trust creation, listening, audience analysis and stakeholder engagement. Working with B2B and B2C clients and having experienced supply-side and consumer facing situations enable him to offer unique insight.An interest in the evolution of social business continues to motivate him, as does a sincere passion for teaching. Mark’s genuine love of technology and people continue to ignite ongoing learning and new thinking that aims to help individuals and organizations connect with their audiences. http://www.intersectionconsulting.comhttp://www.facebook.com/Intersection.Consultinghttps://twitter.com/intersection1http://www.flickr.com/photos/intersectionconsulting
- 40. The Power of InfographicsThe Business of Visualization Mark Smiciklas, Digital Strategist, IntersectionConsulting.com


