Location via proxy:   [ UP ]  
[Report a bug]   [Manage cookies]                
SlideShare a Scribd company logo

1

Good	
  News:	
  	
  You’re	
  already	
  a	
  measurement	
  expert!	
  

 What’s	
  the	
  poten=al	
  ROI	
  from	
  .	
  .	
  .	
  	
  (pick	
  one	
  and	
  brainstorm)	


   #1	
  -­‐	
  A	
  fabulous	
  haircut?	
  
   #2	
  -­‐	
  A	
  really	
  nice	
  new	
  pair	
  of	
  shoes?	
  
   #3	
  -­‐	
  Brushing	
  your	
  teeth?	
  
   #4	
  -­‐	
  Snow	
  skiing	
  lessons?	


   #5	
  -­‐	
  Dinner	
  and	
  movie	
  with	
  your	
  significant	
  other???	


                                              ©	
  2011	
  Beyond	
  ROI,	
  Inc.	
  •	
  	
  www.getBeyondROI.com	
     Page	
  1	


2

ASTD	
  State	
  of	
  the	
  Industry	
  Reports	
  

                                         ASTD	
  Study	
  #1	
  	
                                                                                                    ASTD	
  Study	
  #2	
  
 100%	
                                                                                                                        100%	
          91.3%	
  

   80%	
            74%	
                                                                                                       80%	
  

   60%	
                                                                                                                        60%	
                                53.9%	
  

   40%	
                                 31%	
                                                                                  40%	
  
                                                                                                                                                                                        22.9%	
  
   20%	
                                                     14%	
                                                              20%	
  
                                                                                       8%	
                                                                                                                 7.6%	
  
                                                                                                                                                                                                                              2.1%	
  
    0%	
                                                                                                                          0%	
  
                  Level	
  1 	
                   	
  
                                         Level	
  2         Level	
  3	
             Level	
  4 	
       Level	
  5     	
                      Level	
  1	
                   	
  
                                                                                                                                                                      Level	
  2                 	
  
                                                                                                                                                                                         Level	
  3                  	
  
                                                                                                                                                                                                            Level	
  4        Level	
  5      	
  
                 ReacKon         	
     Learning    	
     Behavior       	
         Results      	
       ROI   	
                            ReacKon        	
     Learning    	
     Behavior     	
     Results    	
       ROI    	
  

            2004	
  Study	
  Notes:	
  	
  Included	
  213	
  organiza=ons	
  represen=ng	
  the	
                                         2005	
  Study	
  Notes:	
  	
  Included	
  18	
  Fortune	
  500	
  companies	
  
            broadest	
  range	
  of	
  size	
  and	
  industry.	
  	
  Considered	
  by	
  ASTD	
  to	
                                    par=cipa=ng	
  in	
  ASTD’s	
  Benchmarking	
  Forum.	
  	
  These	
  organiza=ons	
  
            accurately	
  represent	
  “the	
  U.S.	
  norm.”	
                                                                            represent	
  the	
  largest	
  and	
  most	
  complex	
  global	
  learning	
  
                                                                                                                                           organiza=ons.	


            Companies	
  measuring	
  at	
  “Level	
  5	
  ROI”	
  were	
  included	
  in	
  the	
  
            category	
  “Level	
  4	
  Results.”	


                                                                                 ©	
  2011	
  Beyond	
  ROI,	
  Inc.	
  •	
  	
  www.getBeyondROI.com	
                                                                         Page	
  2	


3

Bersin	
  Research:	
  	
  Most	
  Valuable	
  Measures?	


                                  ©	
  2011	
  Beyond	
  ROI,	
  Inc.	
  •	


  www.getBeyondROI.com	
  
                                        ©	
  2010	
  Beyond	
  ROI,	
  Inc.	
  • www.getBeyondROI.com	
              Page	
  3	


4

What	
  is	
  Measured	
  Now?	


            Bersin & Associates © November 2006

                                           ©	
  2011	
  Beyond	
  ROI,	
  Inc.	
  •	


  www.getBeyondROI.com	
  
                                                 ©	
  2010	
  Beyond	
  ROI,	
  Inc.	
  • www.getBeyondROI.com	
              Page	
  4	


5

Desired	
  vs.	
  Actual	
  Measurement…	


                                ©	
  2011	
  Beyond	
  ROI,	
  Inc.	
  •	


  www.getBeyondROI.com	
  
                                      ©	
  2010	
  Beyond	
  ROI,	
  Inc.	
  • www.getBeyondROI.com	
              Page	
  5	


6

Is	
  there	
  funding	
  for	
  measurement?	


          82%	
  say,	
  “We	
  should	
  
         spend	
  more	
  –	
  or	
  much	
  
         more	
  on	
  measurement”	
  
                                        ©	
  2011	
  Beyond	
  ROI,	
  Inc.	
  •	


  www.getBeyondROI.com	
  
                                              ©	
  2010	
  Beyond	
  ROI,	
  Inc.	
  • www.getBeyondROI.com	
              Page	
  6	


7

“You’ve	
  always	
  known	
  that	
  well	
  designed	
  
       well	
  implemented	
  training	
  can	
  
  change	
  lives	
  and	
  grow	
  the	
  business…”	


 Now	
  you	
  can	
  prove	
  it.®	
  

            ©	
  2011	
  Beyond	
  ROI,	
  Inc.	
  •	
  	
  www.getBeyondROI.com	
     Page	
  7	


8

Who	
  do	
  we	
  work	
  with?	


 Over	
  800	
  assessment	
  and	
  measurement	
  projects	
  completed	
  with…	


                                               ©	
  2011	
  Beyond	
  ROI,	
  Inc.	
  •	
  	
  www.getBeyondROI.com	
     Page	
  8	


9

Why	
  measure	
  Power	
  Messaging?	
  

  Reason	
  #1:	
  	
  Capture	
  Business	
  Results	
  from	
  Power	
  Messaging	
  
      –  how	
  are	
  we	
  growing	
  people?	
  
      –  how	
  are	
  we	
  growing	
  the	
  business?	


  Reason	
  #2:	
  	
  Accountability	
  for	
  Execu=on	
  
      –  for	
  actually	
  using	
  new	
  knowledge,	
  skills,	
  and	
  process	
  
      –  for	
  manager	
  involvement	


  Reason	
  #3:	
  Feedback	
  for	
  Coaching	
  to	
  Power	
  Messaging	
  
      –  simple	
  
      –  relevant	
  
      –  ac=onable	
  

                                       ©	
  2011	
  Beyond	
  ROI,	
  Inc.	
  •	
  	
  www.getBeyondROI.com	
     Page	
  9	


10

The	
  Science:	
  	
  What	
  do	
  we	
  measure?	


                            Cause	
                                                                                           Effect	
  
                        “How	
  much	
  is	


  Linked	
  to…	
                        “How	
  much	
  does	
  
                          	
  it	
  used?”	
                                                                           	
  	
  it	
  help?”	
  

             Leading	
  Indicators	
  (surveys)	
                                                    Lagging	
  Indicators	
  (your	
  metrics)	
  
               use	
  of	
  19	
  Power	
  Messaging	
  skills,	
                                     Success	
  Stories	
  –	
  with	
  actual	
  customers	
  
                processes,	
  and	
  tools	
                                                           Pipeline	
  growth	
  
               5	
  coaching	
  ac=vi=es	
                                                            Performance	
  against	
  plan	
  
               9	
  support	
  and	
  reinforcement	
                                                 Deal	
  size,	
  Margin,	
  Volume,	
  etc.	
  
                ac=vi=es	


                                                   ©	
  2011	
  Beyond	
  ROI,	
  Inc.	
  •	
  	
  www.getBeyondROI.com	
                                Page	
  10	


11

How	
  do	
  we	
  get	
  them	
  to	
  be	
  honest?	


                                         ©	
  2011	
  Beyond	
  ROI,	
  Inc.	
  •	
  	
  www.getBeyondROI.com	
     Page	
  11	


12

©	
  2011	
  Beyond	
  ROI,	
  Inc.	
  •	
  	
  www.getBeyondROI.com	
     Page	
  12	


13

82%	
  return	
  (92	
  of	
  112)	


Leading	
  Indicators:	
  	
  How	
  much	
  are	
  they	
  using	
  it?	
  
    Overall	
  Power	
  Messaging	
  Applica=on:	
  	
  70.1%	
  	
  (excluding	
  Coaching)	


                                            ©	
  2011	
  Beyond	
  ROI,	
  Inc.	
  •	
  	
  www.getBeyondROI.com	
                                    Page	
  13	


14

82%	
  return	
  (92	
  of	
  112)	


Leading	
  Indicators:	
  	
  Most	
  used	
  Power	
  Messaging	
  skills?	


                                    ©	
  2011	
  Beyond	
  ROI,	
  Inc.	
  •	
  	
  www.getBeyondROI.com	
                                    Page	
  14	


15

82%	
  return	
  (92	
  of	
  112)	


Leading	
  Indicators:	
  	
  Least	
  used	
  Power	
  Messaging	
  skills?	


                                    ©	
  2011	
  Beyond	
  ROI,	
  Inc.	
  •	
  	
  www.getBeyondROI.com	
                                    Page	
  15	


16

What	
  about	
  the	
  “Lagging	
  Indicators?”	


                          Cause	
                                                                                           Effect	
  
                      “How	
  much	
  is	


  Linked	
  to…	
                        “How	
  much	
  does	
  
                        	
  it	
  used?”	
                                                                           	
  	
  it	
  help?”	
  

           Leading	
  Indicators	
  (surveys)	
                                                    Lagging	
  Indicators	
  (your	
  metrics)	
  
             use	
  of	
  19	
  Power	
  Messaging	
  skills,	
                                     Success	
  Stories	
  –	
  with	
  actual	
  customers	
  
              processes,	
  and	
  tools	
                                                           Pipeline	
  growth	
  
             5	
  coaching	
  ac=vi=es	
                                                            Performance	
  against	
  plan	
  
             9	
  support	
  and	
  reinforcement	
                                                 Deal	
  size,	
  Margin,	
  Volume,	
  etc.	
  
              ac=vi=es	


                                                 ©	
  2011	
  Beyond	
  ROI,	
  Inc.	
  •	
  	
  www.getBeyondROI.com	
                               Page	
  16	


17

Lagging	
  Indicators:	
  	
  64%	
  Provided	
  Success	
  Stories	
  (59	
  of	
  92	
  parKcipants)	
  
   PercepKons	
  of	
  Value	
  in	
  the	
  Success	
  Story:	
  	
  “Overall,	
  how	
  much	
  did	
  your	
  use	
  of	
  the	
  principles,	
  
   tools,	
  and	
  skills	
  from	
  Power	
  Messaging	
  contribute	
  to	
  your	
  SUCCESS	
  in	
  this	
  par=cular	
  sales	
  
   situa=on?”	


                                                ©	
  2011	
  Beyond	
  ROI,	
  Inc.	
  •	
  	
  www.getBeyondROI.com	
                                 Page	
  17	


18

Reality	
  Check®:	
  	
  Success	
  Story	
  Summary	
  

 Financial	
  Impact:	
  	
  A	
  total	
  of	
  $51,418,000	
  in	
  closed	
  business	
  and	
  $135,540,000	
  in	
  new	
  poten=al	
  business	
  was	
  
 reported	
  in	
  48	
  success	
  stories	
  with	
  specific	
  examples	
  of	
  how	
  Power	
  Messaging	
  was	
  used	
  in	
  the	
  sales	
  process.	


               Number	
             Closed	
                          New	
                      Impact	
  of	
  Power	
  Messaging	
  	
            Total	
  Factored	
  
               of	
  Stories       Business	
                      OpportuniKes                             on	
  Success                                Value

                     4            	
  $9,200,000	
                  	
  $11,450,000	
            “made	
  all	
  the	
  difference”	
  -­‐	
  100%       	
  $20,650,000	
  

                    21          	
  $19,718,000	
                   	
  $69,600,000	
   “made	
  a	
  significant	
  difference”	
  -­‐	
  75%            	
  $66,988,500	
  

                    19          	
  $21,250,000	
                   	
  $51,790,000	
               “made	
  some	
  difference”	
  -­‐	
  50%           	
  $36,520,000	
  

                     3            	
  $1,250,000	
                   	
  $2,500,000	
              “made	
  a	
  likle	
  difference”	
  -­‐	
  25%           	
  $937,500	
  

                     1                        	
  $0	


  $200,000	
      “made	
  no	
  difference,	
  or	
  worse”	
  -­‐	
  0%                     	
  $0	


                    48           $51,418,000                       $135,540,000                                                                        $125,096,000


                                                                    ©	
  2011	
  Beyond	
  ROI,	
  Inc.	
  •	
  	
  www.getBeyondROI.com	
                                                  Page	
  18	


19

Reality	
  Check®:	
  	
  Success	
  Story	
  Summary	
  

     How	
  were	
  Success	
  Stories	
  captured?	
  	
  Similar	
  to	
  a	
  behavioral	
  interview,	
  the	
  RealityCheck	
  success	
  stories	
  
     enable	
  par=cipants	
  to	
  provide	
  a	
  single	
  specific	
  example	
  of	
  a	
  =me	
  when	
  they	
  used	
  Power	
  Messaging	
  with	
  an	
  
     actual	
  customer.	


     What	
  do	
  the	
  numbers	
  mean?	
  	
  Success	
  Stories	
  are	
  simply	
  a	
  way	
  to	
  LINK	
  applica=on	
  and	
  results.	
  	
  Because	
  we	
  
     asked	
  about	
  only	
  one	
  opportunity	
  per	
  par=cipant,	
  these	
  totals	
  do	
  NOT	
  represent	
  the	
  full	
  impact	
  of	
  the	
  
     Power	
  Messaging	
  program.	


     Totals	
  were	
  gathered	
  according	
  to	
  these	
  conservaKve	
  standards:	
  

      If	
  a	
  range	
  of	
  values	
  was	
  provided	
  in	
  the	
  success	
  story,	
  we	
  used	
  the	
  lowest	
  number	
  (e.g.,	
  one	
  par=cipant	
  
     reported	
  “35K	
  -­‐	
  100K	
  closed”	
  then	
  $35,000	
  was	
  counted).	
  
      If	
  we	
  did	
  not	
  see	
  clear	
  evidence	
  of	
  the	
  Power	
  Messaging	
  principles,	
  skills,	
  and	
  strategies	
  in	
  the	
  
     RealityCheck™	
  success	
  stories,	
  the	
  revenue	
  was	
  NOT	
  included.	
  	
  
      We	
  encourage	
  you	
  to	
  do	
  a	
  “spot	
  check”	
  on	
  a	
  handful	
  of	
  success	
  stories	
  to	
  verify	
  the	
  closed	
  and	
  poten=al	
  
     revenue	
  amounts	
  provided	
  by	
  par=cipants	
  to	
  verify	
  accuracy.	


                                                       ©	
  2011	
  Beyond	
  ROI,	
  Inc.	
  •	
  	
  www.getBeyondROI.com	
                                                 Page	
  19	


20

Comparisons:	
  	
  Leading	
  and	
  Lagging	
  Indicators	


                         Cause	
                                                                                         Effect	
  
                     “How	
  much	
  is	


  Linked	
  to…	
                         “How	
  much	
  does	
  
                       	
  it	
  used?”	
                                                                            	
  	
  it	
  help?”	


    Comparison	
  #1	
  –	
  How	
  does	
  coaching	
  impact	
  Power	
  Messaging	
  usage?	
  
    Comparison	
  #2	
  –	
  How	
  does	
  higher	
  Power	
  Messaging	
  usage	
  correlate	
  with	
  larger	
  sales?	
  
    Comparison	
  #3	
  –	
  How	
  does	
  higher	
  Power	
  Messaging	
  usage	
  correlate	
  new	
  opportuniKes?	


                                                  ©	
  2011	
  Beyond	
  ROI,	
  Inc.	
  •	
  	
  www.getBeyondROI.com	
                        Page	
  20	


21

82%	
  return	
  (92	
  of	
  112)	


Comparison	
  #1:	
  	
  by	
  Coaching	
  .	
  .	
  .	
  	
  
    PowerView	
  QuesKon:	
  	
  “Your	
  mastery	
  of	
  Power	
  Messaging	
  skills	
  and	
  principles	
  will	
  con=nue	
  to	
  
    improve	
  over	
  =me,	
  especially	
  when	
  you	
  apply	
  them	
  regularly	
  with	
  a	
  helpful	
  coach,	
  and	
  take	
  
    advantage	
  of	
  the	
  available	
  reinforcement	
  content.”	


                                               ©	
  2011	
  Beyond	
  ROI,	
  Inc.	
  •	
  	
  www.getBeyondROI.com	
                                    Page	
  21	


22

Comparison	
  #1:	
  	
  Coaching	
  and	
  Skill	
  ApplicaKon	
  
  Basis	
  for	
  Comparison:	
  	
  Coaching	
  Ac=vity	
  (5	
  items)	
  compared	
  to	
  each	
  par=cipant’s	
  applica=on	
  of	
  
  Power	
  Messaging	
  skills	
  (19	
  items).	
  	
  Both	
  scales	
  run	
  from	
  0-­‐100%	
  of	
  the	
  =me.	


    StaKsKcal	
  Significance:	
  	
  The	
  rela=onship	
  between	
  manager	
  involvement	
  and	
  skill	
  usage	
  is	
  sta=s=cally	
  significant,	
  where	
  
    Student’s	
  T-­‐test	
  =	
  6.119,	
  confidence	
  interval	
  of	
  p	
  <	
  0.028	
  @	
  84	
  d.f.	
  (two-­‐tailed	
  test,	
  type	
  1	
  error,	
  95%	
  confidence	
  interval).	


                                                                 ©	
  2011	
  Beyond	
  ROI,	
  Inc.	
  •	
  	
  www.getBeyondROI.com	
                                                                Page	
  22	


23

Comparison	
  #1b:	
  	
  Coaching	
  and	
  Skill	
  ApplicaKon	
  
    Basis	
  for	
  Comparison:	
  	
  Coaching	
  Ac=vity	
  (5	
  items)	
  compared	
  to	
  each	
  par=cipant’s	
  applica=on	
  of	
  
    Power	
  Messaging	
  skills	
  (18	
  items).	
  	
  Both	
  scales	
  run	
  from	
  0-­‐100%	
  of	
  the	
  =me.	


    StaKsKcal	
  Significance:	
  	
  The	
  rela=onship	
  between	
  manager	
  involvement	
  and	
  skill	
  usage	
  is	
  sta=s=cally	
  significant,	
  where	
  
    Student’s	
  T-­‐test	
  =	
  6.638,	
  confidence	
  interval	
  of	
  p	
  <	
  0.01	
  @	
  86	
  d.f.	
  (one-­‐tailed	
  test,	
  type	
  1	
  error).	


                                                        ©	
  2011	
  Beyond	
  ROI,	
  Inc.	
  •	
  	
  www.getBeyondROI.com	
                                           Page	
  23	


24

Comparison	
  #2:	
  	
  by	
  Skill	
  ApplicaKon	
  .	
  .	
  .	
  	
  
           Number	
  of	
  Par=cipants	


                                                                                                                                    “Low	
  	
                                                                                                               “High	


  Adopters”	
                                                                                                      	
  	
  Adopters”	


  0%	


  25%	


  50%	


  75%	


  100%	
  
                                             “Never”	
                               “Rarely”	
                                 “Some=mes”	
                                          “Frequently”	
                                         “Always”	
  

                                                                                              ©	
  2011	
  Beyond	
  ROI,	
  Inc.	
  •	
  	
  www.getBeyondROI.com	
                                                                                                            Page	
  24	


25

Comparison	
  #2:	
  	
  Skill	
  ApplicaKon	
  and	
  Closed	
  Business	
  
  Basis	
  for	
  Comparison:	
  	
  We	
  compared	
  par=cipants	
  with	
  “above”	
  vs.	
  “below	
  average”	
  applica=on	
  of	
  
  19	
  Power	
  Messaging	
  skills	
  to	
  closed	
  business,	
  as	
  captured	
  in	
  in	
  48	
  Success	
  Stories.	


    StaKsKcal	
  Significance:	
  	
  The	
  rela=onship	
  between	
  skill	
  usage	
  and	
  closed	
  business	
  is	
  sta=s=cally	
  significant,	
  where	
  	
  
    Student’s	
  T-­‐test	
  =	
  3.426,	
  confidence	
  interval	
  of	
  p	
  <	
  0.002	
  @	
  28	
  d.f.	
  (two-­‐tailed	
  test,	
  type	
  1	
  error,	
  95%	
  confidence	
  interval).	


                                                                 ©	
  2011	
  Beyond	
  ROI,	
  Inc.	
  •	
  	
  www.getBeyondROI.com	
                                                                Page	
  25	


26

Comparison	
  #3:	
  	
  Skill	
  ApplicaKon	
  and	
  New	
  OpportuniKes	
  
 Basis	
  for	
  Comparison:	
  	
  We	
  compared	
  par=cipants	
  with	
  “above”	
  vs.	
  “below	
  average”	
  applica=on	
  of	
  
 19	
  Power	
  Messaging	
  skills	
  to	
  new	
  opportuni=es,	
  as	
  captured	
  in	
  in	
  48	
  Success	
  Stories.	


   StaKsKcal	
  Significance:	
  	
  The	
  rela=onship	
  between	
  skill	
  usage	
  and	
  new	
  opportuni=es	
  is	
  sta=s=cally	
  significant,	
  where	
  	
  
   Student’s	
  T-­‐test	
  =	
  4.882,	
  confidence	
  interval	
  of	
  p	
  <	
  .01	
  @	
  44	
  d.f.	
  (two-­‐tailed	
  test,	
  type	
  1	
  error,	
  95%	
  confidence	
  interval).	


                                                                  ©	
  2011	
  Beyond	
  ROI,	
  Inc.	
  •	
  	
  www.getBeyondROI.com	
                                                                Page	
  26	


27

Comments:	
  	
  How	
  will	
  Power	
  Messaging	
  impact	
  your	
  Career?	
  

    “Power	
  Messaging	
  (Corporate	
  Visions)	
  is	
  not	
  just	
  a	
  course	
  that	
  you	
  take	
  like	
  a	
  SPIN	
  selling	
  or	
  any	
  
     other	
  sales	
  course	
  we	
  have	
  all	
  taken.	
  This	
  is	
  something	
  that	
  if	
  you	
  truly	
  embrace	
  it	
  will	
  change	
  
     not	
  only	
  you,	
  but	
  your	
  customers	
  and	
  anyone	
  you	
  deal	
  with	
  in	
  life.	
  I	
  am	
  not	
  the	
  same	
  Account	
  
     Manager	
  I	
  was	
  before	
  this	
  course	
  and	
  I	
  am	
  on	
  a	
  different	
  Career	
  path	
  than	
  I	
  was	
  before	
  (In	
  a	
  
     Good	
  Way).”	
  

    “Best	
  training	
  and	
  program	
  we	
  have	
  ever	
  had	
  and	
  used	
  -­‐	
  very	
  pracPcal	
  and	
  relevant.	
  	
  Can	
  only	
  
     make	
  me	
  a	
  beQer	
  salesperson.”	
  

    “It	
  has	
  definitely	
  made	
  me	
  a	
  beQer	
  sales	
  rep	
  in	
  the	
  eyes	
  of	
  my	
  customers.	
  Larger	
  sales.	
  I	
  feel	
  it	
  
     was	
  the	
  best	
  applicable	
  training	
  I	
  have	
  received	
  in	
  5	
  years.”	
  

    “It	
  just	
  creates	
  a	
  whole	
  new	
  way	
  of	
  thinking	
  as	
  I	
  prepare	
  for	
  and	
  execute	
  meePngs	
  with	
  
     customers.	
  I	
  think	
  it	
  helps	
  us	
  think	
  outside	
  the	
  box	
  and	
  posiPon	
  ourselves	
  different	
  that	
  our	
  
     compePPon	
  in	
  life	
  and	
  sales.	
  	
  I	
  think	
  it	
  helps	
  us	
  see	
  the	
  whole	
  picture	
  in	
  all	
  that	
  we	
  do.”	


                                                   ©	
  2011	
  Beyond	
  ROI,	
  Inc.	
  •	
  	
  www.getBeyondROI.com	
                                       Page	
  27	


28

Appendix	
  A	
  

ADDITIONAL	
  RESULTS	


                    ©	
  2011	
  Beyond	
  ROI,	
  Inc.	
  •	
  	
  www.getBeyondROI.com	
     Page	
  28	


29

82%	
  return	
  (92	
  of	
  112)	


Overall	
  PercepKons	
  of	
  Power	
  Messaging:	
  	
  Value	
  
   Overall	
  Value	
  of	
  Power	
  Messaging:	
  	
  “Overall,	
  how	
  VALUABLE	
  are	
  the	
  principles,	
  techniques,	
  and	
  
   skills	
  in	
  Power	
  Messaging	
  to	
  you	
  in	
  your	
  role?”	


                                            ©	
  2011	
  Beyond	
  ROI,	
  Inc.	
  •	
  	
  www.getBeyondROI.com	
                                    Page	
  29	


30

82%	
  return	
  (92	
  of	
  112)	


Overall	
  PercepKons	
  of	
  Power	
  Messaging:	
  	
  PracKcality	
  
   Overall	
  PracKcality	
  of	
  Power	
  Messaging:	
  	
  “Overall,	
  how	
  PRACTICAL	
  are	
  the	
  Power	
  Messaging	
  
   tools	
  and	
  messages	
  to	
  you	
  in	
  your	
  role?”	


                                           ©	
  2011	
  Beyond	
  ROI,	
  Inc.	
  •	
  	
  www.getBeyondROI.com	
                                    Page	
  30	


31

Industries	
  we’ve	
  gonen	
  to	
  know:	
  

          high-­‐tech	
                                                              transporta=on	
  
          telecom	
                                                                  insurance	
  	
  
          financial	
  and	
  business	
  services	
                                  media	
  
          energy	
  and	
  petrochemical	
                                           commercial	
  real	
  estate	
  
          manufacturing	
                                                            M&A,	
  venture	
  capital	
  
          consumer	
  packaged	
  goods	
                                            churches,	
  schools,	
  and	
  prisons	
  
          pharmaceu=cals	
  	
  
          medical	
  equipment	


                                       ©	
  2011	
  Beyond	
  ROI,	
  Inc.	
  •	
  	
  www.getBeyondROI.com	
                        Page	
  31	


More Related Content

Take the Guesswork Out of Measuring ROI for Sales Training

  • 1. Good  News:    You’re  already  a  measurement  expert!   What’s  the  poten=al  ROI  from  .  .  .    (pick  one  and  brainstorm)       #1  -­‐  A  fabulous  haircut?     #2  -­‐  A  really  nice  new  pair  of  shoes?     #3  -­‐  Brushing  your  teeth?     #4  -­‐  Snow  skiing  lessons?         #5  -­‐  Dinner  and  movie  with  your  significant  other???   ©  2011  Beyond  ROI,  Inc.  •    www.getBeyondROI.com   Page  1    
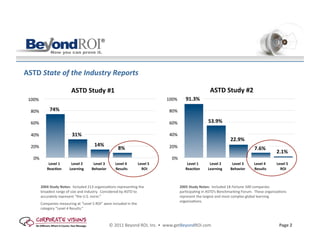
  • 2. ASTD  State  of  the  Industry  Reports   ASTD  Study  #1     ASTD  Study  #2   100%   100%   91.3%   80%   74%   80%   60%   60%   53.9%   40%   31%   40%   22.9%   20%   14%   20%   8%   7.6%   2.1%   0%   0%   Level  1     Level  2 Level  3   Level  4   Level  5   Level  1     Level  2   Level  3   Level  4 Level  5   ReacKon   Learning   Behavior   Results   ROI   ReacKon   Learning   Behavior   Results   ROI   2004  Study  Notes:    Included  213  organiza=ons  represen=ng  the   2005  Study  Notes:    Included  18  Fortune  500  companies   broadest  range  of  size  and  industry.    Considered  by  ASTD  to   par=cipa=ng  in  ASTD’s  Benchmarking  Forum.    These  organiza=ons   accurately  represent  “the  U.S.  norm.”   represent  the  largest  and  most  complex  global  learning   organiza=ons.       Companies  measuring  at  “Level  5  ROI”  were  included  in  the   category  “Level  4  Results.”   ©  2011  Beyond  ROI,  Inc.  •    www.getBeyondROI.com   Page  2    
  • 3. Bersin  Research:    Most  Valuable  Measures?   ©  2011  Beyond  ROI,  Inc.  •        www.getBeyondROI.com   ©  2010  Beyond  ROI,  Inc.  • www.getBeyondROI.com   Page  3    
  • 4. What  is  Measured  Now?   Bersin & Associates © November 2006 ©  2011  Beyond  ROI,  Inc.  •        www.getBeyondROI.com   ©  2010  Beyond  ROI,  Inc.  • www.getBeyondROI.com   Page  4    
  • 5. Desired  vs.  Actual  Measurement…   ©  2011  Beyond  ROI,  Inc.  •        www.getBeyondROI.com   ©  2010  Beyond  ROI,  Inc.  • www.getBeyondROI.com   Page  5    
  • 6. Is  there  funding  for  measurement?   82%  say,  “We  should   spend  more  –  or  much   more  on  measurement”   ©  2011  Beyond  ROI,  Inc.  •        www.getBeyondROI.com   ©  2010  Beyond  ROI,  Inc.  • www.getBeyondROI.com   Page  6    
  • 7. “You’ve  always  known  that  well  designed   well  implemented  training  can   change  lives  and  grow  the  business…”   Now  you  can  prove  it.®   ©  2011  Beyond  ROI,  Inc.  •    www.getBeyondROI.com   Page  7    
  • 8. Who  do  we  work  with?       Over  800  assessment  and  measurement  projects  completed  with…   ©  2011  Beyond  ROI,  Inc.  •    www.getBeyondROI.com   Page  8    
  • 9. Why  measure  Power  Messaging?     Reason  #1:    Capture  Business  Results  from  Power  Messaging   –  how  are  we  growing  people?   –  how  are  we  growing  the  business?     Reason  #2:    Accountability  for  Execu=on   –  for  actually  using  new  knowledge,  skills,  and  process   –  for  manager  involvement     Reason  #3:  Feedback  for  Coaching  to  Power  Messaging   –  simple   –  relevant   –  ac=onable   ©  2011  Beyond  ROI,  Inc.  •    www.getBeyondROI.com   Page  9    
  • 10. The  Science:    What  do  we  measure?   Cause   Effect   “How  much  is            Linked  to…   “How  much  does    it  used?”      it  help?”   Leading  Indicators  (surveys)   Lagging  Indicators  (your  metrics)     use  of  19  Power  Messaging  skills,     Success  Stories  –  with  actual  customers   processes,  and  tools     Pipeline  growth     5  coaching  ac=vi=es     Performance  against  plan     9  support  and  reinforcement     Deal  size,  Margin,  Volume,  etc.   ac=vi=es     ©  2011  Beyond  ROI,  Inc.  •    www.getBeyondROI.com   Page  10    
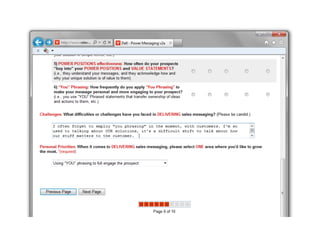
  • 11. How  do  we  get  them  to  be  honest?   ©  2011  Beyond  ROI,  Inc.  •    www.getBeyondROI.com   Page  11    
  • 12. ©  2011  Beyond  ROI,  Inc.  •    www.getBeyondROI.com   Page  12    
  • 13. 82%  return  (92  of  112)   Leading  Indicators:    How  much  are  they  using  it?   Overall  Power  Messaging  Applica=on:    70.1%    (excluding  Coaching)   ©  2011  Beyond  ROI,  Inc.  •    www.getBeyondROI.com   Page  13    
  • 14. 82%  return  (92  of  112)   Leading  Indicators:    Most  used  Power  Messaging  skills?   ©  2011  Beyond  ROI,  Inc.  •    www.getBeyondROI.com   Page  14    
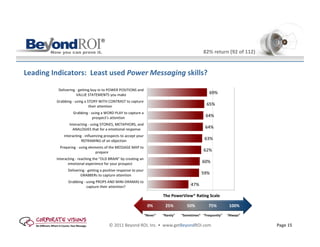
  • 15. 82%  return  (92  of  112)   Leading  Indicators:    Least  used  Power  Messaging  skills?   ©  2011  Beyond  ROI,  Inc.  •    www.getBeyondROI.com   Page  15    
  • 16. What  about  the  “Lagging  Indicators?”   Cause   Effect   “How  much  is            Linked  to…   “How  much  does    it  used?”      it  help?”   Leading  Indicators  (surveys)   Lagging  Indicators  (your  metrics)     use  of  19  Power  Messaging  skills,     Success  Stories  –  with  actual  customers   processes,  and  tools     Pipeline  growth     5  coaching  ac=vi=es     Performance  against  plan     9  support  and  reinforcement     Deal  size,  Margin,  Volume,  etc.   ac=vi=es     ©  2011  Beyond  ROI,  Inc.  •    www.getBeyondROI.com   Page  16    
  • 17. Lagging  Indicators:    64%  Provided  Success  Stories  (59  of  92  parKcipants)   PercepKons  of  Value  in  the  Success  Story:    “Overall,  how  much  did  your  use  of  the  principles,   tools,  and  skills  from  Power  Messaging  contribute  to  your  SUCCESS  in  this  par=cular  sales   situa=on?”   ©  2011  Beyond  ROI,  Inc.  •    www.getBeyondROI.com   Page  17    
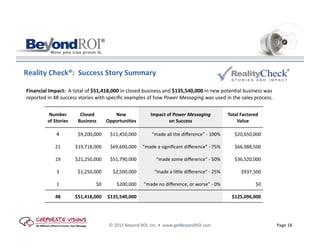
  • 18. Reality  Check®:    Success  Story  Summary   Financial  Impact:    A  total  of  $51,418,000  in  closed  business  and  $135,540,000  in  new  poten=al  business  was   reported  in  48  success  stories  with  specific  examples  of  how  Power  Messaging  was  used  in  the  sales  process.     Number   Closed   New   Impact  of  Power  Messaging     Total  Factored   of  Stories Business   OpportuniKes on  Success Value 4  $9,200,000    $11,450,000   “made  all  the  difference”  -­‐  100%  $20,650,000   21  $19,718,000    $69,600,000   “made  a  significant  difference”  -­‐  75%  $66,988,500   19  $21,250,000    $51,790,000   “made  some  difference”  -­‐  50%  $36,520,000   3  $1,250,000    $2,500,000   “made  a  likle  difference”  -­‐  25%  $937,500   1  $0        $200,000   “made  no  difference,  or  worse”  -­‐  0%  $0       48 $51,418,000 $135,540,000 $125,096,000 ©  2011  Beyond  ROI,  Inc.  •    www.getBeyondROI.com   Page  18    
  • 19. Reality  Check®:    Success  Story  Summary   How  were  Success  Stories  captured?    Similar  to  a  behavioral  interview,  the  RealityCheck  success  stories   enable  par=cipants  to  provide  a  single  specific  example  of  a  =me  when  they  used  Power  Messaging  with  an   actual  customer.     What  do  the  numbers  mean?    Success  Stories  are  simply  a  way  to  LINK  applica=on  and  results.    Because  we   asked  about  only  one  opportunity  per  par=cipant,  these  totals  do  NOT  represent  the  full  impact  of  the   Power  Messaging  program.       Totals  were  gathered  according  to  these  conservaKve  standards:    If  a  range  of  values  was  provided  in  the  success  story,  we  used  the  lowest  number  (e.g.,  one  par=cipant   reported  “35K  -­‐  100K  closed”  then  $35,000  was  counted).    If  we  did  not  see  clear  evidence  of  the  Power  Messaging  principles,  skills,  and  strategies  in  the   RealityCheck™  success  stories,  the  revenue  was  NOT  included.      We  encourage  you  to  do  a  “spot  check”  on  a  handful  of  success  stories  to  verify  the  closed  and  poten=al   revenue  amounts  provided  by  par=cipants  to  verify  accuracy.   ©  2011  Beyond  ROI,  Inc.  •    www.getBeyondROI.com   Page  19    
  • 20. Comparisons:    Leading  and  Lagging  Indicators   Cause   Effect   “How  much  is            Linked  to…   “How  much  does    it  used?”      it  help?”     Comparison  #1  –  How  does  coaching  impact  Power  Messaging  usage?     Comparison  #2  –  How  does  higher  Power  Messaging  usage  correlate  with  larger  sales?     Comparison  #3  –  How  does  higher  Power  Messaging  usage  correlate  new  opportuniKes?   ©  2011  Beyond  ROI,  Inc.  •    www.getBeyondROI.com   Page  20    
  • 21. 82%  return  (92  of  112)   Comparison  #1:    by  Coaching  .  .  .     PowerView  QuesKon:    “Your  mastery  of  Power  Messaging  skills  and  principles  will  con=nue  to   improve  over  =me,  especially  when  you  apply  them  regularly  with  a  helpful  coach,  and  take   advantage  of  the  available  reinforcement  content.”     ©  2011  Beyond  ROI,  Inc.  •    www.getBeyondROI.com   Page  21    
  • 22. Comparison  #1:    Coaching  and  Skill  ApplicaKon   Basis  for  Comparison:    Coaching  Ac=vity  (5  items)  compared  to  each  par=cipant’s  applica=on  of   Power  Messaging  skills  (19  items).    Both  scales  run  from  0-­‐100%  of  the  =me.     StaKsKcal  Significance:    The  rela=onship  between  manager  involvement  and  skill  usage  is  sta=s=cally  significant,  where   Student’s  T-­‐test  =  6.119,  confidence  interval  of  p  <  0.028  @  84  d.f.  (two-­‐tailed  test,  type  1  error,  95%  confidence  interval).   ©  2011  Beyond  ROI,  Inc.  •    www.getBeyondROI.com   Page  22    
  • 23. Comparison  #1b:    Coaching  and  Skill  ApplicaKon   Basis  for  Comparison:    Coaching  Ac=vity  (5  items)  compared  to  each  par=cipant’s  applica=on  of   Power  Messaging  skills  (18  items).    Both  scales  run  from  0-­‐100%  of  the  =me.     StaKsKcal  Significance:    The  rela=onship  between  manager  involvement  and  skill  usage  is  sta=s=cally  significant,  where   Student’s  T-­‐test  =  6.638,  confidence  interval  of  p  <  0.01  @  86  d.f.  (one-­‐tailed  test,  type  1  error).   ©  2011  Beyond  ROI,  Inc.  •    www.getBeyondROI.com   Page  23    
  • 24. Comparison  #2:    by  Skill  ApplicaKon  .  .  .     Number  of  Par=cipants   “Low     “High        Adopters”      Adopters”    0%                        25%                          50%                          75%                        100%   “Never”   “Rarely”   “Some=mes”   “Frequently”   “Always”   ©  2011  Beyond  ROI,  Inc.  •    www.getBeyondROI.com   Page  24    
  • 25. Comparison  #2:    Skill  ApplicaKon  and  Closed  Business   Basis  for  Comparison:    We  compared  par=cipants  with  “above”  vs.  “below  average”  applica=on  of   19  Power  Messaging  skills  to  closed  business,  as  captured  in  in  48  Success  Stories.   StaKsKcal  Significance:    The  rela=onship  between  skill  usage  and  closed  business  is  sta=s=cally  significant,  where     Student’s  T-­‐test  =  3.426,  confidence  interval  of  p  <  0.002  @  28  d.f.  (two-­‐tailed  test,  type  1  error,  95%  confidence  interval).   ©  2011  Beyond  ROI,  Inc.  •    www.getBeyondROI.com   Page  25    
  • 26. Comparison  #3:    Skill  ApplicaKon  and  New  OpportuniKes   Basis  for  Comparison:    We  compared  par=cipants  with  “above”  vs.  “below  average”  applica=on  of   19  Power  Messaging  skills  to  new  opportuni=es,  as  captured  in  in  48  Success  Stories.   StaKsKcal  Significance:    The  rela=onship  between  skill  usage  and  new  opportuni=es  is  sta=s=cally  significant,  where     Student’s  T-­‐test  =  4.882,  confidence  interval  of  p  <  .01  @  44  d.f.  (two-­‐tailed  test,  type  1  error,  95%  confidence  interval).     ©  2011  Beyond  ROI,  Inc.  •    www.getBeyondROI.com   Page  26    
  • 27. Comments:    How  will  Power  Messaging  impact  your  Career?     “Power  Messaging  (Corporate  Visions)  is  not  just  a  course  that  you  take  like  a  SPIN  selling  or  any   other  sales  course  we  have  all  taken.  This  is  something  that  if  you  truly  embrace  it  will  change   not  only  you,  but  your  customers  and  anyone  you  deal  with  in  life.  I  am  not  the  same  Account   Manager  I  was  before  this  course  and  I  am  on  a  different  Career  path  than  I  was  before  (In  a   Good  Way).”     “Best  training  and  program  we  have  ever  had  and  used  -­‐  very  pracPcal  and  relevant.    Can  only   make  me  a  beQer  salesperson.”     “It  has  definitely  made  me  a  beQer  sales  rep  in  the  eyes  of  my  customers.  Larger  sales.  I  feel  it   was  the  best  applicable  training  I  have  received  in  5  years.”     “It  just  creates  a  whole  new  way  of  thinking  as  I  prepare  for  and  execute  meePngs  with   customers.  I  think  it  helps  us  think  outside  the  box  and  posiPon  ourselves  different  that  our   compePPon  in  life  and  sales.    I  think  it  helps  us  see  the  whole  picture  in  all  that  we  do.”   ©  2011  Beyond  ROI,  Inc.  •    www.getBeyondROI.com   Page  27    
  • 28. Appendix  A   ADDITIONAL  RESULTS     ©  2011  Beyond  ROI,  Inc.  •    www.getBeyondROI.com   Page  28    
  • 29. 82%  return  (92  of  112)   Overall  PercepKons  of  Power  Messaging:    Value   Overall  Value  of  Power  Messaging:    “Overall,  how  VALUABLE  are  the  principles,  techniques,  and   skills  in  Power  Messaging  to  you  in  your  role?”   ©  2011  Beyond  ROI,  Inc.  •    www.getBeyondROI.com   Page  29    
  • 30. 82%  return  (92  of  112)   Overall  PercepKons  of  Power  Messaging:    PracKcality   Overall  PracKcality  of  Power  Messaging:    “Overall,  how  PRACTICAL  are  the  Power  Messaging   tools  and  messages  to  you  in  your  role?”   ©  2011  Beyond  ROI,  Inc.  •    www.getBeyondROI.com   Page  30    
  • 31. Industries  we’ve  gonen  to  know:     high-­‐tech     transporta=on     telecom     insurance       financial  and  business  services     media     energy  and  petrochemical     commercial  real  estate     manufacturing     M&A,  venture  capital     consumer  packaged  goods     churches,  schools,  and  prisons     pharmaceu=cals       medical  equipment   ©  2011  Beyond  ROI,  Inc.  •    www.getBeyondROI.com   Page  31