Location via proxy:   [ UP ]  
[Report a bug]   [Manage cookies]                
SlideShare a Scribd company logo
Bank of America
Third Quarter 2008 Results

Ken Lewis
Chairman, CEO and President

Joe Price
Chief Financial Officer

October 6, 2008
Forward Looking Statements
    This press release contains forward-looking statements, including statements about the
    financial conditions, results of operations and earnings outlook of Bank of America
    Corporation. The forward-looking statements involve certain risks and uncertainties. Factors
    that may cause actual results or earnings to differ materially from such forward-looking
    statements include, among others, the following: 1) projected business increases following
    process changes and other investments are lower than expected; 2) competitive pressure
    among financial services companies increases significantly; 3) general economic conditions
    are less favorable than expected; 4) political conditions including the threat of future terrorist
    activity and related actions by the United States abroad may adversely affect the company’s
    businesses and economic conditions as a whole; 5) changes in the interest rate environment
    and market liquidity reduce interest margins, impact funding sources and effect the ability to
    originate and distribute financial products in the primary and secondary markets; 6) changes in
    foreign exchange rates increases exposure; 7) changes in market rates and prices may
    adversely impact the value of financial products; 8) legislation or regulatory environments,
    requirements or changes adversely affect the businesses in which the company is engaged; 9)
    changes in accounting standards, rules or interpretations; 10) litigation liabilities, including
    costs, expenses, settlements and judgments, may adversely affect the company or its
    businesses; 11) mergers and acquisitions and their integration into the company; and 12)
    decisions to downsize, sell or close units or otherwise change the business mix of any of the
    company. Accordingly, readers are cautioned not to place undue reliance on forward-looking
    statements, which speak only as of the date on which they are made. Bank of America does not
    undertake to update forward-looking statements to reflect the impact of circumstances or
    events that arise after the date the forward-looking statements are made. For further
    information regarding Bank of America Corporation, please read the Bank of America reports
    filed with the SEC and available at www.sec.gov.

2
Important Presentation Format Information


    • Certain prior period amounts have been reclassified to conform
      to current period presentation


3
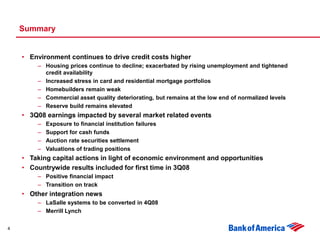
Summary


    • Environment continues to drive credit costs higher
        – Housing prices continue to decline; exacerbated by rising unemployment and tightened
          credit availability
        – Increased stress in card and residential mortgage portfolios
        – Homebuilders remain weak
        – Commercial asset quality deteriorating, but remains at the low end of normalized levels
        – Reserve build remains elevated
    • 3Q08 earnings impacted by several market related events
        –   Exposure to financial institution failures
        –   Support for cash funds
        –   Auction rate securities settlement
        –   Valuations of trading positions
    • Taking capital actions in light of economic environment and opportunities
    • Countrywide results included for first time in 3Q08
        – Positive financial impact
        – Transition on track
    • Other integration news
        – LaSalle systems to be converted in 4Q08
        – Merrill Lynch

4
Consolidated Highlights


         ($ in millions)                                                                                     Increase (decrease) over
                                                                                       3Q08                  3Q07              2Q08
         Net interest income (FTE)                                                   $  11,920             $     2,928      $        983
         Noninterest income                                                              7,979                     499            (1,810)
            Total revenue, net of interest expense (FTE)                                19,899                   3,427              (827)
         Provision for credit losses                                                     6,450                   4,420               620
         Noninterest expense                                                            11,660                   2,949             2,001
            Pre-tax income                                                               1,789                  (3,942)           (3,448)
         Income tax expense (FTE)                                                          612                  (1,421)           (1,215)
            Net income                                                               $   1,177             $    (2,521)     $     (2,233)

         Preferred dividends                                                         $          473   $               430      $     287
         Diluted EPS                                                                           0.15                 (0.67)         (0.57)
         After tax effect of merger charge                                                      183                   130             49
         Return on common equity 1                                                             2.48 %                (870) bps      (715) bps
         Tangible return on equity 1                                                           6.40                   N/M            N/M


     1   Measures shown on an operating basis. Please refer to the Supplemental Information Package for more information.


5
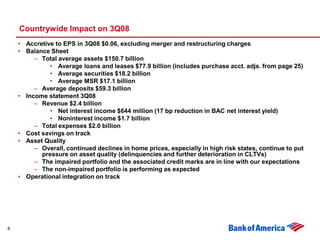
Countrywide Impact on 3Q08
    • Accretive to EPS in 3Q08 $0.06, excluding merger and restructuring charges
    • Balance Sheet
         – Total average assets $150.7 billion
              • Average loans and leases $77.9 billion (includes purchase acct. adjs. from page 25)
              • Average securities $18.2 billion
              • Average MSR $17.1 billion
         – Average deposits $59.3 billion
    • Income statement 3Q08
         – Revenue $2.4 billion
              • Net interest income $644 million (17 bp reduction in BAC net interest yield)
              • Noninterest income $1.7 billion
         – Total expenses $2.0 billion
    • Cost savings on track
    • Asset Quality
         – Overall, continued declines in home prices, especially in high risk states, continue to put
           pressure on asset quality (delinquencies and further deterioration in CLTVs)
         – The impaired portfolio and the associated credit marks are in line with our expectations
         – The non-impaired portfolio is performing as expected
    • Operational integration on track


6
Integration Commentary

    LaSalle
    • Deployed Bank of America teller platform in LaSalle Banking Centers
    • Customer notification and associate training well underway in preparation for 4Q08 systems
      conversions


    Merrill Lynch
    • Expected EPS impact of combination
        – 3% dilutive in 2009
        – Breakeven in 2010
    • Expected cost saves of $7 billion achieved by combination
        – Headcount reductions, vendor leverage and real estate rationalization
        – Offset by incremental intangibles amortization of $450 million
        – 10% of combined business base
        – Over 20% realized in 2009
        – Fully realized in 2012
    • Merger and restructuring charges of $2.0 billion after tax
        – One time costs of merger execution
        – Personnel, project costs and contract terminations


7
Summary

     • Environment is challenged as market disruptions, housing and consumer weakness
       are clearly having broader economic effects
     • Gaining share in key products
     • Capitalizing on opportunities in the weakened environment
     • Balance sheet
         – Actions will strengthen capital position
         – Deposit flows and deleveraging strengthening liquidity
         – Increased credit reserves


8
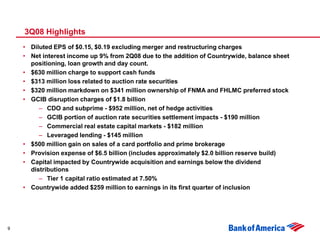
3Q08 Highlights
    • Diluted EPS of $0.15, $0.19 excluding merger and restructuring charges
    • Net interest income up 9% from 2Q08 due to the addition of Countrywide, balance sheet
      positioning, loan growth and day count.
    • $630 million charge to support cash funds
    • $313 million loss related to auction rate securities
    • $320 million markdown on $341 million ownership of FNMA and FHLMC preferred stock
    • GCIB disruption charges of $1.8 billion
         – CDO and subprime - $952 million, net of hedge activities
         – GCIB portion of auction rate securities settlement impacts - $190 million
         – Commercial real estate capital markets - $182 million
         – Leveraged lending - $145 million
    • $500 million gain on sales of a card portfolio and prime brokerage
    • Provision expense of $6.5 billion (includes approximately $2.0 billion reserve build)
    • Capital impacted by Countrywide acquisition and earnings below the dividend
      distributions
         – Tier 1 capital ratio estimated at 7.50%
    • Countrywide added $259 million to earnings in its first quarter of inclusion


9
3Q08 Business Highlights
     Global Consumer & Small Business
     • Total growth in average retail deposits of $47 billion versus 2Q08
           – Excluding Countrywide addition, average deposits grew $8 billion reflecting flight to safety (period end
              deposits up $21 billion)
           – 1.8 million net new checking and savings accounts opened in 3Q08
     • Service charges grew on increased deposit accounts
     • Debit card income down slightly from 2Q08 on lower volume
           – Economic pressure affecting consumer spending
           – 2Q08 post –tax stimulus
           – Storm activity and fuel shortages
     • Consumer Real Estate
           – Consolidated first mortgage production was $51.5 billion
                 – Historically heavy refi mix driving reduction in volumes
           – Mortgage banking income increased $1.2 billion due to the addition of Countrywide
           – MSRs at $20.8 billion (added $16.8 billion from Countrywide) represent 1.26% of portfolio
           – Loan modifications for 3Q08 for the combined companies were over 73,000, up from 14,000 in 3Q07
     • Credit card losses were higher impacting provision and securitization residual
           – Loans were flat with 2Q08 reflecting tightened credit availability
           – Net loss rate increased to 6.40% from 5.96%


10
3Q08 Business Highlights
     Global Corporate & Investment Banking
     • Average commercial deposits increased $5 billion vs. 2Q08 as customers sought strength
     • Sale of prime brokerage reduced assets by $40 billion
     • Trading risk positions reduced
     • Excluding prime brokerage and securitization of auto loans, average loans grew $6.2 billion,
       or 2% from 2Q08
     • Sales and trading reflect typical 3Q08 seasonality as well as valuations


     Global Wealth & Investment Management
     • Average deposits increased $3.9 billion to $161.0 billion vs. 2Q08 as customers continued
       their flight to safety
     • Average loans grew $0.7 billion to $88.3 billion vs. 2Q08
     • Lower quarterly results driven by cash funds support, auction rate securities settlement
       and the impact of lower equity markets


11
Balance Sheet Movements versus 2Q08

     •   Assets climbed $114.3 billion to $1.8 trillion at 9/30/08
            – Countrywide added $164.4 billion
            – Excluding impact of Countrywide:
                    Loans decreased $6.9 billion
                           Commercial loans decreased $3.6 billion driven by the sale of prime brokerage
                           Consumer loans decreased $3.3 billion driven by residential mortgage and
                            securitization of auto loans
                    Market related earning assets are down $45 billion as we continue to maximize the
                     efficiency of the book, primarily through the divestiture of the prime brokerage
     •   Liabilities
            – Countrywide added $140.4 billion
            – Excluding impact of Countrywide:
                    Total retail deposits increased $21.0 billion as we experienced flight to safety
                    Long term debt decreased $12.6 billion primarily due to maturities of $11.5 billion which
                     were offset by minimal issuances of $3.5 billion.
                    Short-term borrowing decreased $37.9 billion due to a decline in customer short
                     positions, a shift into other products and the prime brokerage sale
     •   Equity remained relatively flat, as common stock issuances related to the Countrywide acquisition
         and net income were offset by dividends and a decrease in OCI
                    OCI decreased $3.8 billion due to fair value adjustments related to our strategic equity
                     investments and higher unrealized losses on securities


12
Net Interest Income

        ($ in millions)
                                                                  3Q08                2Q08             $ Change
        Reported net interest income (FTE)                    $     11,920       $      10,937       $       983
        Market-based NII                                             (1,448)             (1,369)              (79)
          Core net interest income (FTE)                            10,472                9,568              904
        Impact of securitizations                                     2,310               2,254                56
          Core NII – Managed Basis                            $     12,782       $      11,822       $       960

        Average earning assets                                $   1,622,466      $   1,500,234       $    122,232
        Market-based earning assets                                (377,630)          (375,274)             (2,356)
        Impact of securitizations                                   101,743            103,131              (1,388)

        Reported net interest yield                                    2.93 %              2.92 %                 1 bps
        Core net interest yield                                        3.36                3.41                  (5)
          Core net interest yield – Managed Basis                      3.79                3.86                  (7)

     • Change in core net interest income – managed basis driven by:
            Countrywide impact of $644 million

            Balance sheet positioning, loan growth and day count impact roughly $300 million

      Absent the negative impact from the addition of Countrywide (17 bps), core net interest yield expanded due to the
      factors mentioned above.


13
Capital Markets 3Q Revenue

      • Includes $1.8 billion of disruption charges in 3Q08 vs. $1.2 billion in 2Q08
     ($ in millions)                                                                       3Q08
                                                             Total                    Sales & Trading             Investment Banking
     Liquid Products                              $                    1,067      $                1,063      $                     4
     Credit Products                                                      81                        (151)                         232
     Structured Products                                              (1,213)                     (1,329)                         116
     Equities                                                            225                         175                           50
     Other                                                                89                         -                             89
        Total                                     $                      249      $                 (242)     $                   491


                                                                                Change in revenue from 2Q08
                                                             Total                   Sales & Trading              Investment Banking
     Liquid Products                              $                      (37)     $                  (39)     $                     2
     Credit Products                                                  (1,052)                       (834)                        (218)
     Structured Products                                                (413)                       (407)                          (6)
     Equities                                                           (183)                       (123)                         (60)
     Other                                                                 7                         -                              7
        Total                                     $                   (1,678)     $               (1,403)     $                  (275)


      • Excludes $23 million and $25 million margin from FVO loan book for 3Q08 and 2Q08


14
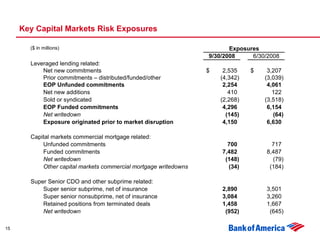
Key Capital Markets Risk Exposures

       ($ in millions)                                                   Exposures
                                                                  9/30/2008     6/30/2008
       Leveraged lending related:
           Net new commitments                                    $    2,535    $    3,207
           Prior commitments – distributed/funded/other               (4,342)       (3,039)
           EOP Unfunded commitments                                    2,254         4,061
           Net new additions                                             410           122
           Sold or syndicated                                         (2,268)       (3,518)
           EOP Funded commitments                                      4,296         6,154
           Net writedown                                                (145)          (64)
           Exposure originated prior to market disruption              4,150         6,630

       Capital markets commercial mortgage related:
           Unfunded commitments                                         700           717
           Funded commitments                                         7,482         8,487
           Net writedown                                               (148)          (79)
           Other capital markets commercial mortgage writedowns         (34)         (184)

       Super Senior CDO and other subprime related:
           Super senior subprime, net of insurance                    2,890         3,501
           Super senior nonsubprime, net of insurance                 3,084         3,260
           Retained positions from terminated deals                   1,458         1,667
           Net writedown                                               (952)         (645)

15
Subprime Super Senior CDO Exposure Carrying Values 1
(Dollars in millions)
                                                                                                                                   September 30, 2008
                                                                                                                                                             Vintage of Subprime Collateral

                                                                                                              Carrying Value as
                                                                                                                a Percent of            Subprime            Percent in          Percent in
                                                                                             Subprime Net       Original Net            Content of          2006/2007           2005/prior
                                                                                               Exposure           Exposure             Collateral 2          Vintages            Vintages
 Super senior liquidity commitments
       High grade                                                                                      $-                      - %                    - %                - %                   -%
       Mezzanine                                                                                      337                    93                  42                 46                        54
       CDO-squared                                                                                        -                    -                      -                  -                     -
        Total super senior liquidity commitments                                                      337                    93

Other super senior exposure
       High grade                                                                                     942                    66                  56                 14                        86
       Mezzanine                                                                                      179                    18                  73                 69                        31
       CDO-squared                                                                                  1,432                    28                  23                 71                        29
        Total other super senior                                                                    2,553                    34
        Total super senior                                                                         $2,890                    37
Purchased securities from liquidated CDOs                                                          $1,458                    48                  51                 38                        62
         Total                                                                                     $4,348                    40

1
    Classified as subprime when subprime consumer real estate loans make up at least 35 percent of the ultimate underlying collateral's original net exposure value.
2
    Based on current net exposure value.


16
Asset Quality
     •   Sustained stress in the housing/financial markets and other economic pressures including high food and
         fuel costs drove consumer losses higher. Rising unemployment levels now impacting losses as well. Loss
         rates impacted by slower loan growth from tightened underwriting.
     •   Held net charge-offs increased to 1.84%, up 17 basis points from 2Q08 (up 34 bps excluding Countrywide)
     •   Provision expense of $6.5 billion includes approximately $2 billion reserve build
          –   Consumer stress from housing, unemployment and tighter credit conditions
                   $700 million in unsecured lending
                   $600 million consumer credit card
                   $350 million residential mortgage
                   $100 million dealer financial services
          –   Commercial reserves built by roughly $250 million
     •   Allowance for loan and lease losses of $20.3 billion covering 2.17% of loans up 19 bps from 2Q08 (2.23%
         coverage excluding Countrywide loans)
     •   Consumer card losses trended higher
          –   Managed consumer credit card net loss rate increased to 6.40% from 5.96% in 2Q08. 30+ day
              delinquencies increased to 5.89% from 5.53% in 2Q08. 90+ day delinquencies increased to 2.88% from
              2.82% in 2Q08.
     •   Small business net charge-off ratio increased 105 basis points to 10.64%.
     •   Commercial net charge-off ratio excluding small business increased 26 bps to 0.54%.
          –   Excluding small business and commercial real estate, net charge-off ratio increased 14 bps to 0.27%


17
Consumer Asset Quality Key Indicators
 ($ in millions)

                                           Residential Mortgage                                 Home Equity                            Discontinued Real Estate
                                            3Q08                      2Q08                    3Q08                  2Q08                  3Q08                     2Q08

                                              Excluding the                                     Excluding the                                   Excluding the
                                                Purchase                                          Purchase                                        Purchase
                                  As           Accounting           As               As          Accounting       As                             Accounting         As
                                Reported         impact 1         Reported         Reported        impact 1     Reported      As Reported          impact 1       Reported

 Loans EOP                      $256,989       $   259,332        $235,472         $151,938     $    155,438    $121,409     $       22,081     $     27,276           N/A
 Loans Avg                       260,748           263,228         256,164          151,142          154,909     120,265             22,031           27,610           N/A

 Net losses                     $    242   $            525   $          151   $        964   $        1,732   $       923   $           (3)   $         940           N/A
 % of avg loans                     0.37 %             0.79 %           0.24 %         2.53 %           4.45 %        3.09 %          (0.05) %         13.55 %         N/A

 Allowance for loan losses      $   1,376               N/A       $      792   $      4,744              N/A    $    3,812   $           82              N/A           N/A
 % of Loans                          0.54 %             N/A             0.34 %         3.12 %            N/A          3.14 %           0.37 %            N/A           N/A

 Avg. refreshed (C)LTV 2              69                N/A              65             82               N/A           78    Not Available               N/A           N/A

 90%+ refreshed (C)LTV 2              20 %              N/A              16 %           37 %             N/A           35 % Not Available                N/A           N/A

 Avg. refreshed FICO 2               732                N/A             733            716               N/A          716    Not Available               N/A           N/A

 % below 620 FICO 2                    7 %              N/A                  6 %        10 %             N/A           10 % Not Available                N/A           N/A


     1 The purchase accounting impacts on loans are the fair value adjustments related to the impaired and non-impaired acquired portfolios. Loan
       balances have been reduced by the charge-offs that would have occurred during the quarter had purchase accounting not been applied at
       acquisition.
     2 All   data is Legacy BAC only. Residential mortgage data as of August 2008.


18
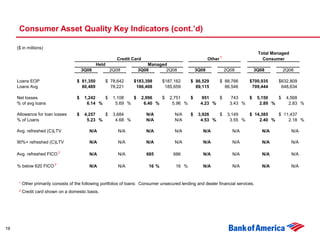
Consumer Asset Quality Key Indicators (cont.’d)

     ($ in millions)
                                                                                                                                     Total Managed
                                                             Credit Card                                    Other 1                    Consumer
                                                 Held                      Managed
                                          3Q08           2Q08          3Q08       2Q08               3Q08             2Q08         3Q08          2Q08

     Loans EOP                        $ 81,350          $ 78,642     $183,398       $187,162     $ 86,529         $ 88,766     $700,935      $632,809
     Loans Avg                          80,489            78,221      186,408        185,659       89,115           86,546      709,444       648,634

     Net losses                       $    1,242   $       1,108   $       2,996   $   2,751   $        951   $          743   $     5,150   $    4,568
     % of avg loans                         6.14 %          5.69 %          6.40 %      5.96 %         4.23 %           3.43 %        2.89 %       2.83 %

     Allowance for loan losses        $    4,257   $       3,684            N/A          N/A     $    3,926   $        3,149   $ 14,385   $ 11,437
     % of Loans                             5.23 %          4.68 %          N/A          N/A           4.53 %           3.55 %     2.40 %     2.18 %

     Avg. refreshed (C)LTV                   N/A             N/A            N/A          N/A            N/A              N/A          N/A            N/A

     90%+ refreshed (C)LTV                   N/A             N/A            N/A          N/A            N/A              N/A          N/A            N/A

     Avg. refreshed FICO 2                   N/A             N/A            685         686             N/A              N/A          N/A            N/A

     % below 620 FICO 2                      N/A             N/A             16 %        16 %           N/A              N/A          N/A            N/A


      1   Other primarily consists of the following portfolios of loans: Consumer unsecured lending and dealer financial services.
      2   Credit card shown on a domestic basis.


19
Consumer Asset Quality Key Indicators – Excluding Countrywide
($ in millions)
                                                                                                                                                                                 Total Managed
                               Residential Mortgage               Home Equity                               Credit Card                                  Other 1                   Consumer
                                                                                                   Held                   Managed
                                   3Q08          2Q08          3Q08          2Q08           3Q08          2Q08         3Q08     2Q08              3Q08             2Q08         3Q08         2Q08

Loans EOP                      $230,203         $235,472      $122,869    $121,409      $ 81,350      $ 78,642       $183,398    $187,162     $ 86,559         $ 88,766     $623,029     $632,809
Loans Avg                       234,004          256,164       121,945     120,265        80,489        78,221        186,408     185,659       89,272           86,546      631,629      648,634

Net losses                     $      242   $        151   $       966   $       923   $     1,242   $     1,108   $    2,996   $   2,751   $        951       $      743   $    5,155   $    4,568
% of avg loans                       0.41 %         0.24 %        3.15 %        3.09 %        6.14 %        5.69 %       6.40 %      5.96 %         4.23             3.43 %       3.25 %       2.83 %

90+ Performing DPD 2           $      268   $        278           N/A           N/A    $    2,330   $     2,109   $    5,288   $   5,278   $      1,116   $        1,000   $    6,672   $    6,557
 % of Loans                          0.12 %         0.12 %         N/A           N/A          2.87 %        2.68 %       2.88 %      2.82 %         1.29 %           1.13 %       1.07 %       1.04 %

Nonperforming loans            $    4,445   $      3,269   $     2,022   $    1,851            N/A           N/A          N/A         N/A     $      102   $          100   $    6,569   $    5,220
% of Loans                           1.93 %         1.39 %        1.65 %       1.52 %          N/A           N/A          N/A         N/A           0.12 %           0.11 %       1.05 %       0.82 %

Allowance for loan losses      $    1,163   $        792   $     3,854   $    3,812   $      4,257   $     3,684          N/A         N/A     $    3,926   $        3,149   $ 13,200   $ 11,437
% of Loans                           0.51 %         0.34 %        3.14 %       3.14 %         5.23 %        4.68 %        N/A         N/A           4.53 %           3.55 %     2.53 %     2.18 %

Avg. refreshed (C)LTV 4               69             65            82            78            N/A           N/A          N/A         N/A            N/A              N/A          N/A           N/A

90%+ refreshed (C)LTV 4               20 %           16 %          37 %          35 %          N/A           N/A          N/A         N/A            N/A              N/A          N/A           N/A

Avg. refreshed FICO 3, 4             732            733           716           716            N/A           N/A          685         686            N/A              N/A          N/A           N/A

% below 620 FICO 3, 4                     7 %           6 %        10 %          10 %          N/A           N/A          16 %         16 %          N/A              N/A          N/A           N/A


         1 Other    primarily consists of the following portfolios of loans: Consumer unsecured lending and dealer financial services.
         2   Includes loans delinquent more than 90 days and still accruing interest.
         3 Credit   card shown on a domestic basis.
         4 Residential     mortgage data as of August 2008.


20
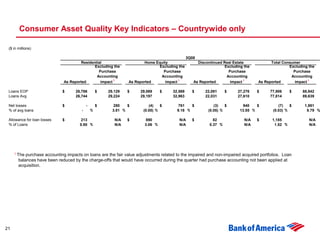
Consumer Asset Quality Key Indicators – Countrywide only

 ($ in millions)

                                                                                              3Q08
                                     Residential                       Home Equity                 Discontinued Real Estate            Total Consumer
                                            Excluding the                     Excluding the                      Excluding the                  Excluding the
                                              Purchase                          Purchase                           Purchase                       Purchase
                                             Accounting                        Accounting                         Accounting                     Accounting
                             As Reported       impact 1         As Reported      impact 1        As Reported        impact 1     As Reported       impact 1

 Loans EOP                   $     26,786          $   29,129   $    29,069     $    32,569     $      22,081     $    27,276    $    77,906      $    88,942
 Loans Avg                         26,744              29,224        29,197          32,963            22,031          27,610         77,814           89,639

 Net losses                  $             -       $      280   $         (4)   $       761   $            (3)   $         940   $         (7)   $      1,981
 % of avg loans                        -       %         3.81 %        (0.05) %        9.18 %           (0.05) %         13.55 %        (0.03) %         8.79 %

 Allowance for loan losses   $         213                N/A   $       890             N/A     $          82              N/A   $      1,185             N/A
 % of Loans                           0.80 %              N/A          3.06 %           N/A              0.37 %            N/A           1.52 %           N/A


     1 The purchase accounting impacts on loans are the fair value adjustments related to the impaired and non-impaired acquired portfolios. Loan
       balances have been reduced by the charge-offs that would have occurred during the quarter had purchase accounting not been applied at
       acquisition.


21
Consumer Real Estate Asset Quality

      Home Equity
      •   Net charge-off ratio down 56 basis points from 2Q08 to 2.53% (up 6 bps excluding Countrywide)
           –   Loans with >90% CLTV represents 37% of portfolio (legacy BAC only)
           –   CA and FL represent 40% of the portfolio but 66% of losses.
      •   Allowance for loan losses was 3.12% of loans.


      Residential Mortgage
      •   Net charge-off ratio up 13 basis points from 2Q08 to 0.37% (up 17 bps excluding Countrywide)
           –   Net charge-offs were $242 million. Housing stressed states and the CRA portfolio drove a
               disproportionate share of losses.
           –   Loans with >90% CLTV represented 20% of the portfolio (legacy BAC only, August data).
           –   CA and FL represented 42% of the portfolio but 62% of losses (as of August).
      •   Allowance was increased and covers 0.54% of loans.


22
Consumer Real Estate (cont’d) and Other Consumer Lending Asset
     Quality
     Discontinued Real Estate
     •   Net recovery of 0.05% (impaired loans written down to fair value at acquisition date).
     •   Allowance for loan losses was 0.37% of loans.

     Consumer Credit Card – Managed Basis
     •   Net loss ratio climbed 44 basis points to 6.40%.
          –   Increase greater in geographies of housing stress

     •   Allowance was increased to cover 5.23% of held loans.

     •   30+ delinquencies increased 36 basis points to 5.89% of loans.

     •   90+ delinquencies increased 6 basis point to 2.88% of loans.


23
Commercial Asset Quality Key Indicators 1
 ($ in millions)

                                                                                                                  Commercial Lease
                                          Commercial 2       Commercial Real Estate       Small Business             Financing              Total Commercial
                                        3Q08       2Q08        3Q08        2Q08          3Q08        2Q08         3Q08        2Q08         3Q08        2Q08

 Loans EOP                          $232,824     $235,541    $ 63,736     $ 62,897    $ 19,430     $ 19,908    $ 22,416     $ 22,815   $338,406      $341,161
 Loans Avg                           233,508      227,603      63,013       62,640      19,715       20,008      22,585       22,276    338,821       332,527

 Net charge-offs                    $      163   $     75   $     262   $      136   $      527   $     477   $        8   $       6   $      960   $     694
 % of avg loans                           0.28 %     0.13 %      1.65 %       0.88 %      10.64 %      9.59 %       0.13 %      0.11 %       1.13 %      0.84 %

 90+ Performing DPD                 $      257   $    278   $     204   $      262   $      598   $     594   $       45   $      27   $    1,104   $   1,161
  % of Loans                              0.11 %     0.12 %      0.32 %       0.42 %       3.08 %      2.98 %       0.20 %      0.12 %       0.33 %      0.34 %

 Nonperforming loans                $    1,614   $   1,127   $   3,090   $   2,616   $      183   $     153   $       35   $      40   $    4,922   $   3,936
 % of Loans                               0.69 %      0.47 %      4.85 %      4.15 %       0.94 %      0.77 %       0.16 %      0.18 %       1.45 %      1.15 %

 Allowance for loan losses          $    2,179   $   2,083   $   1,376   $   1,333   $    2,196   $   2,078   $      210   $     199   $    5,961   $   5,693
  % of Loans                              0.94 %      0.87 %      2.16 %      2.12 %      11.30 %     10.44 %       0.94 %      0.87 %       1.76 %      1.67 %

 Criticized Utilized Exposure 3     $ 19,299   $ 15,616   $ 12,204   $ 10,776   $         1,203   $   1,060   $    1,131   $     870   $ 33,837   $ 28,322
 % of Total Exposure                    5.47 %     4.49 %    17.50 %    15.62 %            6.16 %      5.29 %       5.05 %      3.81 %     7.32 %     6.16 %


     • Homebuilder utilized balances at 9/30/08, included in commercial real estate, were flat compared to 2Q08 at $13 billion. These utilized
       balances are included in total binding exposure which was $18 billion.
                   –   Criticized utilized exposure increased $769 million to $8.3 billion (64% of utilized exposure)
                   –   NPAs rose $520 million to $2.7 billion
                   –   3Q08 charge-offs were $222 million compared to $130 million in 2Q08

      1   Does not include certain commercial loans measured at fair value in accordance with SFAS 159.
      2   Includes Commercial – Domestic and Commercial – Foreign.
      3   Excludes Assets Held for Sale.
24
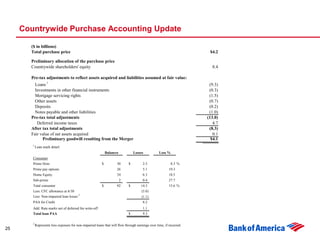
Countrywide Purchase Accounting Update

       ($ in billions)
       Total purchase price                                                                                            $4.2

       Preliminary allocation of the purchase price
       Countrywide shareholders' equity                                                                                 8.4

       Pre-tax adjustments to reflect assets acquired and liabilities assumed at fair value:
         Loans 1                                                                                                       (9.3)
         Investments in other financial instruments                                                                    (0.3)
         Mortgage servicing rights                                                                                     (1.5)
         Other assets                                                                                                  (0.7)
         Deposits                                                                                                      (0.2)
         Notes payable and other liabilities                                                                           (1.0)
       Pre-tax total adjustments                                                                                      (13.0)
          Deferred income taxes                                                                                          4.7
       After tax total adjustments                                                                                     (8.3)
       Fair value of net assets acquired                                                                                 0.1
             Preliminary goodwill resulting from the Merger                                                             $4.1
        1
            Loan mark detail:
                                                               Balances           Losses           Loss %
        Consumer
        Prime firsts                                       $          30      $        2.5                  8.3 %
        Prime pay options                                             26               5.1                19.3
        Home Equity                                                   34               6.3                18.5
        Sub-prime                                                         2            0.4                27.7
        Total consumer                                     $          92      $       14.3                15.6 %
        Less: CFC allowance at 6/30                                                    (5.0)
        Less: Non-impaired loan losses 2                                               (1.1)
        PAA for Credit                                                                 8.2
        Add: Rate marks net of deferred fee write-off                                  1.1
        Total loan PAA                                                        $        9.3

        2
            Represents loss exposure for non-impaired loans that will flow through earnings over time, if incurred.
25
Capital Actions to Strengthen Balance Sheet

     Announced intent to raise $10 billion in common equity
     • Allows us to capture near-term growth opportunities
     • Improves capital ratios                                Proforma w/ $10bb
                                                                 capital raise

        Capital Ratios                            3Q08              3Q08
        Tangible Total Ratio                       4.0%              4.6%
        Tangible Common Ratio                      2.6%              3.2%
        Leverage Ratio                             5.5%              6.0%
        Tier 1 Capital                             7.5%              8.3%
        Total Capital                             11.5%             12.3%


     Announced 50% reduction in common dividend to $.32 quarterly
     • Reduces capital committed by roughly $6 billion annually
     • Adds roughly 11 bps quarterly


26
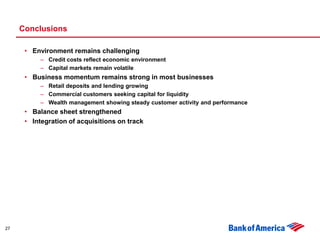
Conclusions

      • Environment remains challenging
           – Credit costs reflect economic environment
           – Capital markets remain volatile
      • Business momentum remains strong in most businesses
           – Retail deposits and lending growing
           – Commercial customers seeking capital for liquidity
           – Wealth management showing steady customer activity and performance
      • Balance sheet strengthened
      • Integration of acquisitions on track


27
Appendix


28
Net Interest Income – Managed Sensitivity


     ($ in millions)                              Managed net interest income impact for next 12 months
                                                   @ 9/30/08                                @ 6/30/08
     Forward curve interest rate scenarios
     +100 bp parallel shift                   $              (775)                    $            (1,189)
     - 100 bp parallel shift                                  558                                   1,113

     Flattening scenario from forward curve
     + 100 bp flattening on short end                        (927)                                 (1,283)
     - 100 bp flattening on long end                         (403)                                   (234)

     Steepening scenario from forward curve
     + 100 bp steepening on long end                          156                                      93
     - 100 bp steepening on short end                         970                                   1,350


29
30
31
Third Quarter 2008 Earnings Presentation

More Related Content

Third Quarter 2008 Earnings Presentation

  • 1. Bank of America Third Quarter 2008 Results Ken Lewis Chairman, CEO and President Joe Price Chief Financial Officer October 6, 2008
  • 2. Forward Looking Statements This press release contains forward-looking statements, including statements about the financial conditions, results of operations and earnings outlook of Bank of America Corporation. The forward-looking statements involve certain risks and uncertainties. Factors that may cause actual results or earnings to differ materially from such forward-looking statements include, among others, the following: 1) projected business increases following process changes and other investments are lower than expected; 2) competitive pressure among financial services companies increases significantly; 3) general economic conditions are less favorable than expected; 4) political conditions including the threat of future terrorist activity and related actions by the United States abroad may adversely affect the company’s businesses and economic conditions as a whole; 5) changes in the interest rate environment and market liquidity reduce interest margins, impact funding sources and effect the ability to originate and distribute financial products in the primary and secondary markets; 6) changes in foreign exchange rates increases exposure; 7) changes in market rates and prices may adversely impact the value of financial products; 8) legislation or regulatory environments, requirements or changes adversely affect the businesses in which the company is engaged; 9) changes in accounting standards, rules or interpretations; 10) litigation liabilities, including costs, expenses, settlements and judgments, may adversely affect the company or its businesses; 11) mergers and acquisitions and their integration into the company; and 12) decisions to downsize, sell or close units or otherwise change the business mix of any of the company. Accordingly, readers are cautioned not to place undue reliance on forward-looking statements, which speak only as of the date on which they are made. Bank of America does not undertake to update forward-looking statements to reflect the impact of circumstances or events that arise after the date the forward-looking statements are made. For further information regarding Bank of America Corporation, please read the Bank of America reports filed with the SEC and available at www.sec.gov. 2
  • 3. Important Presentation Format Information • Certain prior period amounts have been reclassified to conform to current period presentation 3
  • 4. Summary • Environment continues to drive credit costs higher – Housing prices continue to decline; exacerbated by rising unemployment and tightened credit availability – Increased stress in card and residential mortgage portfolios – Homebuilders remain weak – Commercial asset quality deteriorating, but remains at the low end of normalized levels – Reserve build remains elevated • 3Q08 earnings impacted by several market related events – Exposure to financial institution failures – Support for cash funds – Auction rate securities settlement – Valuations of trading positions • Taking capital actions in light of economic environment and opportunities • Countrywide results included for first time in 3Q08 – Positive financial impact – Transition on track • Other integration news – LaSalle systems to be converted in 4Q08 – Merrill Lynch 4
  • 5. Consolidated Highlights ($ in millions) Increase (decrease) over 3Q08 3Q07 2Q08 Net interest income (FTE) $ 11,920 $ 2,928 $ 983 Noninterest income 7,979 499 (1,810) Total revenue, net of interest expense (FTE) 19,899 3,427 (827) Provision for credit losses 6,450 4,420 620 Noninterest expense 11,660 2,949 2,001 Pre-tax income 1,789 (3,942) (3,448) Income tax expense (FTE) 612 (1,421) (1,215) Net income $ 1,177 $ (2,521) $ (2,233) Preferred dividends $ 473 $ 430 $ 287 Diluted EPS 0.15 (0.67) (0.57) After tax effect of merger charge 183 130 49 Return on common equity 1 2.48 % (870) bps (715) bps Tangible return on equity 1 6.40 N/M N/M 1 Measures shown on an operating basis. Please refer to the Supplemental Information Package for more information. 5
  • 6. Countrywide Impact on 3Q08 • Accretive to EPS in 3Q08 $0.06, excluding merger and restructuring charges • Balance Sheet – Total average assets $150.7 billion • Average loans and leases $77.9 billion (includes purchase acct. adjs. from page 25) • Average securities $18.2 billion • Average MSR $17.1 billion – Average deposits $59.3 billion • Income statement 3Q08 – Revenue $2.4 billion • Net interest income $644 million (17 bp reduction in BAC net interest yield) • Noninterest income $1.7 billion – Total expenses $2.0 billion • Cost savings on track • Asset Quality – Overall, continued declines in home prices, especially in high risk states, continue to put pressure on asset quality (delinquencies and further deterioration in CLTVs) – The impaired portfolio and the associated credit marks are in line with our expectations – The non-impaired portfolio is performing as expected • Operational integration on track 6
  • 7. Integration Commentary LaSalle • Deployed Bank of America teller platform in LaSalle Banking Centers • Customer notification and associate training well underway in preparation for 4Q08 systems conversions Merrill Lynch • Expected EPS impact of combination – 3% dilutive in 2009 – Breakeven in 2010 • Expected cost saves of $7 billion achieved by combination – Headcount reductions, vendor leverage and real estate rationalization – Offset by incremental intangibles amortization of $450 million – 10% of combined business base – Over 20% realized in 2009 – Fully realized in 2012 • Merger and restructuring charges of $2.0 billion after tax – One time costs of merger execution – Personnel, project costs and contract terminations 7
  • 8. Summary • Environment is challenged as market disruptions, housing and consumer weakness are clearly having broader economic effects • Gaining share in key products • Capitalizing on opportunities in the weakened environment • Balance sheet – Actions will strengthen capital position – Deposit flows and deleveraging strengthening liquidity – Increased credit reserves 8
  • 9. 3Q08 Highlights • Diluted EPS of $0.15, $0.19 excluding merger and restructuring charges • Net interest income up 9% from 2Q08 due to the addition of Countrywide, balance sheet positioning, loan growth and day count. • $630 million charge to support cash funds • $313 million loss related to auction rate securities • $320 million markdown on $341 million ownership of FNMA and FHLMC preferred stock • GCIB disruption charges of $1.8 billion – CDO and subprime - $952 million, net of hedge activities – GCIB portion of auction rate securities settlement impacts - $190 million – Commercial real estate capital markets - $182 million – Leveraged lending - $145 million • $500 million gain on sales of a card portfolio and prime brokerage • Provision expense of $6.5 billion (includes approximately $2.0 billion reserve build) • Capital impacted by Countrywide acquisition and earnings below the dividend distributions – Tier 1 capital ratio estimated at 7.50% • Countrywide added $259 million to earnings in its first quarter of inclusion 9
  • 10. 3Q08 Business Highlights Global Consumer & Small Business • Total growth in average retail deposits of $47 billion versus 2Q08 – Excluding Countrywide addition, average deposits grew $8 billion reflecting flight to safety (period end deposits up $21 billion) – 1.8 million net new checking and savings accounts opened in 3Q08 • Service charges grew on increased deposit accounts • Debit card income down slightly from 2Q08 on lower volume – Economic pressure affecting consumer spending – 2Q08 post –tax stimulus – Storm activity and fuel shortages • Consumer Real Estate – Consolidated first mortgage production was $51.5 billion – Historically heavy refi mix driving reduction in volumes – Mortgage banking income increased $1.2 billion due to the addition of Countrywide – MSRs at $20.8 billion (added $16.8 billion from Countrywide) represent 1.26% of portfolio – Loan modifications for 3Q08 for the combined companies were over 73,000, up from 14,000 in 3Q07 • Credit card losses were higher impacting provision and securitization residual – Loans were flat with 2Q08 reflecting tightened credit availability – Net loss rate increased to 6.40% from 5.96% 10
  • 11. 3Q08 Business Highlights Global Corporate & Investment Banking • Average commercial deposits increased $5 billion vs. 2Q08 as customers sought strength • Sale of prime brokerage reduced assets by $40 billion • Trading risk positions reduced • Excluding prime brokerage and securitization of auto loans, average loans grew $6.2 billion, or 2% from 2Q08 • Sales and trading reflect typical 3Q08 seasonality as well as valuations Global Wealth & Investment Management • Average deposits increased $3.9 billion to $161.0 billion vs. 2Q08 as customers continued their flight to safety • Average loans grew $0.7 billion to $88.3 billion vs. 2Q08 • Lower quarterly results driven by cash funds support, auction rate securities settlement and the impact of lower equity markets 11
  • 12. Balance Sheet Movements versus 2Q08 • Assets climbed $114.3 billion to $1.8 trillion at 9/30/08 – Countrywide added $164.4 billion – Excluding impact of Countrywide:  Loans decreased $6.9 billion  Commercial loans decreased $3.6 billion driven by the sale of prime brokerage  Consumer loans decreased $3.3 billion driven by residential mortgage and securitization of auto loans  Market related earning assets are down $45 billion as we continue to maximize the efficiency of the book, primarily through the divestiture of the prime brokerage • Liabilities – Countrywide added $140.4 billion – Excluding impact of Countrywide:  Total retail deposits increased $21.0 billion as we experienced flight to safety  Long term debt decreased $12.6 billion primarily due to maturities of $11.5 billion which were offset by minimal issuances of $3.5 billion.  Short-term borrowing decreased $37.9 billion due to a decline in customer short positions, a shift into other products and the prime brokerage sale • Equity remained relatively flat, as common stock issuances related to the Countrywide acquisition and net income were offset by dividends and a decrease in OCI  OCI decreased $3.8 billion due to fair value adjustments related to our strategic equity investments and higher unrealized losses on securities 12
  • 13. Net Interest Income ($ in millions) 3Q08 2Q08 $ Change Reported net interest income (FTE) $ 11,920 $ 10,937 $ 983 Market-based NII (1,448) (1,369) (79) Core net interest income (FTE) 10,472 9,568 904 Impact of securitizations 2,310 2,254 56 Core NII – Managed Basis $ 12,782 $ 11,822 $ 960 Average earning assets $ 1,622,466 $ 1,500,234 $ 122,232 Market-based earning assets (377,630) (375,274) (2,356) Impact of securitizations 101,743 103,131 (1,388) Reported net interest yield 2.93 % 2.92 % 1 bps Core net interest yield 3.36 3.41 (5) Core net interest yield – Managed Basis 3.79 3.86 (7) • Change in core net interest income – managed basis driven by:  Countrywide impact of $644 million  Balance sheet positioning, loan growth and day count impact roughly $300 million  Absent the negative impact from the addition of Countrywide (17 bps), core net interest yield expanded due to the factors mentioned above. 13
  • 14. Capital Markets 3Q Revenue • Includes $1.8 billion of disruption charges in 3Q08 vs. $1.2 billion in 2Q08 ($ in millions) 3Q08 Total Sales & Trading Investment Banking Liquid Products $ 1,067 $ 1,063 $ 4 Credit Products 81 (151) 232 Structured Products (1,213) (1,329) 116 Equities 225 175 50 Other 89 - 89 Total $ 249 $ (242) $ 491 Change in revenue from 2Q08 Total Sales & Trading Investment Banking Liquid Products $ (37) $ (39) $ 2 Credit Products (1,052) (834) (218) Structured Products (413) (407) (6) Equities (183) (123) (60) Other 7 - 7 Total $ (1,678) $ (1,403) $ (275) • Excludes $23 million and $25 million margin from FVO loan book for 3Q08 and 2Q08 14
  • 15. Key Capital Markets Risk Exposures ($ in millions) Exposures 9/30/2008 6/30/2008 Leveraged lending related: Net new commitments $ 2,535 $ 3,207 Prior commitments – distributed/funded/other (4,342) (3,039) EOP Unfunded commitments 2,254 4,061 Net new additions 410 122 Sold or syndicated (2,268) (3,518) EOP Funded commitments 4,296 6,154 Net writedown (145) (64) Exposure originated prior to market disruption 4,150 6,630 Capital markets commercial mortgage related: Unfunded commitments 700 717 Funded commitments 7,482 8,487 Net writedown (148) (79) Other capital markets commercial mortgage writedowns (34) (184) Super Senior CDO and other subprime related: Super senior subprime, net of insurance 2,890 3,501 Super senior nonsubprime, net of insurance 3,084 3,260 Retained positions from terminated deals 1,458 1,667 Net writedown (952) (645) 15
  • 16. Subprime Super Senior CDO Exposure Carrying Values 1 (Dollars in millions) September 30, 2008 Vintage of Subprime Collateral Carrying Value as a Percent of Subprime Percent in Percent in Subprime Net Original Net Content of 2006/2007 2005/prior Exposure Exposure Collateral 2 Vintages Vintages Super senior liquidity commitments High grade $- - % - % - % -% Mezzanine 337 93 42 46 54 CDO-squared - - - - - Total super senior liquidity commitments 337 93 Other super senior exposure High grade 942 66 56 14 86 Mezzanine 179 18 73 69 31 CDO-squared 1,432 28 23 71 29 Total other super senior 2,553 34 Total super senior $2,890 37 Purchased securities from liquidated CDOs $1,458 48 51 38 62 Total $4,348 40 1 Classified as subprime when subprime consumer real estate loans make up at least 35 percent of the ultimate underlying collateral's original net exposure value. 2 Based on current net exposure value. 16
  • 17. Asset Quality • Sustained stress in the housing/financial markets and other economic pressures including high food and fuel costs drove consumer losses higher. Rising unemployment levels now impacting losses as well. Loss rates impacted by slower loan growth from tightened underwriting. • Held net charge-offs increased to 1.84%, up 17 basis points from 2Q08 (up 34 bps excluding Countrywide) • Provision expense of $6.5 billion includes approximately $2 billion reserve build – Consumer stress from housing, unemployment and tighter credit conditions  $700 million in unsecured lending  $600 million consumer credit card  $350 million residential mortgage  $100 million dealer financial services – Commercial reserves built by roughly $250 million • Allowance for loan and lease losses of $20.3 billion covering 2.17% of loans up 19 bps from 2Q08 (2.23% coverage excluding Countrywide loans) • Consumer card losses trended higher – Managed consumer credit card net loss rate increased to 6.40% from 5.96% in 2Q08. 30+ day delinquencies increased to 5.89% from 5.53% in 2Q08. 90+ day delinquencies increased to 2.88% from 2.82% in 2Q08. • Small business net charge-off ratio increased 105 basis points to 10.64%. • Commercial net charge-off ratio excluding small business increased 26 bps to 0.54%. – Excluding small business and commercial real estate, net charge-off ratio increased 14 bps to 0.27% 17
  • 18. Consumer Asset Quality Key Indicators ($ in millions) Residential Mortgage Home Equity Discontinued Real Estate 3Q08 2Q08 3Q08 2Q08 3Q08 2Q08 Excluding the Excluding the Excluding the Purchase Purchase Purchase As Accounting As As Accounting As Accounting As Reported impact 1 Reported Reported impact 1 Reported As Reported impact 1 Reported Loans EOP $256,989 $ 259,332 $235,472 $151,938 $ 155,438 $121,409 $ 22,081 $ 27,276 N/A Loans Avg 260,748 263,228 256,164 151,142 154,909 120,265 22,031 27,610 N/A Net losses $ 242 $ 525 $ 151 $ 964 $ 1,732 $ 923 $ (3) $ 940 N/A % of avg loans 0.37 % 0.79 % 0.24 % 2.53 % 4.45 % 3.09 % (0.05) % 13.55 % N/A Allowance for loan losses $ 1,376 N/A $ 792 $ 4,744 N/A $ 3,812 $ 82 N/A N/A % of Loans 0.54 % N/A 0.34 % 3.12 % N/A 3.14 % 0.37 % N/A N/A Avg. refreshed (C)LTV 2 69 N/A 65 82 N/A 78 Not Available N/A N/A 90%+ refreshed (C)LTV 2 20 % N/A 16 % 37 % N/A 35 % Not Available N/A N/A Avg. refreshed FICO 2 732 N/A 733 716 N/A 716 Not Available N/A N/A % below 620 FICO 2 7 % N/A 6 % 10 % N/A 10 % Not Available N/A N/A 1 The purchase accounting impacts on loans are the fair value adjustments related to the impaired and non-impaired acquired portfolios. Loan balances have been reduced by the charge-offs that would have occurred during the quarter had purchase accounting not been applied at acquisition. 2 All data is Legacy BAC only. Residential mortgage data as of August 2008. 18
  • 19. Consumer Asset Quality Key Indicators (cont.’d) ($ in millions) Total Managed Credit Card Other 1 Consumer Held Managed 3Q08 2Q08 3Q08 2Q08 3Q08 2Q08 3Q08 2Q08 Loans EOP $ 81,350 $ 78,642 $183,398 $187,162 $ 86,529 $ 88,766 $700,935 $632,809 Loans Avg 80,489 78,221 186,408 185,659 89,115 86,546 709,444 648,634 Net losses $ 1,242 $ 1,108 $ 2,996 $ 2,751 $ 951 $ 743 $ 5,150 $ 4,568 % of avg loans 6.14 % 5.69 % 6.40 % 5.96 % 4.23 % 3.43 % 2.89 % 2.83 % Allowance for loan losses $ 4,257 $ 3,684 N/A N/A $ 3,926 $ 3,149 $ 14,385 $ 11,437 % of Loans 5.23 % 4.68 % N/A N/A 4.53 % 3.55 % 2.40 % 2.18 % Avg. refreshed (C)LTV N/A N/A N/A N/A N/A N/A N/A N/A 90%+ refreshed (C)LTV N/A N/A N/A N/A N/A N/A N/A N/A Avg. refreshed FICO 2 N/A N/A 685 686 N/A N/A N/A N/A % below 620 FICO 2 N/A N/A 16 % 16 % N/A N/A N/A N/A 1 Other primarily consists of the following portfolios of loans: Consumer unsecured lending and dealer financial services. 2 Credit card shown on a domestic basis. 19
  • 20. Consumer Asset Quality Key Indicators – Excluding Countrywide ($ in millions) Total Managed Residential Mortgage Home Equity Credit Card Other 1 Consumer Held Managed 3Q08 2Q08 3Q08 2Q08 3Q08 2Q08 3Q08 2Q08 3Q08 2Q08 3Q08 2Q08 Loans EOP $230,203 $235,472 $122,869 $121,409 $ 81,350 $ 78,642 $183,398 $187,162 $ 86,559 $ 88,766 $623,029 $632,809 Loans Avg 234,004 256,164 121,945 120,265 80,489 78,221 186,408 185,659 89,272 86,546 631,629 648,634 Net losses $ 242 $ 151 $ 966 $ 923 $ 1,242 $ 1,108 $ 2,996 $ 2,751 $ 951 $ 743 $ 5,155 $ 4,568 % of avg loans 0.41 % 0.24 % 3.15 % 3.09 % 6.14 % 5.69 % 6.40 % 5.96 % 4.23 3.43 % 3.25 % 2.83 % 90+ Performing DPD 2 $ 268 $ 278 N/A N/A $ 2,330 $ 2,109 $ 5,288 $ 5,278 $ 1,116 $ 1,000 $ 6,672 $ 6,557 % of Loans 0.12 % 0.12 % N/A N/A 2.87 % 2.68 % 2.88 % 2.82 % 1.29 % 1.13 % 1.07 % 1.04 % Nonperforming loans $ 4,445 $ 3,269 $ 2,022 $ 1,851 N/A N/A N/A N/A $ 102 $ 100 $ 6,569 $ 5,220 % of Loans 1.93 % 1.39 % 1.65 % 1.52 % N/A N/A N/A N/A 0.12 % 0.11 % 1.05 % 0.82 % Allowance for loan losses $ 1,163 $ 792 $ 3,854 $ 3,812 $ 4,257 $ 3,684 N/A N/A $ 3,926 $ 3,149 $ 13,200 $ 11,437 % of Loans 0.51 % 0.34 % 3.14 % 3.14 % 5.23 % 4.68 % N/A N/A 4.53 % 3.55 % 2.53 % 2.18 % Avg. refreshed (C)LTV 4 69 65 82 78 N/A N/A N/A N/A N/A N/A N/A N/A 90%+ refreshed (C)LTV 4 20 % 16 % 37 % 35 % N/A N/A N/A N/A N/A N/A N/A N/A Avg. refreshed FICO 3, 4 732 733 716 716 N/A N/A 685 686 N/A N/A N/A N/A % below 620 FICO 3, 4 7 % 6 % 10 % 10 % N/A N/A 16 % 16 % N/A N/A N/A N/A 1 Other primarily consists of the following portfolios of loans: Consumer unsecured lending and dealer financial services. 2 Includes loans delinquent more than 90 days and still accruing interest. 3 Credit card shown on a domestic basis. 4 Residential mortgage data as of August 2008. 20
  • 21. Consumer Asset Quality Key Indicators – Countrywide only ($ in millions) 3Q08 Residential Home Equity Discontinued Real Estate Total Consumer Excluding the Excluding the Excluding the Excluding the Purchase Purchase Purchase Purchase Accounting Accounting Accounting Accounting As Reported impact 1 As Reported impact 1 As Reported impact 1 As Reported impact 1 Loans EOP $ 26,786 $ 29,129 $ 29,069 $ 32,569 $ 22,081 $ 27,276 $ 77,906 $ 88,942 Loans Avg 26,744 29,224 29,197 32,963 22,031 27,610 77,814 89,639 Net losses $ - $ 280 $ (4) $ 761 $ (3) $ 940 $ (7) $ 1,981 % of avg loans - % 3.81 % (0.05) % 9.18 % (0.05) % 13.55 % (0.03) % 8.79 % Allowance for loan losses $ 213 N/A $ 890 N/A $ 82 N/A $ 1,185 N/A % of Loans 0.80 % N/A 3.06 % N/A 0.37 % N/A 1.52 % N/A 1 The purchase accounting impacts on loans are the fair value adjustments related to the impaired and non-impaired acquired portfolios. Loan balances have been reduced by the charge-offs that would have occurred during the quarter had purchase accounting not been applied at acquisition. 21
  • 22. Consumer Real Estate Asset Quality Home Equity • Net charge-off ratio down 56 basis points from 2Q08 to 2.53% (up 6 bps excluding Countrywide) – Loans with >90% CLTV represents 37% of portfolio (legacy BAC only) – CA and FL represent 40% of the portfolio but 66% of losses. • Allowance for loan losses was 3.12% of loans. Residential Mortgage • Net charge-off ratio up 13 basis points from 2Q08 to 0.37% (up 17 bps excluding Countrywide) – Net charge-offs were $242 million. Housing stressed states and the CRA portfolio drove a disproportionate share of losses. – Loans with >90% CLTV represented 20% of the portfolio (legacy BAC only, August data). – CA and FL represented 42% of the portfolio but 62% of losses (as of August). • Allowance was increased and covers 0.54% of loans. 22
  • 23. Consumer Real Estate (cont’d) and Other Consumer Lending Asset Quality Discontinued Real Estate • Net recovery of 0.05% (impaired loans written down to fair value at acquisition date). • Allowance for loan losses was 0.37% of loans. Consumer Credit Card – Managed Basis • Net loss ratio climbed 44 basis points to 6.40%. – Increase greater in geographies of housing stress • Allowance was increased to cover 5.23% of held loans. • 30+ delinquencies increased 36 basis points to 5.89% of loans. • 90+ delinquencies increased 6 basis point to 2.88% of loans. 23
  • 24. Commercial Asset Quality Key Indicators 1 ($ in millions) Commercial Lease Commercial 2 Commercial Real Estate Small Business Financing Total Commercial 3Q08 2Q08 3Q08 2Q08 3Q08 2Q08 3Q08 2Q08 3Q08 2Q08 Loans EOP $232,824 $235,541 $ 63,736 $ 62,897 $ 19,430 $ 19,908 $ 22,416 $ 22,815 $338,406 $341,161 Loans Avg 233,508 227,603 63,013 62,640 19,715 20,008 22,585 22,276 338,821 332,527 Net charge-offs $ 163 $ 75 $ 262 $ 136 $ 527 $ 477 $ 8 $ 6 $ 960 $ 694 % of avg loans 0.28 % 0.13 % 1.65 % 0.88 % 10.64 % 9.59 % 0.13 % 0.11 % 1.13 % 0.84 % 90+ Performing DPD $ 257 $ 278 $ 204 $ 262 $ 598 $ 594 $ 45 $ 27 $ 1,104 $ 1,161 % of Loans 0.11 % 0.12 % 0.32 % 0.42 % 3.08 % 2.98 % 0.20 % 0.12 % 0.33 % 0.34 % Nonperforming loans $ 1,614 $ 1,127 $ 3,090 $ 2,616 $ 183 $ 153 $ 35 $ 40 $ 4,922 $ 3,936 % of Loans 0.69 % 0.47 % 4.85 % 4.15 % 0.94 % 0.77 % 0.16 % 0.18 % 1.45 % 1.15 % Allowance for loan losses $ 2,179 $ 2,083 $ 1,376 $ 1,333 $ 2,196 $ 2,078 $ 210 $ 199 $ 5,961 $ 5,693 % of Loans 0.94 % 0.87 % 2.16 % 2.12 % 11.30 % 10.44 % 0.94 % 0.87 % 1.76 % 1.67 % Criticized Utilized Exposure 3 $ 19,299 $ 15,616 $ 12,204 $ 10,776 $ 1,203 $ 1,060 $ 1,131 $ 870 $ 33,837 $ 28,322 % of Total Exposure 5.47 % 4.49 % 17.50 % 15.62 % 6.16 % 5.29 % 5.05 % 3.81 % 7.32 % 6.16 % • Homebuilder utilized balances at 9/30/08, included in commercial real estate, were flat compared to 2Q08 at $13 billion. These utilized balances are included in total binding exposure which was $18 billion. – Criticized utilized exposure increased $769 million to $8.3 billion (64% of utilized exposure) – NPAs rose $520 million to $2.7 billion – 3Q08 charge-offs were $222 million compared to $130 million in 2Q08 1 Does not include certain commercial loans measured at fair value in accordance with SFAS 159. 2 Includes Commercial – Domestic and Commercial – Foreign. 3 Excludes Assets Held for Sale. 24
  • 25. Countrywide Purchase Accounting Update ($ in billions) Total purchase price $4.2 Preliminary allocation of the purchase price Countrywide shareholders' equity 8.4 Pre-tax adjustments to reflect assets acquired and liabilities assumed at fair value: Loans 1 (9.3) Investments in other financial instruments (0.3) Mortgage servicing rights (1.5) Other assets (0.7) Deposits (0.2) Notes payable and other liabilities (1.0) Pre-tax total adjustments (13.0) Deferred income taxes 4.7 After tax total adjustments (8.3) Fair value of net assets acquired 0.1 Preliminary goodwill resulting from the Merger $4.1 1 Loan mark detail: Balances Losses Loss % Consumer Prime firsts $ 30 $ 2.5 8.3 % Prime pay options 26 5.1 19.3 Home Equity 34 6.3 18.5 Sub-prime 2 0.4 27.7 Total consumer $ 92 $ 14.3 15.6 % Less: CFC allowance at 6/30 (5.0) Less: Non-impaired loan losses 2 (1.1) PAA for Credit 8.2 Add: Rate marks net of deferred fee write-off 1.1 Total loan PAA $ 9.3 2 Represents loss exposure for non-impaired loans that will flow through earnings over time, if incurred. 25
  • 26. Capital Actions to Strengthen Balance Sheet Announced intent to raise $10 billion in common equity • Allows us to capture near-term growth opportunities • Improves capital ratios Proforma w/ $10bb capital raise Capital Ratios 3Q08 3Q08 Tangible Total Ratio 4.0% 4.6% Tangible Common Ratio 2.6% 3.2% Leverage Ratio 5.5% 6.0% Tier 1 Capital 7.5% 8.3% Total Capital 11.5% 12.3% Announced 50% reduction in common dividend to $.32 quarterly • Reduces capital committed by roughly $6 billion annually • Adds roughly 11 bps quarterly 26
  • 27. Conclusions • Environment remains challenging – Credit costs reflect economic environment – Capital markets remain volatile • Business momentum remains strong in most businesses – Retail deposits and lending growing – Commercial customers seeking capital for liquidity – Wealth management showing steady customer activity and performance • Balance sheet strengthened • Integration of acquisitions on track 27
  • 29. Net Interest Income – Managed Sensitivity ($ in millions) Managed net interest income impact for next 12 months @ 9/30/08 @ 6/30/08 Forward curve interest rate scenarios +100 bp parallel shift $ (775) $ (1,189) - 100 bp parallel shift 558 1,113 Flattening scenario from forward curve + 100 bp flattening on short end (927) (1,283) - 100 bp flattening on long end (403) (234) Steepening scenario from forward curve + 100 bp steepening on long end 156 93 - 100 bp steepening on short end 970 1,350 29
  • 30. 30
  • 31. 31