


Time series clustering presentation
- 1. 12 Dec 2019 Time Series Clustering Yolande, Elena, & Beth
- 2. AGENDA 01 Distance Measures 02 03Prototypes 07 Data Preprocessing 04 Background Clustering Algorithms 05 Cluster Evaluation 06 Remarks & Conclusions
- 3. BACKGROUND What is time series? What is time series clustering and its applications? 01
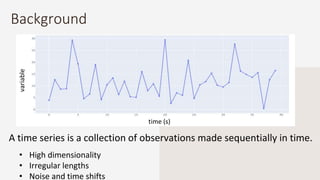
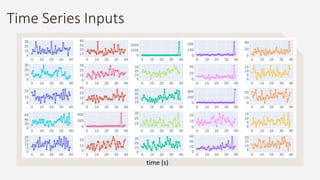
- 4. Background • High dimensionality • Irregular lengths • Noise and time shifts time (s) variable A time series is a collection of observations made sequentially in time.
- 5. Time Series Inputs time (s)
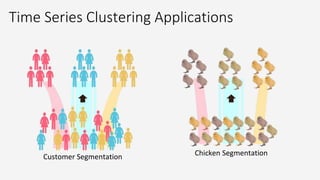
- 6. Time Series Clustering Applications Customer Segmentation Chicken Segmentation
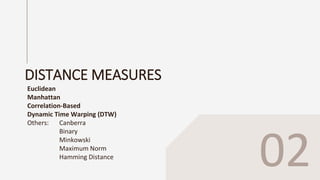
- 8. DISTANCE MEASURES Euclidean Manhattan Correlation-Based Dynamic Time Warping (DTW) Others: Canberra Binary Minkowski Maximum Norm Hamming Distance 02
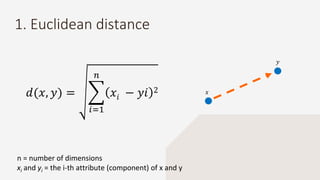
- 9. 1. Euclidean distance n = number of dimensions xi and yi = the i-th attribute (component) of x and y 𝑑(𝑥, 𝑦) = 𝑖=1 𝑛 𝑥𝑖 − 𝑦𝑖 2 𝑥 𝑦
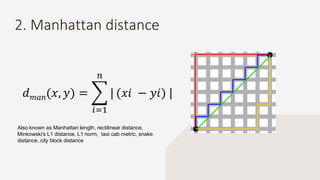
- 10. 2. Manhattan distance 𝑑 𝑚𝑎𝑛(𝑥, 𝑦) = 𝑖=1 𝑛 | (𝑥𝑖 − 𝑦𝑖) | Also known as Manhattan length, rectilinear distance, Minkowski's L1 distance, L1 norm, taxi cab metric, snake distance, city block distance
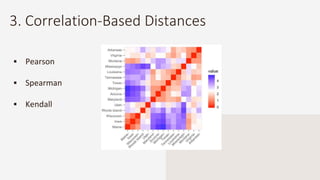
- 11. 3. Correlation-Based Distances Pearson Spearman Kendall
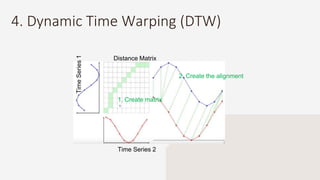
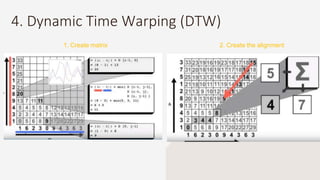
- 12. 4. Dynamic Time Warping (DTW) Time Series 2 TimeSeries1 Distance Matrix 1. Create matrix 2. Create the alignment
- 13. 4. Dynamic Time Warping (DTW) 1. Create matrix 2. Create the alignment
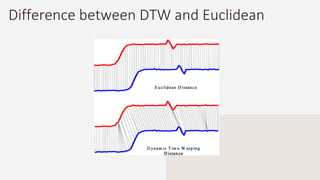
- 14. Difference between DTW and Euclidean
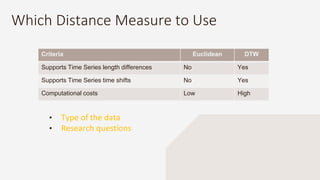
- 15. Which Distance Measure to Use • Type of the data • Research questions Criteria Euclidean DTW Supports Time Series length differences No Yes Supports Time Series time shifts No Yes Computational costs Low High
- 17. PROTOTYPES Mean - Median Partition Around Medoids ( PAM) Methods DTW Barycenter Averaging Shape Extraction 03
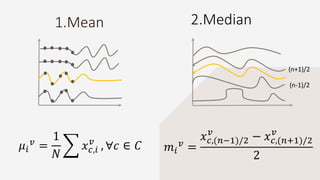
- 18. 1.Mean 2.Median 𝜇𝑖 𝑣 = 1 𝑁 𝑥 𝑐,𝑖 𝑣 , ∀𝑐 ∈ 𝐶 𝑚𝑖 𝑣 = 𝑥 𝑐,(𝑛−1)/2 𝑣 − 𝑥 𝑐,(𝑛+1)/2 𝑣 2 (n+1)/2 (n-1)/2
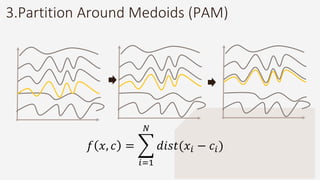
- 19. 3.Partition Around Medoids (PAM) 𝑓 𝑥, 𝑐 = 𝑖=1 𝑁 𝑑𝑖𝑠𝑡(𝑥𝑖 − 𝑐𝑖)
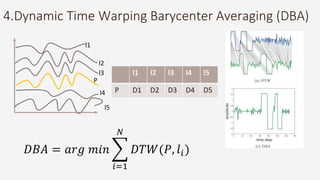
- 20. 4.Dynamic Time Warping Barycenter Averaging (DBA) l1 l2 l3 P l4 l5 l1 l2 l3 l4 l5 P D1 D2 D3 D4 D5 𝐷𝐵𝐴 = 𝑎𝑟𝑔 𝑚𝑖𝑛 𝑖=1 𝑁 𝐷𝑇𝑊(𝑃, 𝑙𝑖)
- 21. 5.Shape Extraction 𝑆𝐸 𝑋, 𝑣𝑖 = 𝑥 𝑘∈𝑋 𝑖 ∆(𝑥 𝑘 − 𝑣𝑖)2
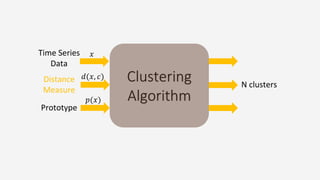
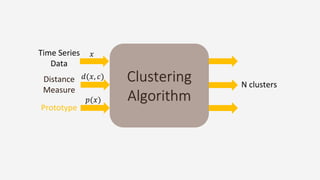
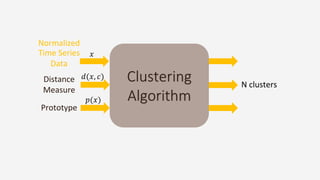
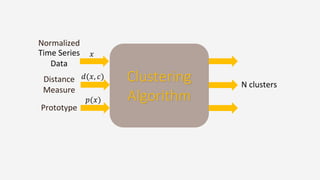
- 22. Clustering Algorithm Distance Measure Prototype N clusters Time Series Data 𝑑(𝑥, 𝑐) 𝑝(𝑥) 𝑥 Normalized
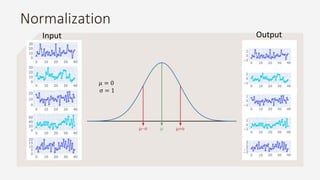
- 26. Normalization 𝜇 = 0 σ = 1 Input Output
- 27. Clustering Algorithm Distance Measure Prototype N clusters Time Series Data 𝑑(𝑥, 𝑐) 𝑝(𝑥) 𝑥 Normalized
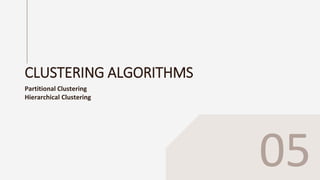
- 28. CLUSTERING ALGORITHMS Partitional Clustering Hierarchical Clustering 05
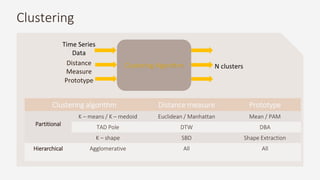
- 29. Clustering Clustering algorithm Distance measure Prototype Partitional K – means / K – medoid Euclidean / Manhattan Mean / PAM TAD Pole DTW DBA K – shape SBD Shape Extraction Hierarchical Agglomerative All All Clustering AlgorithmDistance Measure Prototype N clusters Time Series Data
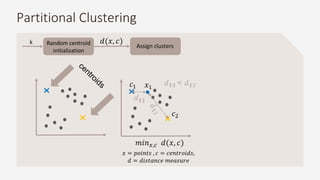
- 30. Assign clusters 𝑐1 𝑐2 𝑥1 𝑑 𝟏𝟏 < 𝑑 𝟏2 Random centroid initialization k 𝑥 = 𝑝𝑜𝑖𝑛𝑡𝑠 , 𝑐 = 𝑐𝑒𝑛𝑡𝑟𝑜𝑖𝑑𝑠, 𝑑 = 𝑑𝑖𝑠𝑡𝑎𝑛𝑐𝑒 𝑚𝑒𝑎𝑠𝑢𝑟𝑒 𝑚𝑖𝑛 𝑥,𝑐 𝑑(𝑥, 𝑐) 𝑑(𝑥, 𝑐) Partitional Clustering
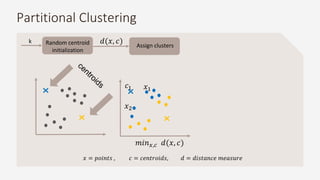
- 31. Assign clusters 𝑐1 𝑥1 𝑥2 𝑥 = 𝑝𝑜𝑖𝑛𝑡𝑠 , 𝑐 = 𝑐𝑒𝑛𝑡𝑟𝑜𝑖𝑑𝑠, 𝑑 = 𝑑𝑖𝑠𝑡𝑎𝑛𝑐𝑒 𝑚𝑒𝑎𝑠𝑢𝑟𝑒 𝑚𝑖𝑛 𝑥,𝑐 𝑑(𝑥, 𝑐) Random centroid initialization k 𝑑(𝑥, 𝑐) Partitional Clustering
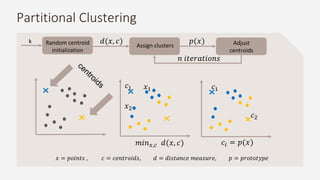
- 32. Adjust centroids Assign clusters 𝑐1 𝑥1 𝑥2 𝑥 = 𝑝𝑜𝑖𝑛𝑡𝑠 , 𝑐 = 𝑐𝑒𝑛𝑡𝑟𝑜𝑖𝑑𝑠, 𝑑 = 𝑑𝑖𝑠𝑡𝑎𝑛𝑐𝑒 𝑚𝑒𝑎𝑠𝑢𝑟𝑒, 𝑝 = 𝑝𝑟𝑜𝑡𝑜𝑡𝑦𝑝𝑒 𝑚𝑖𝑛 𝑥,𝑐 𝑑(𝑥, 𝑐) Random centroid initialization k 𝑑(𝑥, 𝑐) 𝑝(𝑥) 𝑐𝑖 = 𝑝(𝑥) 𝑐1 𝑐2 𝑛 𝑖𝑡𝑒𝑟𝑎𝑡𝑖𝑜𝑛𝑠 Partitional Clustering
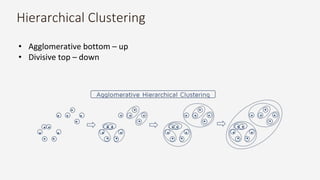
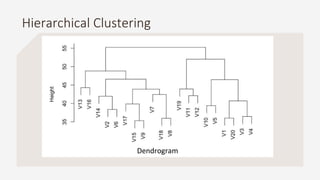
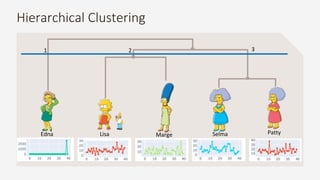
- 33. Hierarchical Clustering • Agglomerative bottom – up • Divisive top – down
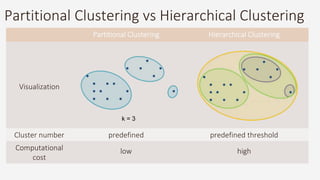
- 36. Partitional Clustering vs Hierarchical Clustering Partitional Clustering Hierarchical Clustering Visualization Cluster number predefined predefined threshold Computational cost low high k = 3
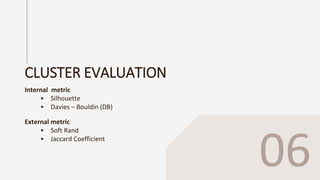
- 37. CLUSTER EVALUATION Internal metric Silhouette Davies – Bouldin (DB) External metric Soft Rand Jaccard Coefficient 06
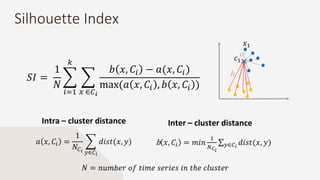
- 38. Silhouette Index 𝑆𝐼 = 1 𝑁 𝑖=1 𝑘 𝑥 ∈𝐶 𝑖 𝑏 𝑥, 𝐶𝑖 − 𝑎(𝑥, 𝐶𝑖) max(𝑎 𝑥, 𝐶𝑖 , 𝑏 𝑥, 𝐶𝑖 ) 𝑎 𝑥, 𝐶𝑖 = 1 𝑁𝐶 𝑖 𝑦∈𝐶 𝑖 𝑑𝑖𝑠𝑡(𝑥, 𝑦) b 𝑥, 𝐶𝑖 = 𝑚𝑖𝑛 1 𝑁 𝐶 𝑖 𝑦∈𝐶𝑖 𝑑𝑖𝑠𝑡(𝑥, 𝑦) 𝑐1 𝑥1 Intra – cluster distance Inter – cluster distance 𝑁 = 𝑛𝑢𝑚𝑏𝑒𝑟 𝑜𝑓 𝑡𝑖𝑚𝑒 𝑠𝑒𝑟𝑖𝑒𝑠 𝑖𝑛 𝑡ℎ𝑒 𝑐𝑙𝑢𝑠𝑡𝑒𝑟
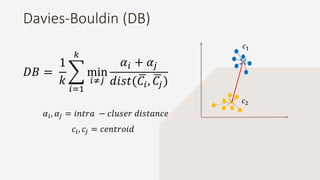
- 39. Davies-Bouldin (DB) 𝐷𝐵 = 1 𝑘 𝑖=1 𝑘 min 𝑖≠𝑗 𝛼𝑖 + 𝛼𝑗 𝑑𝑖𝑠𝑡( 𝐶𝑖, 𝐶𝑗) 𝑐1 𝑐2 𝛼𝑖, 𝛼𝑗 = 𝑖𝑛𝑡𝑟𝑎 − 𝑐𝑙𝑢𝑠𝑒𝑟 𝑑𝑖𝑠𝑡𝑎𝑛𝑐𝑒 𝑐𝑖, 𝑐𝑗 = 𝑐𝑒𝑛𝑡𝑟𝑜𝑖𝑑
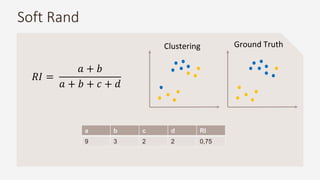
- 40. Soft Rand 𝑅𝐼 = 𝑎 + 𝑏 𝑎 + 𝑏 + 𝑐 + 𝑑 Clustering Ground Truth a b c d RI 9 3 2 2 0,75
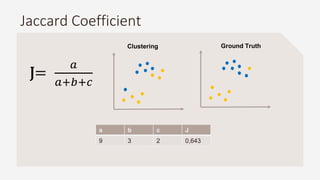
- 41. Jaccard Coefficient Clustering Ground Truth a b c J 9 3 2 0,643 J= 𝑎 𝑎+𝑏+𝑐
- 42. REMARKS Elbow method Silhouette index GAP Statistics Discrete Fourier Transform (DFT) 07
- 43. CONCLUSIONS What is the take away? 07
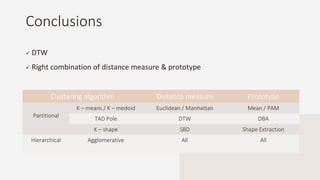
- 44. DTW Right combination of distance measure & prototype Conclusions Clustering algorithm Distance measure Prototype Partitional K – means / K – medoid Euclidean / Manhattan Mean / PAM TAD Pole DTW DBA K – shape SBD Shape Extraction Hierarchical Agglomerative All All
Editor's Notes
- Provide quantification for the dissimilarity between two time-series The classification of objects, into clusters, requires some methods for measuring the distance or the (dis)similarity between the objects The term proximity is used to refer to either similarity or dissimilarity. Frequently, the term distance is used as a synonym for dissimilarity.
- Variable for Recent years have seen a surge of interest in time series clustering. Data characteristics are evolving and traditional clustering algorithms are becoming less popular in time series clustering. The most commonly used distance measures are only defined for series of equal length and are sensitive to noise, scale and time shifts Thus, many other distance measures tailored to time-series have been developed in order to overcome these limitations; other challenges associated with the structure of time-series, such as multiple variables, serial correlation each
- Goal is to put them all together in clusters
- Input in customer segmentation Mention about chicken segmentation Behavior based on purchases, bank transactions, energy, other utilities usage/consumption, social networks – who is connected to who
- Hierarchy of classes dendrogram
- Provide quantification for the dissimilarity between two time-series The classification of objects, into clusters, requires some methods for measuring the distance or the (dis)similarity between the objects The term proximity is used to refer to either similarity or dissimilarity. Frequently, the term distance is used as a synonym for dissimilarity.
- https://en.wikipedia.org/wiki/Taxicab_geometry The distance between two points measured along axes at right angles. Also known as Manhattan length, rectilinear distance, Minkowski's L1 distance, L1 norm, taxi cab metric, snake distance, city block distance
- Correlation measures are only useful if/when the relationship between attributes is linear. So if the correlation is 0, then there is no linear relationship between the two data objects. http://cs.tsu.edu/ghemri/CS497/ClassNotes/ML/Similarity%20Measures.pdf Be ready to explain pearson and spearman
- When time series have different lengths One of the most used measure of the similarity between two time series Originally designed to treat automatic speech recognition Optimal global alignment between two time series, exploiting temporal distortions between them Designed especially for time series analysis Ignore shifts in time dimension Ignore speeds of two time series How is it calculated?
- When time series have different lengths One of the most used measure of the similarity between two time series Originally designed to treat automatic speech recognition Optimal global alignment between two time series, exploiting temporal distortions between them Designed especially for time series analysis Ignore shifts in time dimension Ignore speeds of two time series How is it calculated?
- https://www.datanovia.com/en/lessons/clustering-distance-measures/ For example, correlation-based distance is often used in gene expression data analysis. Correlation-based distance considers two objects to be similar if their features are highly correlated, even though the observed values may be far apart in terms of Euclidean distance. For most clustering package, Euclidean is default. If we want to identify clusters of observations with the same overall profiles regardless of their magnitudes, then correlation-based distance If correlation, Pearson’s correlation is quite sensitive to outliers Commonly used in gene expression data analysis marketing, if we want to identify group of shoppers with the same preference in term of items, regardless of the volume of items they bought.
- Hierarchy of classes dendrogram
- Gamma is the optimization function. A is the alignment function
- Hierarchy of classes dendrogram
- Hierarchy of classes dendrogram
- Clusters are defines beforehand
- Compute distance between point and centroids and keep the minimum Predict For each data point calculate the distance from both centroids and the data point is assigned to the cluster with the min distance Move centroids in the point where the is the mean distance so that they are in the center of the cluster
- Compute distance between point and centroids and keep the minimum Predict For each data point calculate the distance from both centroids and the data point is assigned to the cluster with the min distance Move centroids in the point where the is the mean distance so that they are in the center of the cluster
- Compute distance between point and centroids and keep the minimum Predict For each data point calculate the distance from both centroids and the data point is assigned to the cluster with the min distance Move centroids in the point where the is the mean distance so that they are in the center of the cluster
- Hierarchy of classes dendrogram
- Each character has each one cluster Input = genetic code Selma + Patty twins Lisa + Merge mother and daughter (less similarity because the share genetic code with Homer Simpson) Selma + patty sisters of Marge Number of clusters and order of clustering
- A: number of time series assigned to same cluster and belong to the same class B: number of time series assigned to different cluster and belong to the different class C: number of time series assigned to different cluster and belong to the same class D: number of time series assigned to same cluster and belong to the different class