TIME TEMPERATURE TRANSFORMATION DIAGRAM
- 1. University College Of Engineering , RTU Submitted To :- Mr. R.K Bhambu (Mechanical Engg. Dept.) Submitted By :- Jairam Lakhran C.R.No. :- 13/602 Aeronautical Engg. (2nd Yr., A1)
- 2. T T T DIAGRAM ( TIME TEMPERATURE TRANSFORMATION) Material Science Engineering
- 3. REFERENCES Materials Science and Engineering, V. Raghavan, Fifth Edition, Prentice Hall of India Pvt. Ltd., New Delhi, 2004. Materials Science and Engineering: An Introduction, William D. Callister John Wiley & Sons, 2010. ONLINE
- 4. TTT diagrams TTT diagram stands for “time- temperature-transformation” diagram. It is also called isothermal transformation diagram Definition: TTT diagrams give the kinetics of isothermal transformations.
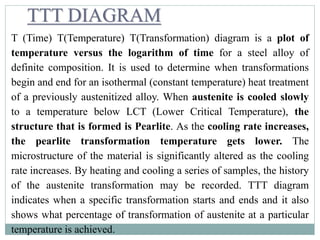
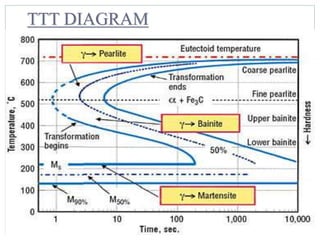
- 5. T (Time) T(Temperature) T(Transformation) diagram is a plot of temperature versus the logarithm of time for a steel alloy of definite composition. It is used to determine when transformations begin and end for an isothermal (constant temperature) heat treatment of a previously austenitized alloy. When austenite is cooled slowly to a temperature below LCT (Lower Critical Temperature), the structure that is formed is Pearlite. As the cooling rate increases, the pearlite transformation temperature gets lower. The microstructure of the material is significantly altered as the cooling rate increases. By heating and cooling a series of samples, the history of the austenite transformation may be recorded. TTT diagram indicates when a specific transformation starts and ends and it also shows what percentage of transformation of austenite at a particular temperature is achieved. TTT DIAGRAM
- 6. TTT DIAGRAM
- 7. Stable Austenite Unstable Austenite Transformatio n starts/begins Transformation ends Coarse Pearlite Fine Pearlite Unstable Austenite Feathery Bainite Acicular Bainite Ms Mf Austenite + Martensite Martensite Time-Temperature Transformation Curves
- 8. STABLE AUSTENITE Bianite in feather shaped patches Degree of under cooling high Sluggish transformation Austenite to Coarse Pearlite Greater time for diffusion Slow rate of diffusion of Carbon atoms retards increased tendency of Austenite transformation, 550 550- 220 Near A1
- 10. Austenite is stable at temperatures above LCT but unstable below LCT. Left curve indicates the start of a transformation and right curve represents the finish of a transformation. The area between the two curves indicates the transformation of austenite to different types of crystal structures. (Austenite to pearlite, austenite to martensite, austenite to bainite transformation.) Isothermal Transform Diagram shows that γ to transformation (a) is rapid! at speed of sound; (b) the percentage of transformation depends on Temperature only:
- 11. Upper half of TTT Diagram (Austenite-Pearlite Transformation Area)
- 12. As indicated when is cooled to temperatures below LCT, it transforms to other crystal structures due to its unstable nature. A specific cooling rate may be chosen so that the transformation of austenite can be 50 %, 100 % etc. If the cooling rate is very slow such as annealing process, the cooling curve passes through the entire transformation area and the end product of this the cooling process becomes 100% Pearlite. In other words, when slow cooling is applied, all the Austenite will transform to Pearlite. If the cooling curve passes through the middle of the transformation area, the end product is 50 % Austenite and 50 % Pearlite, which means that at certain cooling rates we can retain part of the Austenite, without transforming it into Pearlite.
- 13. Lower half of TTT Diagram (Austenite-Martensite and Bainite Transformation Areas)
- 14. If a cooling rate is very high, the cooling curve will remain on the left hand side of the Transformation Start curve. In this case all Austenite will transform to Martensite. If there is no interruption in cooling the end product will be martensite.
- 15. TTT diagram gives - Nature of transformation-isothermal or athermal (time independent) or mixed - Type of transformation-reconstructive, or displacive - Rate of transformation - Stability of phases under isothermal transformation conditions - Temperature or time required to start or finish transformation - Qualitative information about size scale of product - Hardness of transformed products
- 16. diagram Composition of steel- (a) carbon wt%, (b) alloying element wt% Grain size of austenite Heterogeneity of austenite
- 17. Carbon wt%- As the carbon percentage increases A3 decreases, similar is the case for Ae3, i.e. austenite stabilises. So the incubation period for the austenite to pearlite increases i.e. the C curve moves to right. However after 0.77 wt%C any increase in C, Acm line goes up, i.e. austenite become less stable with respect to cementite precipitation. So transformation to pearlite becomes faster. Therefore C curve moves towards left after 0.77%C. The critical cooling rate required to prevent diffusional
- 18. THE END


