


Trading partners of india
- 1. India’s Trading Partners By HUMSI SINGH
- 2. Agenda Brief account of topics. Introduction Major trading partners and % of share. India’s Trading partners Top importing and exporting countries, companies and commodities. Top 10 Imports and Exports Current scenario. Conclusion
- 3. Introduction India and its boundaries…
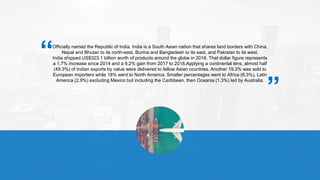
- 4. Officially named the Republic of India, India is a South Asian nation that shares land borders with China, Nepal and Bhutan to its north-east, Burma and Bangladesh to its east, and Pakistan to its west. India shipped US$323.1 billion worth of products around the globe in 2018. That dollar figure represents a 1.7% increase since 2014 and a 9.2% gain from 2017 to 2018.Applying a continental lens, almost half (49.3%) of Indian exports by value were delivered to fellow Asian countries. Another 19.3% was sold to European importers while 18% went to North America. Smaller percentages went to Africa (8.3%), Latin America (2.9%) excluding Mexico but including the Caribbean, then Oceania (1.3%) led by Australia. “ “
- 6. India’s Trading Pattern Above is a pie chart highlighting 15 of India’s top trading partners in terms of co untries that imported the most Indian shipments by dollar value during 2018. Al so shown is each import country’s percentage of total Indian exports. 16% 9% 5.10%4.10% 3.20% 3% 2.80% 2.70% 2.70% 2.30% 2.10% 2.10% 2% 1.70% 1.70% % Share of Export United States United Arab Emirates China Hong Kong Singapore United Kingdom Germany Bangladesh Netherlands Nepal Belgium Vietnam Malaysia Italy Saudi Arabia
- 7. 1. United States: US$51.6 billion (16% of total Indian exports) 2. United Arab Emirates: $29 billion (9%) 3. China: $16.4 billion (5.1%) 4. Hong Kong: $13.2 billion (4.1%) 5. Singapore: $10.4 billion (3.2%) 6. United Kingdom: $9.8 billion (3%) 7. Germany: $9 billion (2.8%) 8. Bangladesh: $8.8 billion (2.7%) 9. Netherlands: $8.7 billion (2.7%) 10. Nepal: $7.3 billion (2.3%) 11. Belgium: $6.8 billion (2.1%) 12. Vietnam: $6.7 billion (2.1%) 13. Malaysia: $6.5 billion (2%) 14. Italy: $5.5 billion (1.7%) 15. Saudi Arabia: $5.5 billion (1.7%)
- 8. India’s Top 10 Exported Commodities
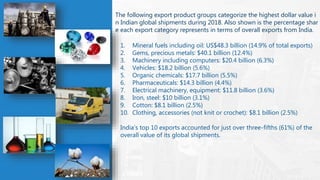
- 9. The following export product groups categorize the highest dollar value i n Indian global shipments during 2018. Also shown is the percentage shar e each export category represents in terms of overall exports from India. 1. Mineral fuels including oil: US$48.3 billion (14.9% of total exports) 2. Gems, precious metals: $40.1 billion (12.4%) 3. Machinery including computers: $20.4 billion (6.3%) 4. Vehicles: $18.2 billion (5.6%) 5. Organic chemicals: $17.7 billion (5.5%) 6. Pharmaceuticals: $14.3 billion (4.4%) 7. Electrical machinery, equipment: $11.8 billion (3.6%) 8. Iron, steel: $10 billion (3.1%) 9. Cotton: $8.1 billion (2.5%) 10. Clothing, accessories (not knit or crochet): $8.1 billion (2.5%) India’s top 10 exports accounted for just over three-fifths (61%) of the overall value of its global shipments.
- 10. India’s Top 10 Imported Commodities
- 11. The following product groups represent the highest dollar value in India’s import purchases during 2018-19 Also shown is the percentage share each product category represents in terms of overall imports into India. 1. Mineral fuels including oil: US$168.6 billion (33.2% of total imports) 2. Gems, precious metals: $65 billion (12.8%) 3. Electrical machinery, equipment: $52.4 billion (10.3%) 4. Machinery including computers: $43.2 billion (8.5%) 5. Organic chemicals: $22.6 billion (4.4%) 6. Plastics, plastic articles: $15.2 billion (3%) 7. Iron, steel: $12 billion (2.4%) 8. Animal/vegetable fats, oils, waxes: $10.2 billion (2%) 9. Optical, technical, medical apparatus: $9.5 billion (1.9 %) 10. Inorganic chemicals: $7.3 billion (1.4%)
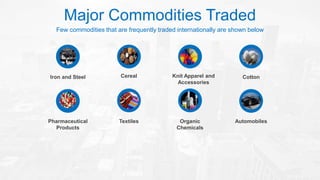
- 12. Major Commodities Traded Few commodities that are frequently traded internationally are shown below Iron and Steel Knit Apparel and Accessories Cereal Cotton Pharmaceutical Products Organic Chemicals Textiles Automobiles
- 13. Top Trading Countries United States $51.66B exports. (2018) United Arab Emirates $28.54B exports. (2018) China $16.38B exports. (2018) Hong Kong $13.14B exports. (2018)
- 14. Trading Pattern UnitedSates China Hong-Kong United Arab Emirates Exports to United States in India averaged 96.53 INR Billion from 1991 until 2019, reaching an all time high of 346.53 INR Billion in May of 2019 and a record low of 4.01 INR Billion in June of 1991. Exports to United Arab Emirates in India averaged 68.59 INR Billion from 1991 until 2019, reaching an all time high of 290.59 INR Billion in March of 2011 and a record low of 0.93 INR Billion in June of 1991 Exports to China in India averaged 31.81 INR Billion from 1991 until 2019, reaching an all time high of 158.18 INR Billion in December of 2010 and a record low of 0.01 INR Billion in October of 1991. Exports to Hong Kong in India averaged 28.97 INR Billion from 1991 until 2019, reaching all time high of 128.79 INR Billion in February of 2017 and a record low of 0.85 INR Billion in November of 1991.
- 15. Top Trading Countries $10.45B Singapore $6.55B Malaysia $8.95B Germany $8.66B Netherlands $6.81B Belgium • Exports to Singapore in India averaged 24.93 INR Billio n from 1991 until 2019, reaching an all time high of 143. 61 INR Billion in March of 2019 and a record low of 0.54 INR Billion in June of 1991. • Exports to Malaysia in India averaged 10.95 INR Billion from 1991 until 2019, reaching an all time high of 69.77 INR Billion in January of 2015 and a record low of 0.25 I NR Billion in May of 1991. • Exports to Germany in India averaged 44.15 INR Billion from 2014 until 2019, reaching an all time high of 58.20 INR Billion in March of 2019 and a record low of 31.84 I NR Billion in November of 2015. • Exports to Belgium in India averaged 14.74 INR Billion f rom 1991 until 2019, reaching an all time high of 44.47 I NR Billion in May of 2018 and a record low of 0.53 INR Billion in April of 1992. • Exports to Netherlands in India averaged 16.93 INR Billi on from 1991 until 2019, reaching an all time high of 85. 90 INR Billion in May of 2019 and a record low of 0.45 I NR Billion in May of 1991.
- 16. Conclusion From independence in 1947 to the early 1990s, India was basically a closed economy t hat was governed according to socialist principles. Liberalization began in the 1980s and then accelerated in the early 1990s. A balance of payment crisis forced the government to lend from the International Monetary Fund and the World Bank. Today, the formerly state-run economy is largely driven by market dynamics. This is true of India’s foreign trade. India was a founding member of the World Trade Organization (WTO) in 1995, and had previously been involved in the General Agreement on Tariffs and Trade (GATT), which ultimately spawned the WTO. The patterns of India’s foreign trade have changed considerably since the early 1990s. From the financial year 1990/91 to the one of 2017/18, the total value of goods exports increased more than 16 times: from $18 billion to over $300 billion and goods imports increased almost 20 times: from $ 24 billion to more than $ 460 billion. The patterns of India’s foreign trade have changed in the past three decades. Exchange with emerging market s and developing countries has expanded spectacularly. India’s imports, however, have expanded faster than t he exports, so balance-of-payments problems may make the economy vulnerable.
- 17. Thank you!!!