Location via proxy:   [ UP ]  
[Report a bug]   [Manage cookies]                
SlideShare a Scribd company logo
Bank of America
Global Consumer & Small Business Banking
Liam McGee
President, Global Consumer & Small Business Banking

UBS Financial Services
May 13, 2008
Forward Looking Statements
    This presentation contains forward-looking statements, including statements about the
    financial conditions, results of operations and earnings outlook of Bank of America
    Corporation. The forward-looking statements involve certain risks and uncertainties. Factors
    that may cause actual results or earnings to differ materially from such forward-looking
    statements include, among others, the following: 1) projected business increases following
    process changes and other investments are lower than expected; 2) competitive pressure
    among financial services companies increases significantly; 3) general economic conditions
    are less favorable than expected; 4) political conditions including the threat of future terrorist
    activity and related actions by the United States abroad may adversely affect the company’s
    businesses and economic conditions as a whole; 5) changes in the interest rate environment
    reduce interest margins and impact funding sources; 6) changes in foreign exchange rates
    increases exposure; 7) changes in market rates and prices may adversely impact the value of
    financial products; 8) legislation or regulatory environments, requirements or changes
    adversely affect the businesses in which the company is engaged; 9) changes in accounting
    standards, rules or interpretations, 10) litigation liabilities, including costs, expenses,
    settlements and judgments, may adversely affect the company or its businesses; 11) mergers
    and acquisitions and their integration into the company; and 12) decisions to downsize, sell or
    close units or otherwise change the business mix of any of the company. For further
    information regarding Bank of America Corporation, please read the Bank of America reports
    filed with the SEC and available at www.sec.gov.


2
Positioned for Success

    • Differentiators
       –   Strong balance sheet and liquidity
       –   Unparalleled distribution
       –   Leading positions in key products
       –   Diverse income sources
       –   Most recognized brand

    • Managing near-term challenges
       – Economic pressure
       – Housing market

    • Solid business trends: deposits and consumer lending

    • Investing in growth opportunities
       –   Deposits and debit card
       –   Consumer lending
       –   Distribution network
       –   Mass affluent segment and affinity banking


3
Differentiators

     Unparalleled Franchise

      Leader in Customer Relationships

    • 59 million consumer and small business
     households
    • 78% of U.S. population in footprint
    • 87% of diverse HHs in footprint


             Leader in Distribution

    • 15 of 20 fastest growing states
    • 17%+ retail deposit market share in top
     30 markets
    • 6,100 banking centers, 18,500 ATMs
    • #1 Online and Mobile Banking


                Leader in Brand

    • Recently named the #1 global financial
     services brand

4
Differentiators

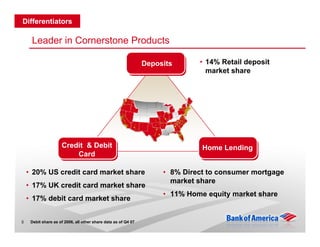
     Leader in Cornerstone Products

                                                                Deposits      • 14% Retail deposit
                                                                                market share


                     Credit & Debit                                            Home Lending
                         Card

    • 20% US credit card market share                                • 8% Direct to consumer mortgage
                                                                       market share
    • 17% UK credit card market share
                                                                     • 11% Home equity market share
    • 17% debit card market share


5    Debit share as of 2006, all other share data as of Q4 07
Differentiators

    Business Mix
    (in millions)
                               2007 Net Income


             Deposits                                 Card Services
              $5,227                                     $3,712
               56%                                        39%


                                                 Consumer
                        ALM/Other                Real Estate
                          $120                      $371
                           1%                        4%


6
Differentiators

    Geographic Diversity
                                                                                      1
                                                     Retail Deposit Share
             28%
                     25% 24% 24%
                                             23% 23% 23%
                                                                     21%

                                                                            17% 17%
                                                                                      16% 15%

                                                                                                12%
                                                                                                      10% 10%


                                                                                                                4%


                                                                                       hia
                                   s
                                co


                               ele


                                                                                     DC

                                                                                       o

                                                                                        it


                                                                                      go

                                                                                     ork
                                                                                     ton
                             ore

                              nix
                             llas


                                n


                                                                                      ta
                                 i
             le


                             am


                                                                                    tro
                                                                                   ieg


                                                                                   elp
                            st o
                            cis
          att


                                                                                  an


                                                                                 ica
                           ng
                           oe


                                                                               wY
                                                                                 us
                        ltim
                         Da


                                                                                De
                         Mi


                                                                               nD


                                                                              ilad
                       ran


                        Bo
        Se


                                                                               Atl
                      sA


                                                                              Ch
                       Ph


                                                                             Ho
                     Ba


                                                                            Ne
                    nF


                                                                            Sa


                                                                            Ph
                    Lo
                  Sa


    1   Source: June 2007 FDIC /(MSA defined geographies)
7
        Chicago and Detroit include the impact of the LaSalle acquisition
Differentiators

    Positioned to Capture Growth


                                                  United
                                                  States


    Source: “Retail Banking: Facing the Future”
8
    Boston Consulting Group, November 2007
Navigating the Current Environment


9
Current Environment

     • View of economy
     • Economic cycle
     • Impact on Bank of America customers and businesses


10
Current Environment

     Changing Trends in Consumer Purchasing
               Total Debit and Credit Purchase Volume                       YoY Growth of Necessary vs. Discretionary Spend per Account
                          (Proforma, in $Bns)
                                                                                                               Necessary
                             R
                   12.3% CAG                                                                                                         13.3%
                                            $412
                          $384

        $327

                                                $190
                           $169                         Debit               7.6%
         $142                                           Credit

                                                                                                                     Total
                                                                             4.4%
                           $215                 $222
         $185                                           $102                                                                         3.7%
                                                                             3.4%
                                                         $50                                                      Discretionary
                                                         $52                                                                         0.5%

         FY05              FY06                 FY07    Q1 08                  Q1 07        Q2 07     Q3 07       Q4 07           Q1 08


     • Total volume growth continues to show stable, long-term growth

     • Spending on necessities has increased dramatically in the last two
       quarters driven by higher fuel and food prices


     CAGR for Debit is 15.6% and CAGR for Credit Card is 9.6%. Both include LaSalle
11   Necessary includes Fuel, Grocery and Utilities (which also includes Phone and Cable)
     Discretionary includes Retail, Travel and Entertainment and Services
Consumer Credit


12
Current Environment

     Select Portfolio Characteristics – 1Q08

     Residential Mortgage - $266 billion

           Average refreshed FICO 734
           Average refreshed LTV 62%
           More than 90% refreshed LTV 10%
           Performing well against the environment and peer comparisons


           Residential mortgage trended statistics
                                        1Q07       2Q07   3Q07     4Q07     1Q08
           30+ DPD %                     1.02% 1.18%       1.44%    1.64%    1.56%
           Net c/o %                     0.01% 0.02%       0.02%    0.04%    0.10%
           Allowance for credit losses   0.10% 0.07%       0.07%    0.08%    0.15%


13
Current Environment

     Select Portfolio Characteristics – 1Q08

     Managed Consumer Credit Card - $184 billion

               Average refresehed FICO 685
               Performing well but experiencing upward loss pressure centered in
               housing depressed states


              Managed consumer credit card trended statistics
                                          1Q07    2Q07      3Q07   4Q07     1Q08
              30+ DPD %                    5.32% 5.08% 5.24%       5.45%     5.61%
              Net loss %                   4.73% 5.02% 4.67%        4.75%    5.19%
              Allowance for credit losses  4.99% 4.69% 4.32%        4.16%    4.81%


     US and foreign consumer card excluding business
14
Current Environment

     Select Portfolio Characteristics – 1Q08

     Home equity - $ 118 billion

           Average refreshed FICO 717
           Average refreshed CLTV 74%
           More than 90% refreshed CLTV 26%
           Rising losses driven by high CLTV and concentration in housing
           depressed states


          Home equity trended statistics
                                           1Q07     2Q07     3Q07     4Q07    1Q08
          30+ DPD %                         0.64%    0.72%    0.96%   1.26%    1.33%
          Net c/o %                         0.08%    0.12%    0.20%   0.63%    1.71%
          Allowance for credit losses       0.16%    0.26%    0.40%   0.84%    2.15%


15
Current Environment

     Housing Affected Geographies Driving Losses

     • Combined loan to value of more than 90%, on a refreshed basis,
       represents:
       – 26% of outstanding balances
       – 82% of 1Q08 net charge-offs

     • In 1Q08 California and Florida combined represent:
       – 40% of outstandings
       – 52% of delinquencies
       – 62% of charge-offs


16
Current Environment

     Select Portfolio Characteristics – 1Q08

     Small Business - $ 20 billion

           Rising losses driven by weakened economy and earlier vintages
           Credit card represents approximately half the portfolio


          Small business trended statistics
                                        1Q07     2Q07     3Q07     4Q07   1Q08
          30+ DPD %                      3.70%    3.96%    4.58%   5.29% 6.09%
          Net c/o %                      4.20%    4.80%    5.38%    5.82% 7.21%
          Allowance for credit losses    4.29%    5.34%    6.44%    7.02% 10.11%


17
Current Environment

     Lending Strategy Consistent but Evolving

     • Near-term management
       – Tightened underwriting standards
       – Significantly reduced LTVs with particular focus on housing
         stressed markets
       – Managing lines aggressively
       – Expanding customer assistance and collections


18
Deposits, Credit Card
     and Consumer Real Estate


19
Deposits

     New Relationships and Balance Growth
            Deposit Household Growth (GAAP, in MMs)                           Average Retail Balances & Spreads (GAAP, $Bns)
 Consumer                                                                  Market
 Market Share: 26.5%             27.5%        29.2%        29.1%           Share: 14.1%       13.2%        13.0%          13.9%                   14.0%

                                 AGR
                        6.2% C
                                                                                                           GR
                                                                                               5.9% CA
                                                3.3           3.3
                                  3.0
                     2.7
                                                                                                                                                     $521
                                                                                                           $482             $509
                                                                                      $444    $463
                                                             24.0
                                               23.8
                                 22.1
                    21.1                                                              2.64%    2.85%       2.76%
                                                                                                                             2.55%
                                                                                                                                                       2.10%


                    FY05         FY06          FY07          Q1 08                    FY05     FY06        FY07             Q407                      Q108

                             Consumer       Small Business                                      Balances          Margin
                                                                                                                    CAGR reflects Q1‘05 to Q1‘08 average retail balances.


     HH market share based on Claritas, Q108 based on estimate
20   Balance market share based on FDIC Summary of Deposits, Q108 based on estimate
     Both market shares based on BAC retail footprint
Deposits

     Managing for Growth and Profitability

                                      BAC Deposits Growth vs. Industry
                                                (Proforma)

                   10.8%
                                    10.1%
                                                                                            BAC
                                                                                            Industry
                                                                                            Fed Funds Rate
                                           7.0%
                          6.1%                               5.8%
                                                                                 4.6%


                                                                          3.0%
                                                                                                    2.3%
                                                                                        1.0% 0.9%          1.2%
                                                     -0.7%

                      2004             2005              2006               2007          4Q07        1Q08


     BAC growth vs. Industry is based on data from the Federal Reserve.
21
     Proforma for MBNA
Deposits

     Continuing Success in Revenue and Earnings
     (in billions)
           Earnings for GCSBB Deposits                                          Fee Income

                          C   AGR                                                  CAG
                                                                                       R
                     8.5%                                                    11.6%           $8.2

                                                                                    $7.2
                                                                                             $2.2
                                      $17.6                           $6.5
                         $16.7
                                                                                    $1.9
             $14.9
                                                                      $1.6
                                                                                                    Debit Card
                                 11.3%                                                              Service Charges
                                 CAGR

                                          $8.4
                               $7.7                                                          $6.0
                 $6.7                                                               $5.3
                                                                      $5.0
                                                                                                      $2.1
                                                                                                       $0.6
                                                     $4.1
                                                                                                      $1.6
                                                            $1.6

                FY05          FY06       FY07          Q108           FY05          FY06     FY07     Q108
                          Revenue             NIBT


22   Deposits Revenue and NIBT exclude residual net interest income
Deposits

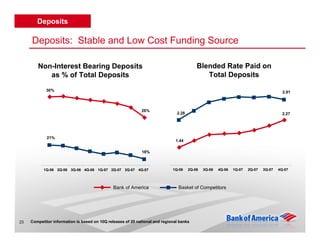
     Deposits: Stable and Low Cost Funding Source

        Non-Interest Bearing Deposits                                                     Blended Rate Paid on
           as % of Total Deposits                                                            Total Deposits

            30%                                                                                                                         2.91


                                                             26%
                                                                               2.28                                                     2.27


             21%
                                                                               1.44

                                                             18%


           1Q-06 2Q-06 3Q-06 4Q-06 1Q-07 2Q-07 3Q-07 4Q-07                   1Q-06    2Q-06   3Q-06   4Q-06   1Q-07   2Q-07   3Q-07   4Q-07


                                               Bank of America                  Basket of Competitors


23   Competitor information is based on 10Q releases of 20 national and regional banks
Deposits

     Mass Affluent: Opportunity for Future Growth
                         Segmentation of
                        Retail Deposit HHs
       75%


                                               % of BAC HHs
                                               Share of Deposits Wallet
                75%
                                                                                           • Mass affluent customers
                                                                                             account for 23% of deposit
                                 43%                                                         households.
                                                                                           • They hold more than $500 billion
                                                        20%                                  off-us deposits.
                                                                            10%
                              13%
                                                    10%

                                                                           1%

     <$100K             $100K-500K           $500K - $3MM               $3MM+

                       Household Investable Assets

     Based on internal data and analysis of off-us deposits as of June 2007
     Retail Deposits based on FDIC-insured; Money funds and non-insured portion of Jumbo CDs not
24   included
     Consumer deposits only, excludes small business products and households.
Consumer Credit

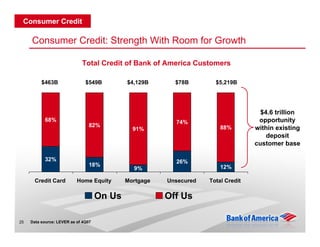
     Consumer Credit: Strength With Room for Growth

                             Total Credit of Bank of America Customers

          $463B                $549B         $4,129B      $78B        $5,219B


                                                                                     $4.6 trillion
           68%                                            74%                       opportunity
                                 82%
                                               91%                      88%        within existing
                                                                                       deposit
                                                                                   customer base

           32%                                            26%
                                 18%                                    12%
                                               9%

       Credit Card         Home Equity       Mortgage   Unsecured   Total Credit

                                     On Us              Off Us

25   Data source: LEVER as of 4Q07
Consumer Credit

     Credit Card Business Positioned to Grow

     • World class products

     • Broader distribution capabilities

     • Affinity marketing


26
Consumer Credit

     Superior Product Suite


                     Non Rewards                Rewards


                                   Customer

                                                          Affluent Offerings
          Teachers


                                                  Special Interest
                Sports

27                                     Alumni
Consumer Credit

     Affinity Partnerships Are Growing

     • New products, distribution and marketing create new growth
       opportunities with longstanding partners

     • Affinity portfolio continues to demonstrate superior credit quality


                       Launch     Recent Success
     NEA               1983       41% consumer loan growth since 2005
                                  27% increase in new card acquisition over 2006

     Ducks Unlimited   1986       20% card loan growth
                                  Tripled new account acquisition year-over-year

     GMAC              2004       49% card loan growth
                                  43% increase in new card accounts


28
Consumer Credit

     Affinity Banking: A Growing New Distribution Channel

     • 20% of all new deposit accounts are affinity related
     • More than 160 signed groups representing more than 120 million names
     • Launched 125 groups, including
         –   All 30 MLB teams
         –   NFL brand and 4 teams
         –   NASCAR and 9 drivers
         –   Habitat for Humanity
     • Endorsed products include credit card, checking, debit, money market,
       CD and savings


29
Consumer Credit

     Leveraging Channel Diversity to Balance Growth and Profitability


         18%                                                           $300
         16%
                                                                       $250
         14%
         12%             10.5%             9.9%                        $200
         10%                        9.6%
                                                                       $150
          8%      7.1%
                                                             5.7%
          6%                                                           $100
                                                      3.9%
          4%
                                                                       $50
          2%
          0%                                                           $0
                Stores/Online    Customer Direct   Affinity/Cobrand
                                       Mail            Direct Mail


               Yr2 NCL            5 Yr Avg RAM         Cost to Acquire (Pre-Tax)


30
Consumer Credit

     Consumer Real Estate

     • Cornerstone relationship products

     • Direct to Consumer approach

     • Countrywide


                   SHOW SUCCESS OF BUSINESS


31
Consumer Credit

     Mortgage: Growing Relationship Share


       Percentage of BAC deposit customers
                                                    BAC direct-to-consumer market share
         who originate mortgages with us

                                      15%    15%
                               14%                                              8%      8%
                                                                          7%
                      11%                                  6%     6%
              10%                                   5%
       9%


      3Q06    4Q06    1Q07     2Q07   3Q07   4Q07   3Q06   4Q06   1Q07   2Q07   3Q07   4Q07
     Purchase mortgages only


32
Consumer Credit

     Countrywide


                   SHOW SUCCESS OF BUSINESS


33
Positioned for Success

     • Differentiators
        –   Strong balance sheet and liquidity
        –   Unparalleled distribution
        –   Leading positions in key products
        –   Diverse income sources
        –   Most recognized brand

     • Managing near-term challenges
        – Economic pressure
        – Housing market

     • Solid business trends: deposits and consumer lending

     • Investing in growth opportunities
        –   Deposits and debit card
        –   Consumer lending
        –   Distribution network
        –   Mass affluent segment and affinity banking


34
UBS Global Financial Services Conference

More Related Content

UBS Global Financial Services Conference

  • 1. Bank of America Global Consumer & Small Business Banking Liam McGee President, Global Consumer & Small Business Banking UBS Financial Services May 13, 2008
  • 2. Forward Looking Statements This presentation contains forward-looking statements, including statements about the financial conditions, results of operations and earnings outlook of Bank of America Corporation. The forward-looking statements involve certain risks and uncertainties. Factors that may cause actual results or earnings to differ materially from such forward-looking statements include, among others, the following: 1) projected business increases following process changes and other investments are lower than expected; 2) competitive pressure among financial services companies increases significantly; 3) general economic conditions are less favorable than expected; 4) political conditions including the threat of future terrorist activity and related actions by the United States abroad may adversely affect the company’s businesses and economic conditions as a whole; 5) changes in the interest rate environment reduce interest margins and impact funding sources; 6) changes in foreign exchange rates increases exposure; 7) changes in market rates and prices may adversely impact the value of financial products; 8) legislation or regulatory environments, requirements or changes adversely affect the businesses in which the company is engaged; 9) changes in accounting standards, rules or interpretations, 10) litigation liabilities, including costs, expenses, settlements and judgments, may adversely affect the company or its businesses; 11) mergers and acquisitions and their integration into the company; and 12) decisions to downsize, sell or close units or otherwise change the business mix of any of the company. For further information regarding Bank of America Corporation, please read the Bank of America reports filed with the SEC and available at www.sec.gov. 2
  • 3. Positioned for Success • Differentiators – Strong balance sheet and liquidity – Unparalleled distribution – Leading positions in key products – Diverse income sources – Most recognized brand • Managing near-term challenges – Economic pressure – Housing market • Solid business trends: deposits and consumer lending • Investing in growth opportunities – Deposits and debit card – Consumer lending – Distribution network – Mass affluent segment and affinity banking 3
  • 4. Differentiators Unparalleled Franchise Leader in Customer Relationships • 59 million consumer and small business households • 78% of U.S. population in footprint • 87% of diverse HHs in footprint Leader in Distribution • 15 of 20 fastest growing states • 17%+ retail deposit market share in top 30 markets • 6,100 banking centers, 18,500 ATMs • #1 Online and Mobile Banking Leader in Brand • Recently named the #1 global financial services brand 4
  • 5. Differentiators Leader in Cornerstone Products Deposits • 14% Retail deposit market share Credit & Debit Home Lending Card • 20% US credit card market share • 8% Direct to consumer mortgage market share • 17% UK credit card market share • 11% Home equity market share • 17% debit card market share 5 Debit share as of 2006, all other share data as of Q4 07
  • 6. Differentiators Business Mix (in millions) 2007 Net Income Deposits Card Services $5,227 $3,712 56% 39% Consumer ALM/Other Real Estate $120 $371 1% 4% 6
  • 7. Differentiators Geographic Diversity 1 Retail Deposit Share 28% 25% 24% 24% 23% 23% 23% 21% 17% 17% 16% 15% 12% 10% 10% 4% hia s co ele DC o it go ork ton ore nix llas n ta i le am tro ieg elp st o cis att an ica ng oe wY us ltim Da De Mi nD ilad ran Bo Se Atl sA Ch Ph Ho Ba Ne nF Sa Ph Lo Sa 1 Source: June 2007 FDIC /(MSA defined geographies) 7 Chicago and Detroit include the impact of the LaSalle acquisition
  • 8. Differentiators Positioned to Capture Growth United States Source: “Retail Banking: Facing the Future” 8 Boston Consulting Group, November 2007
  • 9. Navigating the Current Environment 9
  • 10. Current Environment • View of economy • Economic cycle • Impact on Bank of America customers and businesses 10
  • 11. Current Environment Changing Trends in Consumer Purchasing Total Debit and Credit Purchase Volume YoY Growth of Necessary vs. Discretionary Spend per Account (Proforma, in $Bns) Necessary R 12.3% CAG 13.3% $412 $384 $327 $190 $169 Debit 7.6% $142 Credit Total 4.4% $215 $222 $185 $102 3.7% 3.4% $50 Discretionary $52 0.5% FY05 FY06 FY07 Q1 08 Q1 07 Q2 07 Q3 07 Q4 07 Q1 08 • Total volume growth continues to show stable, long-term growth • Spending on necessities has increased dramatically in the last two quarters driven by higher fuel and food prices CAGR for Debit is 15.6% and CAGR for Credit Card is 9.6%. Both include LaSalle 11 Necessary includes Fuel, Grocery and Utilities (which also includes Phone and Cable) Discretionary includes Retail, Travel and Entertainment and Services
  • 13. Current Environment Select Portfolio Characteristics – 1Q08 Residential Mortgage - $266 billion Average refreshed FICO 734 Average refreshed LTV 62% More than 90% refreshed LTV 10% Performing well against the environment and peer comparisons Residential mortgage trended statistics 1Q07 2Q07 3Q07 4Q07 1Q08 30+ DPD % 1.02% 1.18% 1.44% 1.64% 1.56% Net c/o % 0.01% 0.02% 0.02% 0.04% 0.10% Allowance for credit losses 0.10% 0.07% 0.07% 0.08% 0.15% 13
  • 14. Current Environment Select Portfolio Characteristics – 1Q08 Managed Consumer Credit Card - $184 billion Average refresehed FICO 685 Performing well but experiencing upward loss pressure centered in housing depressed states Managed consumer credit card trended statistics 1Q07 2Q07 3Q07 4Q07 1Q08 30+ DPD % 5.32% 5.08% 5.24% 5.45% 5.61% Net loss % 4.73% 5.02% 4.67% 4.75% 5.19% Allowance for credit losses 4.99% 4.69% 4.32% 4.16% 4.81% US and foreign consumer card excluding business 14
  • 15. Current Environment Select Portfolio Characteristics – 1Q08 Home equity - $ 118 billion Average refreshed FICO 717 Average refreshed CLTV 74% More than 90% refreshed CLTV 26% Rising losses driven by high CLTV and concentration in housing depressed states Home equity trended statistics 1Q07 2Q07 3Q07 4Q07 1Q08 30+ DPD % 0.64% 0.72% 0.96% 1.26% 1.33% Net c/o % 0.08% 0.12% 0.20% 0.63% 1.71% Allowance for credit losses 0.16% 0.26% 0.40% 0.84% 2.15% 15
  • 16. Current Environment Housing Affected Geographies Driving Losses • Combined loan to value of more than 90%, on a refreshed basis, represents: – 26% of outstanding balances – 82% of 1Q08 net charge-offs • In 1Q08 California and Florida combined represent: – 40% of outstandings – 52% of delinquencies – 62% of charge-offs 16
  • 17. Current Environment Select Portfolio Characteristics – 1Q08 Small Business - $ 20 billion Rising losses driven by weakened economy and earlier vintages Credit card represents approximately half the portfolio Small business trended statistics 1Q07 2Q07 3Q07 4Q07 1Q08 30+ DPD % 3.70% 3.96% 4.58% 5.29% 6.09% Net c/o % 4.20% 4.80% 5.38% 5.82% 7.21% Allowance for credit losses 4.29% 5.34% 6.44% 7.02% 10.11% 17
  • 18. Current Environment Lending Strategy Consistent but Evolving • Near-term management – Tightened underwriting standards – Significantly reduced LTVs with particular focus on housing stressed markets – Managing lines aggressively – Expanding customer assistance and collections 18
  • 19. Deposits, Credit Card and Consumer Real Estate 19
  • 20. Deposits New Relationships and Balance Growth Deposit Household Growth (GAAP, in MMs) Average Retail Balances & Spreads (GAAP, $Bns) Consumer Market Market Share: 26.5% 27.5% 29.2% 29.1% Share: 14.1% 13.2% 13.0% 13.9% 14.0% AGR 6.2% C GR 5.9% CA 3.3 3.3 3.0 2.7 $521 $482 $509 $444 $463 24.0 23.8 22.1 21.1 2.64% 2.85% 2.76% 2.55% 2.10% FY05 FY06 FY07 Q1 08 FY05 FY06 FY07 Q407 Q108 Consumer Small Business Balances Margin CAGR reflects Q1‘05 to Q1‘08 average retail balances. HH market share based on Claritas, Q108 based on estimate 20 Balance market share based on FDIC Summary of Deposits, Q108 based on estimate Both market shares based on BAC retail footprint
  • 21. Deposits Managing for Growth and Profitability BAC Deposits Growth vs. Industry (Proforma) 10.8% 10.1% BAC Industry Fed Funds Rate 7.0% 6.1% 5.8% 4.6% 3.0% 2.3% 1.0% 0.9% 1.2% -0.7% 2004 2005 2006 2007 4Q07 1Q08 BAC growth vs. Industry is based on data from the Federal Reserve. 21 Proforma for MBNA
  • 22. Deposits Continuing Success in Revenue and Earnings (in billions) Earnings for GCSBB Deposits Fee Income C AGR CAG R 8.5% 11.6% $8.2 $7.2 $2.2 $17.6 $6.5 $16.7 $1.9 $14.9 $1.6 Debit Card 11.3% Service Charges CAGR $8.4 $7.7 $6.0 $6.7 $5.3 $5.0 $2.1 $0.6 $4.1 $1.6 $1.6 FY05 FY06 FY07 Q108 FY05 FY06 FY07 Q108 Revenue NIBT 22 Deposits Revenue and NIBT exclude residual net interest income
  • 23. Deposits Deposits: Stable and Low Cost Funding Source Non-Interest Bearing Deposits Blended Rate Paid on as % of Total Deposits Total Deposits 30% 2.91 26% 2.28 2.27 21% 1.44 18% 1Q-06 2Q-06 3Q-06 4Q-06 1Q-07 2Q-07 3Q-07 4Q-07 1Q-06 2Q-06 3Q-06 4Q-06 1Q-07 2Q-07 3Q-07 4Q-07 Bank of America Basket of Competitors 23 Competitor information is based on 10Q releases of 20 national and regional banks
  • 24. Deposits Mass Affluent: Opportunity for Future Growth Segmentation of Retail Deposit HHs 75% % of BAC HHs Share of Deposits Wallet 75% • Mass affluent customers account for 23% of deposit 43% households. • They hold more than $500 billion 20% off-us deposits. 10% 13% 10% 1% <$100K $100K-500K $500K - $3MM $3MM+ Household Investable Assets Based on internal data and analysis of off-us deposits as of June 2007 Retail Deposits based on FDIC-insured; Money funds and non-insured portion of Jumbo CDs not 24 included Consumer deposits only, excludes small business products and households.
  • 25. Consumer Credit Consumer Credit: Strength With Room for Growth Total Credit of Bank of America Customers $463B $549B $4,129B $78B $5,219B $4.6 trillion 68% 74% opportunity 82% 91% 88% within existing deposit customer base 32% 26% 18% 12% 9% Credit Card Home Equity Mortgage Unsecured Total Credit On Us Off Us 25 Data source: LEVER as of 4Q07
  • 26. Consumer Credit Credit Card Business Positioned to Grow • World class products • Broader distribution capabilities • Affinity marketing 26
  • 27. Consumer Credit Superior Product Suite Non Rewards Rewards Customer Affluent Offerings Teachers Special Interest Sports 27 Alumni
  • 28. Consumer Credit Affinity Partnerships Are Growing • New products, distribution and marketing create new growth opportunities with longstanding partners • Affinity portfolio continues to demonstrate superior credit quality Launch Recent Success NEA 1983 41% consumer loan growth since 2005 27% increase in new card acquisition over 2006 Ducks Unlimited 1986 20% card loan growth Tripled new account acquisition year-over-year GMAC 2004 49% card loan growth 43% increase in new card accounts 28
  • 29. Consumer Credit Affinity Banking: A Growing New Distribution Channel • 20% of all new deposit accounts are affinity related • More than 160 signed groups representing more than 120 million names • Launched 125 groups, including – All 30 MLB teams – NFL brand and 4 teams – NASCAR and 9 drivers – Habitat for Humanity • Endorsed products include credit card, checking, debit, money market, CD and savings 29
  • 30. Consumer Credit Leveraging Channel Diversity to Balance Growth and Profitability 18% $300 16% $250 14% 12% 10.5% 9.9% $200 10% 9.6% $150 8% 7.1% 5.7% 6% $100 3.9% 4% $50 2% 0% $0 Stores/Online Customer Direct Affinity/Cobrand Mail Direct Mail Yr2 NCL 5 Yr Avg RAM Cost to Acquire (Pre-Tax) 30
  • 31. Consumer Credit Consumer Real Estate • Cornerstone relationship products • Direct to Consumer approach • Countrywide SHOW SUCCESS OF BUSINESS 31
  • 32. Consumer Credit Mortgage: Growing Relationship Share Percentage of BAC deposit customers BAC direct-to-consumer market share who originate mortgages with us 15% 15% 14% 8% 8% 7% 11% 6% 6% 10% 5% 9% 3Q06 4Q06 1Q07 2Q07 3Q07 4Q07 3Q06 4Q06 1Q07 2Q07 3Q07 4Q07 Purchase mortgages only 32
  • 33. Consumer Credit Countrywide SHOW SUCCESS OF BUSINESS 33
  • 34. Positioned for Success • Differentiators – Strong balance sheet and liquidity – Unparalleled distribution – Leading positions in key products – Diverse income sources – Most recognized brand • Managing near-term challenges – Economic pressure – Housing market • Solid business trends: deposits and consumer lending • Investing in growth opportunities – Deposits and debit card – Consumer lending – Distribution network – Mass affluent segment and affinity banking 34