Location via proxy:   [ UP ]  
[Report a bug]   [Manage cookies]                
SlideShare a Scribd company logo
UNITEDHEALTH GROUP
                                        Reconciliation of Non-GAAP Measures
                                    Quarter and Full Year Ended December 31, 2008

 - Operating Results Excluding Special Items
 - Adjusted Cash Flows from Operating Activities and Ratio of Adjusted Cash Flows from
      Operating Activities to Adjusted Net Earnings


                                                                                            Use of Non-GAAP Financial Measures

Operating results excluding special items and adjusted cash flows from operating activities as used in the press release are not calculated in accordance with GAAP and should not be considered a substitute for or superior to
financial measures calculated in accordance with GAAP. Management believes that the use of each of these non-GAAP financial measures improves the comparability of our results between periods. These financial
measures provide investors and our management with useful information to measure and forecast our results of operations, to compare on a consistent basis our results of operations for the current period to that of prior
periods, and to compare our results of operations on a more consistent basis against that of other companies in the health care industry.

These non-GAAP financial measures have limitations in that they do not reflect all of the special items or certain cash payments associated with the operations of our business as determined in accordance with GAAP. As a
result, one should not consider these measures in isolation. We compensate for these limitations by analyzing current and future results on a GAAP basis as well as non-GAAP basis, disclosing these GAAP financial
measures, and providing a reconciliation from GAAP to non-GAAP financial measures.
UNITEDHEALTH GROUP
                                                                                                  Reconciliation of Non-GAAP Measures
                                                                                                Operating Results Excluding Special Items
                                                                                            (in millions, except per share data and percentages)
                                                                                                                  (unaudited)

                                                                                                  Quarter Ended December 31, 2008                                                Quarter Ended September 30, 2008
                                                                                                                                                                                           Non-GAAP
                                                                              Consolidated GAAP              Non-GAAP                   Operating Results          Consolidated GAAP      Reconciling        Operating Results
                                                                                  Reporting               Reconciling Items             Excluding Items (a)            Reporting             Items          Excluding Items (b)
    REVENUES
                                                                              $              18,581       $                   -     $                 18,581       $               18,294       $                 -     $                  18,294
    Premiums
                                                                                              1,295                                                    1,295                        1,287                                                   1,287
    Services                                                                                                                  -                                                                                   -
                                                                                                469                                                      469                          432                                                     432
    Products                                                                                                                  -                                                                                   -
                                                                                                109                                                      109                          143                                                     143
    Investment and Other Income                                                                                               -                                                                                   -

                                                                                             20,454                           -                       20,454                       20,156                         -                        20,156
        Total Revenues

    OPERATING COSTS
                                                                                             15,015                          -                        15,015                       14,943                        -                         14,943
    Medical Costs
                                                                                              3,486                       (340)                        3,146                        2,974                       40                          3,014
    Operating Costs
                                                                                                415                          -                           415                          387                        -                            387
    Cost of Products Sold
                                                                                                259                          -                           259                          254                        -                            254
    Depreciation and Amortization

                                                                                             19,175                       (340)                       18,835                       18,558                       40                         18,598
        Total Operating Costs

    EARNINGS FROM OPERATIONS                                                                   1,279                       340                          1,619                       1,598                       (40)                         1,558

                                                                                                (155)                         -                          (155)                       (166)                        -                              (166)
    Interest Expense

    EARNINGS BEFORE INCOME TAXES                                                               1,124                       340                          1,464                       1,432                       (40)                         1,392

                                                                                                (398)                     (125)                          (523)                       (512)                      15                               (497)
    Provision for Income Taxes

    NET EARNINGS                                                              $                  726      $                215      $                     941      $                  920       $               (25)    $                        895

    DILUTED NET EARNINGS PER COMMON SHARE                                     $                 0.60      $               0.18      $                    0.78      $                 0.75       $            (0.02)     $                        0.73

    Diluted Weighted-Average Common Shares Outstanding                                         1,213                                                    1,213                       1,227                                                    1,227

    Medical Care Ratio                                                                         80.8%                                                    80.8%                       81.7%                                                    81.7%
    Operating Cost Ratio                                                                       17.0%                                                    15.4%                       14.8%                                                    15.0%
    Operating Margin                                                                            6.3%                                                     7.9%                        7.9%                                                     7.7%
    Income Tax Rate                                                                            35.4%                                                    35.7%                       35.8%                                                    35.7%

(a) Excludes pre-tax Operating Costs of $350 million for settlement of class action litigation related to reimbursement for out-of-network medical services, partially offset by a net reduction in pre-tax Operating Costs of $10 million for
    insurance recoveries and legal fees related to various matters.

(b) Excludes a reduction in pre-tax Operating Costs of $40 million from a change in estimated net costs to settle two class action lawsuits related to the Company's historical stock option practices.
UNITEDHEALTH GROUP
                                                                                                 Reconciliation of Non-GAAP Measures
                                                                                               Operating Results Excluding Special Items
                                                                                           (in millions, except per share data and percentages)
                                                                                                                 (unaudited)

                                                                                              Year Ended December 31, 2008                                                          Year Ended December 31, 2007
                                                                                                      Non-GAAP                                                                             Non-GAAP
                                                                              Consolidated GAAP      Reconciling        Operating Results                           Consolidated GAAP     Reconciling        Operating Results
                                                                                  Reporting             Items          Excluding Items (a)                              Reporting            Items           Excluding Items (b)
    REVENUES
                                                                               $              73,608        $                 -     $                  73,608        $              68,781      $                   -   $                        68,781
    Premiums
                                                                                               5,152                                                    5,152                        4,608                                                        4,608
    Services                                                                                                                  -                                                                                     -
                                                                                               1,655                                                    1,655                          898                                                          898
    Products                                                                                                                  -                                                                                     -
                                                                                                 771                                                      771                        1,144                                                        1,144
    Investment and Other Income                                                                                               -                                                                                     -

                                                                                              81,186                          -                        81,186                       75,431                          -                            75,431
        Total Revenues

    OPERATING COSTS
                                                                                              60,359                         -                         60,359                       55,435                       -                               55,435
    Medical Costs
                                                                                              13,103                    (1,083)                        12,020                       10,583                    (176)                              10,407
    Operating Costs
                                                                                               1,480                         -                          1,480                          768                       -                                  768
    Cost of Products Sold
                                                                                                 981                         -                            981                          796                       -                                  796
    Depreciation and Amortization

                                                                                              75,923                    (1,083)                        74,840                       67,582                    (176)                              67,406
        Total Operating Costs

    EARNINGS FROM OPERATIONS                                                                   5,263                     1,083                           6,346                       7,849                     176                                8,025

                                                                                                 (639)                        -                           (639)                        (544)                    -                                  (544)
    Interest Expense

    EARNINGS BEFORE INCOME TAXES                                                               4,624                     1,083                           5,707                       7,305                     176                                7,481

                                                                                               (1,647)                    (400)                         (2,047)                     (2,651)                     (64)                             (2,715)
    Provision for Income Taxes

    NET EARNINGS                                                               $               2,977        $              683      $                    3,660       $               4,654      $              112      $                         4,766

    DILUTED NET EARNINGS PER COMMON SHARE                                      $                 2.40       $             0.55      $                     2.95       $                 3.42     $             0.08      $                          3.50

    Diluted Weighted-Average Common Shares Outstanding                                         1,241                                                     1,241                       1,361                                                        1,361

    Medical Care Ratio                                                                         82.0%                                                     82.0%                       80.6%                                                        80.6%
    Operating Cost Ratio                                                                       16.1%                                                     14.8%                       14.0%                                                        13.8%
    Operating Margin                                                                            6.5%                                                      7.8%                       10.4%                                                        10.6%
    Income Tax Rate                                                                            35.6%                                                     35.9%                       36.3%                                                        36.3%

(a) Excludes pre-tax Operating Costs of $350 million for settlement of class action litigation related to reimbursement for out-of-network medical services, partially offset by a net reduction in pre-tax Operating Costs of $10 million for
    insurance recoveries and legal fees related to various matters, and pre-tax Operating Costs from prior quarters of $882 million for settlement of two class action lawsuits and related legal costs, $46 million for employee severance related
    to operating cost reduction initiatives and other items, partially offset by a $185 million reduction in Operating Costs for proceeds from the sale of certain assets and membership in the individual Medicare Advantage business in Nevada.


(b) Excludes $87 million of Operating Costs for the settlement of Internal Revenue Code Section 409A (IRS Section 409A) surtax liabilities on behalf of non-officer employees who exercised certain options in 2006 and 2007, and $89 million
    of non-cash Operating Costs for the modification charge due to repricing unexercised options subject to IRS Section 409A.
UNITEDHEALTH GROUP
                                     Reconciliation of Non-GAAP Measures
                 Adjusted Cash Flows from Operating Activities and Ratio of Adjusted Cash Flows
                               from Operating Activities to Adjusted Net Earnings
                                                   (in billions)
                                                   (unaudited)

                                                                                                   Year Ended
                                                                                                December 31, 2008
                                                                                                $               4.2
GAAP Cash Flows From Operating Activities
                                                                                                                0.6 (a)
Legal Settlement Payments, net of tax benefit
Adjusted Cash Flows From Operating Activities (a)                                               $               4.8
GAAP Net Earnings                                                                                $              3.0
Adjusted Net Earnings                                                                            $              3.7
Ratio of Cash Flows From Operating Activities to Net Earnings                                                   1.4
Ratio of Adjusted Cash Flows From Operating Activities to Adjusted Net Earnings                                 1.3

   (a) Adjusted Cash Flows From Operating Activities for the year ended December 31, 2008 excludes net cash payments to settle two class
       action lawsuits related to the Company's historical stock option practices.

More Related Content

United Health Group Reconciliation of Non-GAAP Financial Measures

  • 1. UNITEDHEALTH GROUP Reconciliation of Non-GAAP Measures Quarter and Full Year Ended December 31, 2008 - Operating Results Excluding Special Items - Adjusted Cash Flows from Operating Activities and Ratio of Adjusted Cash Flows from Operating Activities to Adjusted Net Earnings Use of Non-GAAP Financial Measures Operating results excluding special items and adjusted cash flows from operating activities as used in the press release are not calculated in accordance with GAAP and should not be considered a substitute for or superior to financial measures calculated in accordance with GAAP. Management believes that the use of each of these non-GAAP financial measures improves the comparability of our results between periods. These financial measures provide investors and our management with useful information to measure and forecast our results of operations, to compare on a consistent basis our results of operations for the current period to that of prior periods, and to compare our results of operations on a more consistent basis against that of other companies in the health care industry. These non-GAAP financial measures have limitations in that they do not reflect all of the special items or certain cash payments associated with the operations of our business as determined in accordance with GAAP. As a result, one should not consider these measures in isolation. We compensate for these limitations by analyzing current and future results on a GAAP basis as well as non-GAAP basis, disclosing these GAAP financial measures, and providing a reconciliation from GAAP to non-GAAP financial measures.
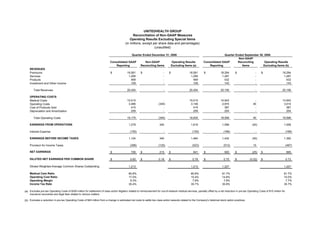
  • 2. UNITEDHEALTH GROUP Reconciliation of Non-GAAP Measures Operating Results Excluding Special Items (in millions, except per share data and percentages) (unaudited) Quarter Ended December 31, 2008 Quarter Ended September 30, 2008 Non-GAAP Consolidated GAAP Non-GAAP Operating Results Consolidated GAAP Reconciling Operating Results Reporting Reconciling Items Excluding Items (a) Reporting Items Excluding Items (b) REVENUES $ 18,581 $ - $ 18,581 $ 18,294 $ - $ 18,294 Premiums 1,295 1,295 1,287 1,287 Services - - 469 469 432 432 Products - - 109 109 143 143 Investment and Other Income - - 20,454 - 20,454 20,156 - 20,156 Total Revenues OPERATING COSTS 15,015 - 15,015 14,943 - 14,943 Medical Costs 3,486 (340) 3,146 2,974 40 3,014 Operating Costs 415 - 415 387 - 387 Cost of Products Sold 259 - 259 254 - 254 Depreciation and Amortization 19,175 (340) 18,835 18,558 40 18,598 Total Operating Costs EARNINGS FROM OPERATIONS 1,279 340 1,619 1,598 (40) 1,558 (155) - (155) (166) - (166) Interest Expense EARNINGS BEFORE INCOME TAXES 1,124 340 1,464 1,432 (40) 1,392 (398) (125) (523) (512) 15 (497) Provision for Income Taxes NET EARNINGS $ 726 $ 215 $ 941 $ 920 $ (25) $ 895 DILUTED NET EARNINGS PER COMMON SHARE $ 0.60 $ 0.18 $ 0.78 $ 0.75 $ (0.02) $ 0.73 Diluted Weighted-Average Common Shares Outstanding 1,213 1,213 1,227 1,227 Medical Care Ratio 80.8% 80.8% 81.7% 81.7% Operating Cost Ratio 17.0% 15.4% 14.8% 15.0% Operating Margin 6.3% 7.9% 7.9% 7.7% Income Tax Rate 35.4% 35.7% 35.8% 35.7% (a) Excludes pre-tax Operating Costs of $350 million for settlement of class action litigation related to reimbursement for out-of-network medical services, partially offset by a net reduction in pre-tax Operating Costs of $10 million for insurance recoveries and legal fees related to various matters. (b) Excludes a reduction in pre-tax Operating Costs of $40 million from a change in estimated net costs to settle two class action lawsuits related to the Company's historical stock option practices.
  • 3. UNITEDHEALTH GROUP Reconciliation of Non-GAAP Measures Operating Results Excluding Special Items (in millions, except per share data and percentages) (unaudited) Year Ended December 31, 2008 Year Ended December 31, 2007 Non-GAAP Non-GAAP Consolidated GAAP Reconciling Operating Results Consolidated GAAP Reconciling Operating Results Reporting Items Excluding Items (a) Reporting Items Excluding Items (b) REVENUES $ 73,608 $ - $ 73,608 $ 68,781 $ - $ 68,781 Premiums 5,152 5,152 4,608 4,608 Services - - 1,655 1,655 898 898 Products - - 771 771 1,144 1,144 Investment and Other Income - - 81,186 - 81,186 75,431 - 75,431 Total Revenues OPERATING COSTS 60,359 - 60,359 55,435 - 55,435 Medical Costs 13,103 (1,083) 12,020 10,583 (176) 10,407 Operating Costs 1,480 - 1,480 768 - 768 Cost of Products Sold 981 - 981 796 - 796 Depreciation and Amortization 75,923 (1,083) 74,840 67,582 (176) 67,406 Total Operating Costs EARNINGS FROM OPERATIONS 5,263 1,083 6,346 7,849 176 8,025 (639) - (639) (544) - (544) Interest Expense EARNINGS BEFORE INCOME TAXES 4,624 1,083 5,707 7,305 176 7,481 (1,647) (400) (2,047) (2,651) (64) (2,715) Provision for Income Taxes NET EARNINGS $ 2,977 $ 683 $ 3,660 $ 4,654 $ 112 $ 4,766 DILUTED NET EARNINGS PER COMMON SHARE $ 2.40 $ 0.55 $ 2.95 $ 3.42 $ 0.08 $ 3.50 Diluted Weighted-Average Common Shares Outstanding 1,241 1,241 1,361 1,361 Medical Care Ratio 82.0% 82.0% 80.6% 80.6% Operating Cost Ratio 16.1% 14.8% 14.0% 13.8% Operating Margin 6.5% 7.8% 10.4% 10.6% Income Tax Rate 35.6% 35.9% 36.3% 36.3% (a) Excludes pre-tax Operating Costs of $350 million for settlement of class action litigation related to reimbursement for out-of-network medical services, partially offset by a net reduction in pre-tax Operating Costs of $10 million for insurance recoveries and legal fees related to various matters, and pre-tax Operating Costs from prior quarters of $882 million for settlement of two class action lawsuits and related legal costs, $46 million for employee severance related to operating cost reduction initiatives and other items, partially offset by a $185 million reduction in Operating Costs for proceeds from the sale of certain assets and membership in the individual Medicare Advantage business in Nevada. (b) Excludes $87 million of Operating Costs for the settlement of Internal Revenue Code Section 409A (IRS Section 409A) surtax liabilities on behalf of non-officer employees who exercised certain options in 2006 and 2007, and $89 million of non-cash Operating Costs for the modification charge due to repricing unexercised options subject to IRS Section 409A.
  • 4. UNITEDHEALTH GROUP Reconciliation of Non-GAAP Measures Adjusted Cash Flows from Operating Activities and Ratio of Adjusted Cash Flows from Operating Activities to Adjusted Net Earnings (in billions) (unaudited) Year Ended December 31, 2008 $ 4.2 GAAP Cash Flows From Operating Activities 0.6 (a) Legal Settlement Payments, net of tax benefit Adjusted Cash Flows From Operating Activities (a) $ 4.8 GAAP Net Earnings $ 3.0 Adjusted Net Earnings $ 3.7 Ratio of Cash Flows From Operating Activities to Net Earnings 1.4 Ratio of Adjusted Cash Flows From Operating Activities to Adjusted Net Earnings 1.3 (a) Adjusted Cash Flows From Operating Activities for the year ended December 31, 2008 excludes net cash payments to settle two class action lawsuits related to the Company's historical stock option practices.