


U.S. Inflation Indicators Come in Below Target as the Global Economy Begins to Slow
- 1. Data for the Classroom from Ed Dolan’s Econ Blog http://dolanecon.blogspot.com/ US Price Data: Major Inflation Indicators Run Below Target in December Posted Jan 19, 2012 Terms of Use: These slides are made available under Creative Commons License Attribution— Share Alike 3.0 . You are free to use these slides as a resource for your economics classes together with whatever textbook you are using. If you like the slides, you may also want to take a look at my textbook, Introduction to Economics, from BVT Publishers.
- 2. Headline CPI Shows Little Change in December The US all-items CPI showed little change in December, as the World Bank released a new forecast of slowing global economic growth The December headline inflation rate from the Bureau of Labor Statistics showed zero change Unrounded, December inflation stated as an annual rate was 0.12% For the third month in a row, falling prices for gasoline and other forms of energy helped keep inflation low Posted January 19, 2012 on Ed Dolan’s Econ Blog http://dolanecon.blogspot.com
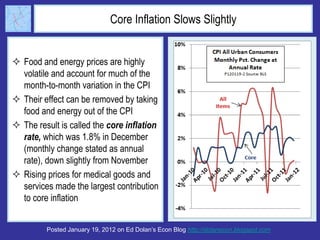
- 3. Core Inflation Slows Slightly Food and energy prices are highly volatile and account for much of the month-to-month variation in the CPI Their effect can be removed by taking food and energy out of the CPI The result is called the core inflation rate, which was 1.8% in December (monthly change stated as annual rate), down slightly from November Rising prices for medical goods and services made the largest contribution to core inflation Posted January 19, 2012 on Ed Dolan’s Econ Blog http://dolanecon.blogspot.com
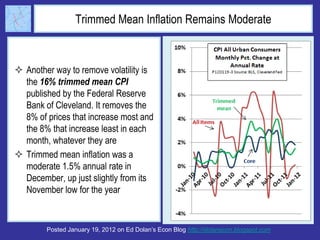
- 4. Trimmed Mean Inflation Remains Moderate Another way to remove volatility is the 16% trimmed mean CPI published by the Federal Reserve Bank of Cleveland. It removes the 8% of prices that increase most and the 8% that increase least in each month, whatever they are Trimmed mean inflation was a moderate 1.5% annual rate in December, up just slightly from its November low for the year Posted January 19, 2012 on Ed Dolan’s Econ Blog http://dolanecon.blogspot.com
- 5. Which Measure is Best? The CPI for all items gives the most accurate picture of current changes in the cost of living Economists at the Fed look closely at the core and trimmed mean CPIs to judge the effect of monetary policy on underlying inflationary trends The Fed considers inflation of about 2 percent to be consistent with prudent monetary policy All three measures of inflation were below the Fed’s implicit 2% target in December Posted January 19, 2012 on Ed Dolan’s Econ Blog http://dolanecon.blogspot.com
- 6. The Longer Term Trend To see longer term trends in inflation, it is useful to look at year- on-year changes, which compare each month’s price level with that of the same month in the year before All y-o-y measures of inflation rates slowed during the global recession. They rose for most of 2011, but are now beginning to fall again as the base for y-o-y comparisons moves away from the extremely low monthly rates of 2010 Posted January 19, 2012 on Ed Dolan’s Econ Blog http://dolanecon.blogspot.com