User-centred Development of a Clinical Decision-support System for Breast Cancer Diagnosis and Reporting based on Stroke Gestures

See the paper at https://www.scitepress.org/Link.aspx?doi=10.5220/0010258900600071 We conducted a user-centered design of a clinical decision-support system for breast cancer screening, diagnosis, and reporting based on stroke gestures. We combined knowledge elicitation interviews, scenario-focused questionnaires, and paper mock-ups to understand user needs. Multi-fidelity (low and high) prototypes were designed and compared first in vitro in a usability laboratory, then in vivo in the real world. The resulting user interface provides radiologists with a platform that integrates domain-oriented tools for the visualization of mammograms, the manual, and the semi-automatic annotation of breast cancer findings based on stroke gestures. The contribution of this work lies in that, to the best of our knowledge, stroke gestures have not yet been applied to the annotation of mammograms. On the one hand, although there is a substantial amount of research done in stroke-based interaction, none focuses especially on the domain of breast cancer annotation. On the other hand, typical gestures in breast cancer annotation tools are those with a keyboard and a mouse


User-centred Development of a Clinical Decision-support System for Breast Cancer Diagnosis and Reporting based on Stroke Gestures
- 1. User-Centered Development of a Clinical Decision-Support System for Breast Cancer Diagnosis and Reporting based on Stroke Gestures Suzanne Kieffer1, Annabelle Gouze 2 & Jean Vanderdonckt1 1 Université catholique de Louvain, Belgium 2 EVS Broadcast Equipment, Belgium
- 2. Support breast cancer screening and diagnosis • Breast cancer (BC) is the most common cancer among women; its early detection improves both treatment and recovery • Advances in image processing allow the development of clinical decision support system (CDSS) or computer-aided diagnosis (CAD) systems, which help detect missed findings • Highlighting lesions with markers such as crosses, triangles, or squares • Discriminating findings into benign and malignant lesions
- 3. Problems with BC-CAD tools • Radiologists deplore three main issues 1. They are not integrated in a unique system 2. They do not enable the standardized annotation of findings 3. They do not provide any means to interact with the CAD data • BC-CAD data are incomplete • Masses: segmented area, local contrast, perimeter and luminance • Clusters of calcifications: center location, number of calcifications and density • Microcalcifications: location, size, circularity, and local contrast HUCAPP 2021 -- Kieffer et al. 2021 3
- 4. Improve human labor during BC screening and diagnosis • Support the screening exam workflow • From image acquisition to reporting, including image screening, lesion detection, lesion analysis and interpretation • Report: complete and structured description of any significant finding, comparison to previous studies, overall diagnosis, follow-up recommendations • Use and improve image processing by integrating human knowledge • Segmentation process: partitioning a digital image into multiple segments (sets of pixels), which share certain characteristics such as color, intensity or texture • Relevant feedback technique: incorporate user feedback about the relevance of the results produced by the segmentation process HUCAPP 2021 -- Kieffer et al. 2021 4
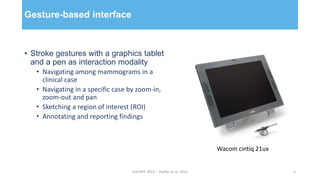
- 5. Gesture-based interface • Stroke gestures with a graphics tablet and a pen as interaction modality • Navigating among mammograms in a clinical case • Navigating in a specific case by zoom-in, zoom-out and pan • Sketching a region of interest (ROI) • Annotating and reporting findings HUCAPP 2021 -- Kieffer et al. 2021 5 Wacom cintiq 21ux
- 6. Human-centered approach as development methodology • User-centered design • Better understand user needs and expectations • Increase system usefulness and usability • Increase user acceptance and adoption • Methods • Knowledge elicitation interview • Paper-and-pencil evaluation • Formal usability testing HUCAPP 2021 -- Kieffer et al. 2021 6
- 7. Knowledge elicitation interviews Screening workflow 1. Selection of a case 2. Analysis of patient information 3. Screening of views: global, cranio- caudal (CC) projection, medio-lateral oblique (MLO) projection, and global again 4. In-depth screening of views to detect suspicious findings 5. Interpretation of findings 6. Briefing and reporting of results HUCAPP 2021 -- Kieffer et al. 2021 7
- 8. Knowledge elicitation interviews Need for a standardized representation of BC characteristics HUCAPP 2021 -- Kieffer et al. 2021 8
- 9. Paper-and-pencil prototypes Design and test ideas HUCAPP 2021 -- Kieffer et al. 2021 9
- 10. Paper-and-pencil prototypes • Test-and-refine design ideas within a formative process • Select and prioritize features worth implementing based on user-data reduce development time and costs • Collect additional domain- and task-relevant knowledge • Description of the tasks sequence • Issues regarding CB-CAD tools • Needs and expectations HUCAPP 2021 -- Kieffer et al. 2021 10
- 11. Formal usability tests Compare design solutions HUCAPP 2021 -- Kieffer et al. 2021 11
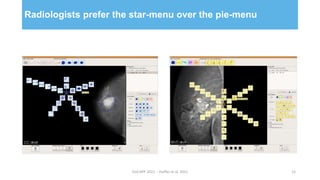
- 12. Radiologists prefer the star-menu over the pie-menu HUCAPP 2021 -- Kieffer et al. 2021 12
- 13. Relevance feedback: (a) Selection of a ROI ; (b) User feedback ; (c) Improved segmentation (“smooth over”) HUCAPP 2021 -- Kieffer et al. 2021 13
- 14. Masses: predefined features, feedbacks, iconic feedback representation and associated system actions HUCAPP 2021 -- Kieffer et al. 2021 14
- 15. Take-away • User-centered development of a clinical decision-support system for breast cancer diagnosis and reporting based on stroke gestures • Contributions • Improvement of the segmentation thanks to relevant feedback, allowing both manual and semiautomatic diagnosis Means to characterize any finding/lesion in compliance with the approved standard of the domain • Use of stroke gestures to annotate mammograms: research done in stroke-based interaction does not focus on BC annotation ; typical gestures in BC annotation tools are those with a keyboard and a mouse. HUCAPP 2021 -- Kieffer et al. 2021 15
- 16. Follow-up questions? • Segmentation: annabelle.gouze@gmail.com • User-centered approach: suzanne.kieffer@uclouvain.be HUCAPP 2021 -- Kieffer et al. 2021 16
Editor's Notes
- This work aims at supporting breast cancer screening and diagnosis. Breast cancer (BC) is the most common cancer among women; its early detection improves both treatment and recovery. Actually, 80 percent of the patients recover when the diagnostic is made early, in comparison with only 30 percent when not. Advances in image processing allow the development of clinical decision support systems (CDSS) or computer-aided diagnosis systems. CAD systems help detect missed findings by Highlighting lesions with markers such as crosses, triangles, or squares Discriminating findings into benign and malignant lesions
- So what are the problems with BC-CAD tools? Well, radiologists deplore three main issues. CAD-tools for BC are not integrated in unique system. So radiologists have to split their workflow between multiple tools, which significantly increases the risk of errors and reduces their productivity. CAD-tools for BC do not enable the standardized annotation of findings. This prevents efficient data exchange and storage. And this prevents the retrieval of useful and interesting cases for teaching and research purposes. CAD-tools for BC do not provide any means to interact with the CAD data. This significantly reduces system capabilities, and therefore system usability. In addition, BC-CAD data are incomplete. For example, regarding masses, additional features should include segmented areas, local contrast, perimeter and luminance. Similar reasoning holds for the clusters of calcifications and the microcalcifications.
- The goal of this work can be summarized as “improving human labor during BC screening and diagnosis”. To achieve this goal, we implemented the two following strategies. Support the screening exam workflow. The screening exam workflow ranges from… to… The outcome of the screening process is a report including the following sections: the complete… Use and improve image processing by integrating human knowledge. By image processing we mean segmentation. And segmentation refers to the partitioning of… We
- Selection of a case from the list of patients Analysis of the patient information Screening of views in the following sequence: global, CC, MLO and global again
- The KEI allowed us to better understand radiologist need for a standardized… To sum up, radiologists need to be able to characterize any lesion with a straightforward and unambiguous manner. So we developed a representation framework including 150 different icons. We used the Breast Imaging Reporting and Data System (BI-RADS) Atlas documented and published by the American College of Radiology to develop our icon framework. The same set of icons is used, no matter the type of lesion. So we used a color code to facilitate the discrimination between the findings: masses in blue, calcifications in yellow, architectural distortions in green, special cases in violet, and associated findings in orange. The color blue here indicates a mass.