Location via proxy:   [ UP ]  
[Report a bug]   [Manage cookies]                
SlideShare a Scribd company logo

1

PETROBRAS


      Conference Call / Webcast
          3rd Quarter 2006
      (Brazilian Corporate Law)


                                     Almir Barbassa
                   CFO and Investor Relations Officer
                               November, 13th 2006

                                                    0

2

PETROBRAS

Disclaimer

The presentation may contain forecasts about future events. Such forecasts
merely reflect the expectations of the Company's management. Such terms as
"anticipate", "believe", "expect", "forecast", "intend", "plan", "project", "seek",
"should", along with similar or analogous expressions, are used to identify such
forecasts. These predictions evidently involve risks and uncertainties, whether
foreseen or not by the Company. Therefore, the future results of operations may
differ from current expectations, and readers must not base their expectations
exclusively on the information presented herein. The Company is not obliged to
update the presentation/such forecasts in light of new information or future
developments.

Cautionary Statement for US investors

The United States Securities and Exchange Commission permits oil and gas
companies, in their filings with the SEC, to disclose only proved reserves that a
company has demonstrated by actual production or conclusive formation tests
to be economically and legally producible under existing economic and
operating conditions. We use certain terms in this presentation, such as oil and
gas resources, that the SEC’s guidelines strictly prohibit us from including in
filings with the SEC.


                                                                                      1

3

PETROBRAS
     Domestic oil and NGL production

                                         Δ = 3.1%
                                                              Δ = 1.3%
thousand bpd


                                                                            1,779         1.790
                                                                                          1.780
                                                              1,757                       1.770
                                              1,751                                       1.760
                                                                                          1.750
                              1,736
                  1,725                                                                   1.740
                                                                                          1.730
                                                                                          1.720
                                                                                          1.710
                                                                                          1.700
                 3Q05         4Q05            1Q06            2Q06            3Q06

    • 1.3% increase due to P-50 (Albacora Leste) and FPSO Capixaba (Golfinho) platforms performances,
      both recently started operations;
    • In the 3Q06, P-50’s contribution was around 18 thous. bpd above 2Q06 average, while FPSO
      Capixaba increased production around 8 thous. bpd in the same period.


                                                                                                        2

4

PETROBRAS
    E&P – Oil Prices
                                                                               69,62


                                                                                                 US$ 10.80 bbl
                                                                                         69,49

                                                                               64,74
                                                   61,53             61,75              66,07

                                                             56,9    57,59
                                                   56,39                                58,69
                                         51,59                                 58,2
US$/bbl


                               47,83               54,24     52,7     53,69
                      44,00              49,33
            41,59                                           46,05
                      39,70    44,19
                                           43,04
      38,98
                                 37,48
          36,14       35,11

            3T04      4T04     1T05      2T05      3T05      4T05     1T06     2T06     3T06
                        Average Sales Price        Brent (average)       Cesta OPEP


          • The spread between Brazilian oil and Brent decreased from US$ 11.42/bbl, in the
            2Q06, to US$ 10.80/bbl, in the 3Q06.


                                                                                                     3

5

PETROBRAS
 Domestic Lifting Costs without Government Participation
                                                     Δ = 8.5% or US$ 0.52

                                     6.32                    6.64
                           6.07                   6.12
  US$/bbl


                5.44


            3Q 05      4Q 05      1Q06      2Q06         3Q06

                                    Main Causes
• Higher expenditure in:
    • Transportation, seismic and drilling for wells intervention;
    • Corrective maintenances;
    • Higher costs due to initial operational phase in Albacora Leste and Golfinho
      fields.

                                                                                4

6

PETROBRAS
           Lifting Costs including Government Participation

      26                                                                                                                                                                  70
                                                                                         61,5                   56,9                               69,6        69,5
                                                                                51,6                                                                                      60
      21                                                        47,5                                                                61,8
                                                                                                                                               17.5            18.1       50
                                                38,2                                                                           17.3
                                                                                                15.2            16.1
      16                                                                                                                                                                  40
                                 28,8                            13.6           13.9


                                                                                                                                                       63%
US$/boe


                  24,8                                                                                                                                          11,5      30


                                                                                                                        63%
                                                  10.7                                                           10,0           11,0            11,4
      11
                                                                                                  9,7


                                                                                                         62%
                                                                   7,7             8,4


                                                                          59%
                                  8.5                                                                                                                                     20
                     7.0                           6,4
          6                                                                                                                                                               10
                               57%


                                     5,1
                    4,0
                                                                   6,0             5,4            5,4             6,1            6,3             6,1             6,6      0
                    3,0              3,4           4,3
          1
                                                                                                                                                                          -10
                   2002           2003            2004            1Q05           2Q05            3Q05           4Q05            1Q06            2Q06           3Q06
          -4                                                                                                                                                              -20

                                                                  Lifting Cost               Gov. Participation                    Brent


          • Government participation remained stable due to the stability of the Brent
            price, FX rate and production.


          Obs.: Lifting Cost w/ gov. part. series was adjusted (retroactive to 2002) due to new ANP interpretation of the expense deductibility for the Finance Project
          of Marlim Field, calculated as special participation.                                                                                                           5

7

PETROBRAS
Refining and Sales in the Domestic Market
                                                                  91                                                                                   95
                     2.400           91
                                                                                                                     93                                90
Thous. barrels/day


                                                                                              91
                     2.200                                                                                                                      89     85
                     2.000                                                                                                                             80
                                       80                                                     81                       80
                                                                   79                                                                           79     75


                                                                                                                                                            %
                     1.800
                                                                                                                                                       70
                     1.600
                                                                                                                                                       65
                                1.804 1.720                 1.761                                                                        1.753 1.757
                     1.400                                                             1.812                   1.795 1.684
                                                                       1.647                      1.649                                                60
                     1.200                                                                                                                             55
                     1.000                                                                                                                             50
                                     3Q05                        4Q05                       1Q06                   2Q06                       3Q06
                         D o m e s t ic o il pro duc t s pro duc t io n                                   O il pro duc t s s a le s v o lum e

                         P rim a ry pro c e s s e d ins t a lle d c a pa c it y - B ra zil ( %)           D o m e s t ic c rude a s % o f t o t a l


• 4 pp reduction in throughput due to:
      • Oil supply limitation;
      • More scheduled stoppages compared to 2Q06;
• 1 pp decrease in domestic crude participation in processed feedstock due to operational problems in Golfinho
  (less light oil) and increase spread between fuel oil and domestic heavy oil (more profitable to export).
• Increase in sales volume due to seasonality in agricultural diesel consumption, industrial fuel oil and
  substitution of imported naphtha.

                                                                                                                                                            6

8

PETROBRAS
Domestic Refining Costs (US$/bbl)
                                                                  2.48

                         2.03                       2.07
           1.86                       1.90


      3Q 05        4Q 05         1Q 06        2Q 06         3Q 06

• 20% increase compared to the previous quarter due to the occurrence of more
scheduled stoppages and restrictions to oil receipt.


                                                                                7

9

PETROBRAS
 Average Realization Price - ARP

100                                          3Q05                              2Q06                3Q06
                                            Average                           Average             Average
                                                                                                    81,83
                                                                                81,78
 80                                           72,43                                                72,28
                                                                                  70,66

                                                 61,54                                             69,49
 60                                                                             69,62
                                              60,26


 40


       ARP Brazil (US$/bbl)              Brent Average Price            ARP USA (w/ volumes sold in Brazil)

 20
  Sep-04     Dec-04           Mar-05   Jun-05      Sep-05      Dec-05     Mar-06          Jun-06       Sep-06


                                                                                                              8

10

PETROBRAS
Sales Volume
                                                            Jan-      Jan-
 Thousand bpd                   3Q06       2Q06       %                        %
                                                           Sept 06   Sept 05
 Total Oil Products               1,757     1,684      4     1,697     1,658   2
 Alcohol, Nitrogen and others        35        13   169         26        26    0
 Natural Gas                        250       239     5        240       224    7
 Total Dom estic Market           2,042     1,936     5      1,963     1,908    3
 Exports                            564       536     5        540       498    8
 International Sales                509       459    11        468       388   21
 Total International Market       1,073       995     8      1,008       886   14
 Total                            3,115     2,931     6      2,971     2,794    6


 • Increase in the sales of fuel oil, diesel, LPG and gasoline.


 2006 includes ongoing exports                                                      9

11

PETROBRAS
 Income Statement 3Q06 vs 2Q06
                                          2Q06       3Q06
                                                                                   43.363     14.3%
              Net Revenues
                                                                          37.948
 R$ Million


                                                            27.066                            27.3%
                    COGS
                                                   21.260


                                       12.912                                                 -5.2%
                   EBITDA
                                        13.614


                                   10.303                                                     -8.6%
         Operating Profit
                                    11.267


                              7.085                                                            1.8%
                Net Income
                              6.959

• Net Revenues: 5% increase in the domestic sales volume, oil exports (33%) and ARP (2%);
• COGS: ANP (National Petroleum Agency) new interpretation of special participation in the Marlim field
(retroactive to 2002); expenses adjustment related to reinjected gas (Solimões, Campos and Esp. Santo
Basins).
• Net Income: R$ 1.492 billion in benefits due to Interest on Own Capital provision, reduced in R$ 321
million relative to bonds buyback.

                                                                                                         10

12

PETROBRAS
  Operating Expenses Analysis 3Q06 vs 2Q06
                                                            2Q06      3Q06
                                                                                           1.546   14.3%
                 Sales Expenses
                                                                                   1.353
 R$ million


                General and                                                            1.459       3.1%
              Administrative Exp.                                                    1.415


                                                      531
                Exploratory Costs                                                                  40.5%
                                                378


                                                                                   1.342
                          Others                                                                   50.8%
                                                                   890


• Operating Expenses increase mainly because of:
              • Sales Expenses: increase in domestic sales (5.5%) and oil exports volume (33%);
              • Exploratory Costs: write-off of dried wells (Brazil and abroad);
              • Others: hedge contract maturity with ANDINA (R$ 167 million) and others like consulting and
                technical consulting (R$ 285 million).


                                                                                                           11

13

PETROBRAS
 Changes in Operating Profit (3Q06 vs. 2Q06)- E&P
  Changes in Operating Profit – R$ million
   1,757                          Domestic Oil, NGL and Condensate – thousand bpd                                 1,779
                                              536
                                1.040
                                                             408
  10.938          18                                                       426           420                    10.198
                                                                                                      6


                                                          Extraordinary Items:
                                                             R$ 834 million


 2Q06 Oper.   Price effect      Volum e    Average cost      Gas        Marlim part.   Volum e     Operating   3Q06 Oper.
   Profits       on Net      effect on Net   effect on    Reinjection   Calculation    effect on   Expenses      Profits
               Revenue         Revenue         COGs         Effect        Effect         COGs
• Quarter characterized by the increase in production and accounting of extraordinary items.
                                                                                                                         12

14

PETROBRAS
Changes in Operating Profit (3Q06 vs 2Q06)- Supply
                           Changes in Operating Profit – R$ million

                               3.168          2.160


                                                             2.944

                 1.017

   2.486

                                                                           106         1.461


2Q06 Oper.   Price effect on Volume effect Average cost Volume effect   Oper. Exp.   3Q06 Oper.
  Profit      Net Revenue       on Net     effect on COG  on COGs                      Profit
                               Revenue


• Increase in oil products domestic sales volume (4%), offset by inventory sales with
  a higher average cost.


                                                                                               13

15

PETROBRAS
 Changes in Net Profit – R$ million (3Q06 vs 2Q06)
 1,757              Domestic Oil, NGL and Condensate – thousand bpd                                               1,779
            5.415        4.982                     Extraordinary Items and
                                                       Bonds Buyback:
                                                       R$ 1.145 million


 6.959                                                                                                  149       7.085
                                       824            573                                 1.603
                                                                   341          321


 2Q06 Net   Revenues    GOGS w/o     Extr. Items   Oper. Exp.   Fin. and Non    Bonds    Taxes (Int.   Minority   3Q06 Net
  Profit               extraordinary                             Oper. Exp.    Buyback   Own Cap.)     Interest    Income
                           items                                   and Eq.
                                                                   Income

• COGS: influenced by extraordinary effects (R$ 426 million reinjected gas and R$ 408 million
  special participation costs in Marlim field) and sales of higher costs inventories;
• Operating Expenses: write-off of dried wells (Brazil and foreign); increase in the domestic sales
  and oil exports volume; maturity of the hedge with ANDINA and others.

                                                                                                                       14

16

PETROBRAS
Net exports of oil and oil products
       Exports (thousand bpd)                               Imports (thousand bpd)
                               54 thous. bpd volume surplus in the 3Q06

                              536      564                 559
                512    519                                                                  510
446                                               424               446   459
         409                             209              109                     442
                249     257    269                                                          137
  213                                              105              94    115      88
         228

                                         355              450
                                                    319            352    344     354       373
  233           263     262    267
         181


2003     2004   2005   1Q06     2Q06      3Q06   2003     2004     2005   1Q06    2Q06       3Q06

          Oil             Oil Products                       Oil             Oil Products


• Oil exports increase due to scheduled stoppages in refineries with high complexity;
• Oil products imports increase due to the seasonal increase in the diesel
  consumption.


  2006 includes ongoing exports                                                               15

17

PETROBRAS
Leverage
         Petrobras’ Leverage Ratio
                                                                         R$ million                     09/30/2006 06/30/2006
                                                28%
                                                            27%          Short Term debt (1)                11,858     12,214
                              26%
     26%                                                                 Long Term Debt (1)                 32,280     31,307
                   24%
                                                                         Total Debt                             44,138               43,521
                  23%          20%
   19%
                                              18%           17%          Cash and Cash
                                                                                                                24,519               22,713
                                                                         Equivalents

                                                                         Net debt (2)                           19,619               20,808

set/05        dez/05         mar/06         jun/06         set/06

                  Net Debt/Net Capitalization
                  Short-Term Debt/Total Debt


• Decrease in total and net debt:
        • Strong operating cash generation allows reduction of the debt (bonds buyback)
(1)Includes debt contracted throughcash contracts of R$ 3.300 million on December 31, 2005, and R$ 4.021 million on December 31, 2004.
          and increase in leasing balance.
(2)Total debt - cash and cash equivalents


(1)Includes debt contracted through leasing contracts of R$ 2,729 million on September 30, 2006, and R$ 2,815 million on June 30, 2006.
(2)Total debt - cash and cash equivalents                                                                                                 16

18

PETROBRAS
Consolidated Cash Flow Statement

                                                    R$ million
                                               3Q06          2Q06
(=) Net Cash from Operating Activities         10,209          11,365
(-) Cash used in Cap. Expend.                  (8,337)         (6,640)
(=) Free Cash Flow                              1,872           4,725
(-) Cash used in Financing and Dividends          (66)         (4,995)
    Financing                                     (60)         (1,472)
    Dividends                                      (6)         (3,523)
(=) Net Cash Generated in the Period            1,806            (270)
Cash at the Beginning of Period                22,713          22,983
Cash at the End of Period                      24,519          22,713


• R$ 1,8 billion increase in Free Cash Flow.


                                                                    17

19

PETROBRAS
 Investments (Capex)
  R$ million                           Jan-Sept/06   %       Jan-Sept/05   %        %
• Direct investments                     20.264       90       14.751       87      37
Exploration & Production                 11.404       51        8.907       53      28
Supply                                    2.800       13        2.184       13      28
Gas and Energy                            1.203        5        1.098        6      10
International                             3.923       17        1.871       11     110
Distribution                                477        2          368        2      30
Corporate                                   457        2          323        2      41
• Special Purpose Companies               2.072        9        1.914       11       8
• Ventures under Negotiation                300          1        169          1   78
• Project Finance                              1         0          87         1     0
Total Investments                        22.637      100       16.921      100     34


   • Following the targets established in its Business Plan, the company
     continues to invest primarily in Exploration and Production.


                                                                                    18

20

PETROBRAS


    QUESTION AND ANSWER
          SESSION
       Visit our website: www.petrobras.com.br/ri/english


            For further information please contact:
             Petróleo Brasileiro S.A – PETROBRAS
                Investor Relations Department
        Raul Adalberto de Campos– Executive Manager
             E-mail: petroinvest@petrobras.com.br
             Av. República do Chile, 65 - 22nd floor
                20031-912 – Rio de Janeiro, RJ
                 (55-21) 3224-1510 / 3224-9947


                                                            19

More Related Content

Webcast q306 ing

  • 1. PETROBRAS Conference Call / Webcast 3rd Quarter 2006 (Brazilian Corporate Law) Almir Barbassa CFO and Investor Relations Officer November, 13th 2006 0
  • 2. PETROBRAS Disclaimer The presentation may contain forecasts about future events. Such forecasts merely reflect the expectations of the Company's management. Such terms as "anticipate", "believe", "expect", "forecast", "intend", "plan", "project", "seek", "should", along with similar or analogous expressions, are used to identify such forecasts. These predictions evidently involve risks and uncertainties, whether foreseen or not by the Company. Therefore, the future results of operations may differ from current expectations, and readers must not base their expectations exclusively on the information presented herein. The Company is not obliged to update the presentation/such forecasts in light of new information or future developments. Cautionary Statement for US investors The United States Securities and Exchange Commission permits oil and gas companies, in their filings with the SEC, to disclose only proved reserves that a company has demonstrated by actual production or conclusive formation tests to be economically and legally producible under existing economic and operating conditions. We use certain terms in this presentation, such as oil and gas resources, that the SEC’s guidelines strictly prohibit us from including in filings with the SEC. 1
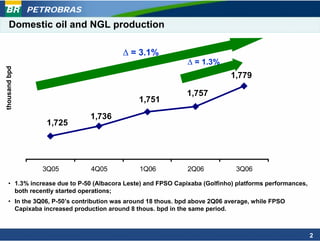
  • 3. PETROBRAS Domestic oil and NGL production Δ = 3.1% Δ = 1.3% thousand bpd 1,779 1.790 1.780 1,757 1.770 1,751 1.760 1.750 1,736 1,725 1.740 1.730 1.720 1.710 1.700 3Q05 4Q05 1Q06 2Q06 3Q06 • 1.3% increase due to P-50 (Albacora Leste) and FPSO Capixaba (Golfinho) platforms performances, both recently started operations; • In the 3Q06, P-50’s contribution was around 18 thous. bpd above 2Q06 average, while FPSO Capixaba increased production around 8 thous. bpd in the same period. 2
  • 4. PETROBRAS E&P – Oil Prices 69,62 US$ 10.80 bbl 69,49 64,74 61,53 61,75 66,07 56,9 57,59 56,39 58,69 51,59 58,2 US$/bbl 47,83 54,24 52,7 53,69 44,00 49,33 41,59 46,05 39,70 44,19 43,04 38,98 37,48 36,14 35,11 3T04 4T04 1T05 2T05 3T05 4T05 1T06 2T06 3T06 Average Sales Price Brent (average) Cesta OPEP • The spread between Brazilian oil and Brent decreased from US$ 11.42/bbl, in the 2Q06, to US$ 10.80/bbl, in the 3Q06. 3
  • 5. PETROBRAS Domestic Lifting Costs without Government Participation Δ = 8.5% or US$ 0.52 6.32 6.64 6.07 6.12 US$/bbl 5.44 3Q 05 4Q 05 1Q06 2Q06 3Q06 Main Causes • Higher expenditure in: • Transportation, seismic and drilling for wells intervention; • Corrective maintenances; • Higher costs due to initial operational phase in Albacora Leste and Golfinho fields. 4
  • 6. PETROBRAS Lifting Costs including Government Participation 26 70 61,5 56,9 69,6 69,5 51,6 60 21 47,5 61,8 17.5 18.1 50 38,2 17.3 15.2 16.1 16 40 28,8 13.6 13.9 63% US$/boe 24,8 11,5 30 63% 10.7 10,0 11,0 11,4 11 9,7 62% 7,7 8,4 59% 8.5 20 7.0 6,4 6 10 57% 5,1 4,0 6,0 5,4 5,4 6,1 6,3 6,1 6,6 0 3,0 3,4 4,3 1 -10 2002 2003 2004 1Q05 2Q05 3Q05 4Q05 1Q06 2Q06 3Q06 -4 -20 Lifting Cost Gov. Participation Brent • Government participation remained stable due to the stability of the Brent price, FX rate and production. Obs.: Lifting Cost w/ gov. part. series was adjusted (retroactive to 2002) due to new ANP interpretation of the expense deductibility for the Finance Project of Marlim Field, calculated as special participation. 5
  • 7. PETROBRAS Refining and Sales in the Domestic Market 91 95 2.400 91 93 90 Thous. barrels/day 91 2.200 89 85 2.000 80 80 81 80 79 79 75 % 1.800 70 1.600 65 1.804 1.720 1.761 1.753 1.757 1.400 1.812 1.795 1.684 1.647 1.649 60 1.200 55 1.000 50 3Q05 4Q05 1Q06 2Q06 3Q06 D o m e s t ic o il pro duc t s pro duc t io n O il pro duc t s s a le s v o lum e P rim a ry pro c e s s e d ins t a lle d c a pa c it y - B ra zil ( %) D o m e s t ic c rude a s % o f t o t a l • 4 pp reduction in throughput due to: • Oil supply limitation; • More scheduled stoppages compared to 2Q06; • 1 pp decrease in domestic crude participation in processed feedstock due to operational problems in Golfinho (less light oil) and increase spread between fuel oil and domestic heavy oil (more profitable to export). • Increase in sales volume due to seasonality in agricultural diesel consumption, industrial fuel oil and substitution of imported naphtha. 6
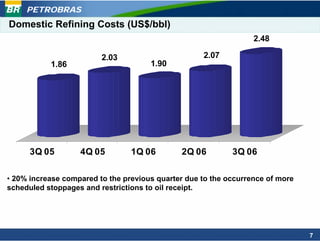
  • 8. PETROBRAS Domestic Refining Costs (US$/bbl) 2.48 2.03 2.07 1.86 1.90 3Q 05 4Q 05 1Q 06 2Q 06 3Q 06 • 20% increase compared to the previous quarter due to the occurrence of more scheduled stoppages and restrictions to oil receipt. 7
  • 9. PETROBRAS Average Realization Price - ARP 100 3Q05 2Q06 3Q06 Average Average Average 81,83 81,78 80 72,43 72,28 70,66 61,54 69,49 60 69,62 60,26 40 ARP Brazil (US$/bbl) Brent Average Price ARP USA (w/ volumes sold in Brazil) 20 Sep-04 Dec-04 Mar-05 Jun-05 Sep-05 Dec-05 Mar-06 Jun-06 Sep-06 8
  • 10. PETROBRAS Sales Volume Jan- Jan- Thousand bpd 3Q06 2Q06 % % Sept 06 Sept 05 Total Oil Products 1,757 1,684 4 1,697 1,658 2 Alcohol, Nitrogen and others 35 13 169 26 26 0 Natural Gas 250 239 5 240 224 7 Total Dom estic Market 2,042 1,936 5 1,963 1,908 3 Exports 564 536 5 540 498 8 International Sales 509 459 11 468 388 21 Total International Market 1,073 995 8 1,008 886 14 Total 3,115 2,931 6 2,971 2,794 6 • Increase in the sales of fuel oil, diesel, LPG and gasoline. 2006 includes ongoing exports 9
  • 11. PETROBRAS Income Statement 3Q06 vs 2Q06 2Q06 3Q06 43.363 14.3% Net Revenues 37.948 R$ Million 27.066 27.3% COGS 21.260 12.912 -5.2% EBITDA 13.614 10.303 -8.6% Operating Profit 11.267 7.085 1.8% Net Income 6.959 • Net Revenues: 5% increase in the domestic sales volume, oil exports (33%) and ARP (2%); • COGS: ANP (National Petroleum Agency) new interpretation of special participation in the Marlim field (retroactive to 2002); expenses adjustment related to reinjected gas (Solimões, Campos and Esp. Santo Basins). • Net Income: R$ 1.492 billion in benefits due to Interest on Own Capital provision, reduced in R$ 321 million relative to bonds buyback. 10
  • 12. PETROBRAS Operating Expenses Analysis 3Q06 vs 2Q06 2Q06 3Q06 1.546 14.3% Sales Expenses 1.353 R$ million General and 1.459 3.1% Administrative Exp. 1.415 531 Exploratory Costs 40.5% 378 1.342 Others 50.8% 890 • Operating Expenses increase mainly because of: • Sales Expenses: increase in domestic sales (5.5%) and oil exports volume (33%); • Exploratory Costs: write-off of dried wells (Brazil and abroad); • Others: hedge contract maturity with ANDINA (R$ 167 million) and others like consulting and technical consulting (R$ 285 million). 11
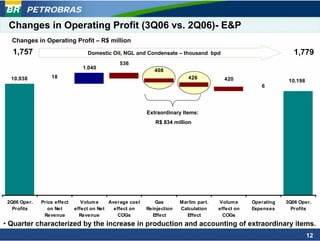
  • 13. PETROBRAS Changes in Operating Profit (3Q06 vs. 2Q06)- E&P Changes in Operating Profit – R$ million 1,757 Domestic Oil, NGL and Condensate – thousand bpd 1,779 536 1.040 408 10.938 18 426 420 10.198 6 Extraordinary Items: R$ 834 million 2Q06 Oper. Price effect Volum e Average cost Gas Marlim part. Volum e Operating 3Q06 Oper. Profits on Net effect on Net effect on Reinjection Calculation effect on Expenses Profits Revenue Revenue COGs Effect Effect COGs • Quarter characterized by the increase in production and accounting of extraordinary items. 12
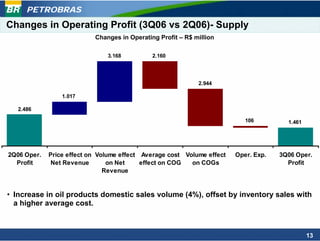
  • 14. PETROBRAS Changes in Operating Profit (3Q06 vs 2Q06)- Supply Changes in Operating Profit – R$ million 3.168 2.160 2.944 1.017 2.486 106 1.461 2Q06 Oper. Price effect on Volume effect Average cost Volume effect Oper. Exp. 3Q06 Oper. Profit Net Revenue on Net effect on COG on COGs Profit Revenue • Increase in oil products domestic sales volume (4%), offset by inventory sales with a higher average cost. 13
  • 15. PETROBRAS Changes in Net Profit – R$ million (3Q06 vs 2Q06) 1,757 Domestic Oil, NGL and Condensate – thousand bpd 1,779 5.415 4.982 Extraordinary Items and Bonds Buyback: R$ 1.145 million 6.959 149 7.085 824 573 1.603 341 321 2Q06 Net Revenues GOGS w/o Extr. Items Oper. Exp. Fin. and Non Bonds Taxes (Int. Minority 3Q06 Net Profit extraordinary Oper. Exp. Buyback Own Cap.) Interest Income items and Eq. Income • COGS: influenced by extraordinary effects (R$ 426 million reinjected gas and R$ 408 million special participation costs in Marlim field) and sales of higher costs inventories; • Operating Expenses: write-off of dried wells (Brazil and foreign); increase in the domestic sales and oil exports volume; maturity of the hedge with ANDINA and others. 14
  • 16. PETROBRAS Net exports of oil and oil products Exports (thousand bpd) Imports (thousand bpd) 54 thous. bpd volume surplus in the 3Q06 536 564 559 512 519 510 446 424 446 459 409 209 109 442 249 257 269 137 213 105 94 115 88 228 355 450 319 352 344 354 373 233 263 262 267 181 2003 2004 2005 1Q06 2Q06 3Q06 2003 2004 2005 1Q06 2Q06 3Q06 Oil Oil Products Oil Oil Products • Oil exports increase due to scheduled stoppages in refineries with high complexity; • Oil products imports increase due to the seasonal increase in the diesel consumption. 2006 includes ongoing exports 15
  • 17. PETROBRAS Leverage Petrobras’ Leverage Ratio R$ million 09/30/2006 06/30/2006 28% 27% Short Term debt (1) 11,858 12,214 26% 26% Long Term Debt (1) 32,280 31,307 24% Total Debt 44,138 43,521 23% 20% 19% 18% 17% Cash and Cash 24,519 22,713 Equivalents Net debt (2) 19,619 20,808 set/05 dez/05 mar/06 jun/06 set/06 Net Debt/Net Capitalization Short-Term Debt/Total Debt • Decrease in total and net debt: • Strong operating cash generation allows reduction of the debt (bonds buyback) (1)Includes debt contracted throughcash contracts of R$ 3.300 million on December 31, 2005, and R$ 4.021 million on December 31, 2004. and increase in leasing balance. (2)Total debt - cash and cash equivalents (1)Includes debt contracted through leasing contracts of R$ 2,729 million on September 30, 2006, and R$ 2,815 million on June 30, 2006. (2)Total debt - cash and cash equivalents 16
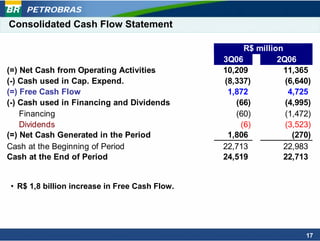
  • 18. PETROBRAS Consolidated Cash Flow Statement R$ million 3Q06 2Q06 (=) Net Cash from Operating Activities 10,209 11,365 (-) Cash used in Cap. Expend. (8,337) (6,640) (=) Free Cash Flow 1,872 4,725 (-) Cash used in Financing and Dividends (66) (4,995) Financing (60) (1,472) Dividends (6) (3,523) (=) Net Cash Generated in the Period 1,806 (270) Cash at the Beginning of Period 22,713 22,983 Cash at the End of Period 24,519 22,713 • R$ 1,8 billion increase in Free Cash Flow. 17
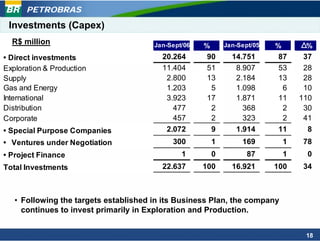
  • 19. PETROBRAS Investments (Capex) R$ million Jan-Sept/06 % Jan-Sept/05 % % • Direct investments 20.264 90 14.751 87 37 Exploration & Production 11.404 51 8.907 53 28 Supply 2.800 13 2.184 13 28 Gas and Energy 1.203 5 1.098 6 10 International 3.923 17 1.871 11 110 Distribution 477 2 368 2 30 Corporate 457 2 323 2 41 • Special Purpose Companies 2.072 9 1.914 11 8 • Ventures under Negotiation 300 1 169 1 78 • Project Finance 1 0 87 1 0 Total Investments 22.637 100 16.921 100 34 • Following the targets established in its Business Plan, the company continues to invest primarily in Exploration and Production. 18
  • 20. PETROBRAS QUESTION AND ANSWER SESSION Visit our website: www.petrobras.com.br/ri/english For further information please contact: Petróleo Brasileiro S.A – PETROBRAS Investor Relations Department Raul Adalberto de Campos– Executive Manager E-mail: petroinvest@petrobras.com.br Av. República do Chile, 65 - 22nd floor 20031-912 – Rio de Janeiro, RJ (55-21) 3224-1510 / 3224-9947 19