Location via proxy:   [ UP ]  
[Report a bug]   [Manage cookies]                
SlideShare a Scribd company logo
© OECD/IEA 2018
Electricity Focus
Laura Cozzi, Brent Wanner,
Stéphanie Bouckaert
26 November 2018
© OECD/IEA 2018
Context
 Electricity is increasingly important in the modern world, to date:
 Electricity demand has been growing twice as fast as total energy demand
 Investment in the power sector is larger than that in the oil and gas sector
 The rise of solar PV and wind power is transforming electricity supply
 Overall energy-related CO2 emissions are back on a rising trend in 2018
 For the first time, the global population without access to electricity fell below 1 billion
 Policy makers need well-grounded insights about different possible futures & how
they come about. The WEO provides two key scenarios:
 New Policies Scenario
 The Future is Electric Scenario was introduced to explore the implications of more
rapid electrification of end uses and the digitalization of the economy
 Sustainable Development Scenario
© OECD/IEA 2018
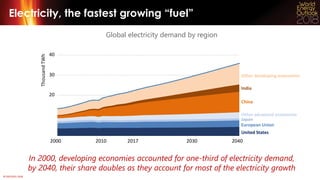
Electricity, the fastest growing “fuel”
In 2000, developing economies accounted for one-third of electricity demand,
30
40
2000 2010 2017 2030 2040
United States
European Union
Other developing economies
India
China
Other advanced economies
Japan
Global electricity demand by region
ThousandTWh
20
United States
European Union
Other developing economies
India
China
Other advanced economies
Japan
by 2040, their share doubles as they account for most of the electricity growth
© OECD/IEA 2018
Electricity demand flattening in advanced economies
Electricity consumption in advanced economies
Efficiency measures have moderated growth in electricity demand in advanced economies
TWh
1 763 TWh
41%
Industry
30%
Services
29%
Residential
2 000
4 000
6 000
8 000
10 000
12 000
2000 2005 2010 2015 2017
Observed
Without energy efficiency
Without electrification
Efficiency savings contribution
by sector in 2017
© OECD/IEA 2018
Energy efficiency is key to lower electricity growth
Electricity demand and avoided demand due to energy efficiency in the New Policies Scenario
Global electricity demand growth would be more than 60% higher in 2040 without
projected energy efficiency improvements
15%
30%
45%
60%
Industry Buildings Transport
2017 2040
Developing economies
4 000
8 000
12 000
16 000
Industry Buildings Transport
TWh
2017 Growth to 2040 Efficiency savings
Share of electricity in TFC (right axis)
Advanced economies
Electricity demand
© OECD/IEA 2018
What if the future is electric?
Buildings
Level of household uptake
Electrification makes inroads in all end-uses in parallel with global access to electricity
and greater digitalisation
25%
50%
75%
100%
Electricity
for heating
Access to
electricity
15%
30%
45%
60%
EAF in
steel
2%
4%
6%
8%
Ammonia Heat
Future is Electric ScenarioNew Policies Scenario
Industry
Electrification of end-uses
Transport
Electric vehicle fleet
Network
enabled
appliances
0.2
0.4
0.6
0.8
1.0
Light
duty
vehicles
2/3
wheelers
Billionvehicles
2
4
6
8
10
Trucks Buses
Millionvehicles
© OECD/IEA 2018
25
50
75
100
125
2015 2020 2030 2040
Oil demand
(mb/d)
8
16
24
32
40
2015 2020 2030 2040
Energy-related
CO2 emissions (Gt)
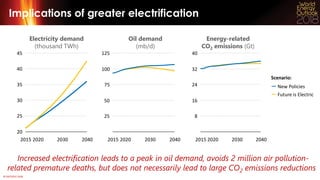
Implications of greater electrification
Increased electrification leads to a peak in oil demand
Scenario:
Future is Electric
New Policies
, avoids 2 million air pollution-
related premature deaths, but does not necessarily lead to large CO2 emissions reductions
25
30
35
40
45
2015 2020 2030 2040
Electricity demand
(thousand TWh)
20
© OECD/IEA 2018
Solar PV outpaces all other technologies
Installed power generation capacity by source in the New Policies Scenario
Renewables make up two-thirds of all capacity additions worldwide to 2040,
capturing 70% of power plant investment
1 000
2 000
3 000
2000 2010 2020 2030 2040
GW Historical Projections Gas
Other renewables
Coal
Nuclear
Oil
Solar PV
Wind
Hydro
Battery storage
© OECD/IEA 2018
40
80
120
160
China Russia India
GW
2017
Two directions for nuclear power
Without policy changes
The contribution of nuclear power could decline substantially in leading markets,
while large growth is coming, as China takes first position within a decade
40
80
120
160
United
States
European
Union
Japan
Retirements
from 2017
2040
GW
Growth markets
Additions
to 2040
2017
© OECD/IEA 2018
The electricity landscape is transforming
World electricity generation mix by source
Coal and renewables switch roles by 2040, mainly driven by policy support and
accelerated by the improving competitiveness of renewables
20%
40%
60%
80%
Fossil fuels Renewables Nuclear
2017
Fossil fuels Renewables Nuclear
2040
Coal
Oil
Gas
Gas
Coal
Oil
Hydro
Wind
Solar
Other
Hydro
Wind
Solar
Other
© OECD/IEA 2018
All sources of
flexibility needed
6
5
2
1
Mobilise existing
power system flexibility
4
3
Targeted investment
in flexibility needed
Flexibility: the cornerstone of tomorrow’s power systems
Phases of integration with variable renewables share, 2017
Higher shares of variable renewables raise flexibility needs and call for reforms to deliver
investment in power plants, grids & energy storage, and unlock demand-side response
Integration
phase
Wind and solar PV share of generation
0% 10% 20% 30% 40% 50% 60%
India
China
United States
India
China
United States
European Union
European Union
Germany
Germany
United Kingdom
United Kingdom
Phases of integration with variable renewables share, 2030
© OECD/IEA 2018
20%
40%
60%
80%
100%
2010 2017
Market designs will be under stress
Share of long-run generation costs covered by energy sales in the European Union
The widening gap between electricity sales and total generation costs in some markets
raises questions about the ability of competitive markets to attract timely investment
2025 2030
Other revenue needed
Rising CO2 price
Energy sales
© OECD/IEA 2018
Looking beyond the levelised cost of electricity
Technology costs
Costs remain an important indicator of competitiveness, but better metrics are needed
to reflect the changing nature and needs of power systems
DollarsperMWh
Levelised cost
(LCOE)
System value
Value-adjusted LCOEs (VALCOEs) in China
Capital,
fuel,
O&M,
CO2
costs
Energy
Flexibility
Capacity
DollarsperMWh(2017)
40
80
120
160
2020 2030 2040
Coal
Gas CCGT
Coal existing
Nuclear
Wind onshore
Solar PV
Solar PV with storage
Wind offshore
and value
© OECD/IEA 2018
Our energy destiny lies with governments
Power sector investment to 2040
$20 trillion
Power sector investment continues to be driven by regulated market frameworks
Regulated/contracted
(generation and grids)
93%
Wholesale market pricing 7%
© OECD/IEA 2018
Can we unlock a different energy future?
Global energy-related CO2 emissions
Coal plants make up one-third of CO2 emissions today and half are less than 15 years old;
policies are needed to support CCUS, efficient operations and technology innovation
12
18
24
30
2017 2025 2030 2035 2040
Gt CO2 36
Sustainable Development
Scenario
Coal-fired power plants
Increased room
to manoeuvre
6
New Policies Scenario
Existing and under construction
power plants, factories, buildings etc.
© OECD/IEA 2018
Conclusions
 The links between energy & geopolitics are strengthening & becoming more
complex, a major factor in the outlook for energy security
 The rapid growth of electricity brings huge opportunities; but market designs need
to deliver both electricity and flexibility to keep the lights on
 A comprehensive strategy to electrify end uses and decarbonise the power sector is
needed to achieve environmental goals
 There is no single solution to turn emissions around: renewables, efficiency & a host
of innovative technologies, including storage, CCUS & hydrogen, are all required
 The future pathway for energy is open: governments will determine where our
energy destiny lies
© OECD/IEA 2018
iea.org/weo

More Related Content

WEO-2018 Electricity Webinar

  • 1. © OECD/IEA 2018 Electricity Focus Laura Cozzi, Brent Wanner, Stéphanie Bouckaert 26 November 2018
  • 2. © OECD/IEA 2018 Context  Electricity is increasingly important in the modern world, to date:  Electricity demand has been growing twice as fast as total energy demand  Investment in the power sector is larger than that in the oil and gas sector  The rise of solar PV and wind power is transforming electricity supply  Overall energy-related CO2 emissions are back on a rising trend in 2018  For the first time, the global population without access to electricity fell below 1 billion  Policy makers need well-grounded insights about different possible futures & how they come about. The WEO provides two key scenarios:  New Policies Scenario  The Future is Electric Scenario was introduced to explore the implications of more rapid electrification of end uses and the digitalization of the economy  Sustainable Development Scenario
  • 3. © OECD/IEA 2018 Electricity, the fastest growing “fuel” In 2000, developing economies accounted for one-third of electricity demand, 30 40 2000 2010 2017 2030 2040 United States European Union Other developing economies India China Other advanced economies Japan Global electricity demand by region ThousandTWh 20 United States European Union Other developing economies India China Other advanced economies Japan by 2040, their share doubles as they account for most of the electricity growth
  • 4. © OECD/IEA 2018 Electricity demand flattening in advanced economies Electricity consumption in advanced economies Efficiency measures have moderated growth in electricity demand in advanced economies TWh 1 763 TWh 41% Industry 30% Services 29% Residential 2 000 4 000 6 000 8 000 10 000 12 000 2000 2005 2010 2015 2017 Observed Without energy efficiency Without electrification Efficiency savings contribution by sector in 2017
  • 5. © OECD/IEA 2018 Energy efficiency is key to lower electricity growth Electricity demand and avoided demand due to energy efficiency in the New Policies Scenario Global electricity demand growth would be more than 60% higher in 2040 without projected energy efficiency improvements 15% 30% 45% 60% Industry Buildings Transport 2017 2040 Developing economies 4 000 8 000 12 000 16 000 Industry Buildings Transport TWh 2017 Growth to 2040 Efficiency savings Share of electricity in TFC (right axis) Advanced economies Electricity demand
  • 6. © OECD/IEA 2018 What if the future is electric? Buildings Level of household uptake Electrification makes inroads in all end-uses in parallel with global access to electricity and greater digitalisation 25% 50% 75% 100% Electricity for heating Access to electricity 15% 30% 45% 60% EAF in steel 2% 4% 6% 8% Ammonia Heat Future is Electric ScenarioNew Policies Scenario Industry Electrification of end-uses Transport Electric vehicle fleet Network enabled appliances 0.2 0.4 0.6 0.8 1.0 Light duty vehicles 2/3 wheelers Billionvehicles 2 4 6 8 10 Trucks Buses Millionvehicles
  • 7. © OECD/IEA 2018 25 50 75 100 125 2015 2020 2030 2040 Oil demand (mb/d) 8 16 24 32 40 2015 2020 2030 2040 Energy-related CO2 emissions (Gt) Implications of greater electrification Increased electrification leads to a peak in oil demand Scenario: Future is Electric New Policies , avoids 2 million air pollution- related premature deaths, but does not necessarily lead to large CO2 emissions reductions 25 30 35 40 45 2015 2020 2030 2040 Electricity demand (thousand TWh) 20
  • 8. © OECD/IEA 2018 Solar PV outpaces all other technologies Installed power generation capacity by source in the New Policies Scenario Renewables make up two-thirds of all capacity additions worldwide to 2040, capturing 70% of power plant investment 1 000 2 000 3 000 2000 2010 2020 2030 2040 GW Historical Projections Gas Other renewables Coal Nuclear Oil Solar PV Wind Hydro Battery storage
  • 9. © OECD/IEA 2018 40 80 120 160 China Russia India GW 2017 Two directions for nuclear power Without policy changes The contribution of nuclear power could decline substantially in leading markets, while large growth is coming, as China takes first position within a decade 40 80 120 160 United States European Union Japan Retirements from 2017 2040 GW Growth markets Additions to 2040 2017
  • 10. © OECD/IEA 2018 The electricity landscape is transforming World electricity generation mix by source Coal and renewables switch roles by 2040, mainly driven by policy support and accelerated by the improving competitiveness of renewables 20% 40% 60% 80% Fossil fuels Renewables Nuclear 2017 Fossil fuels Renewables Nuclear 2040 Coal Oil Gas Gas Coal Oil Hydro Wind Solar Other Hydro Wind Solar Other
  • 11. © OECD/IEA 2018 All sources of flexibility needed 6 5 2 1 Mobilise existing power system flexibility 4 3 Targeted investment in flexibility needed Flexibility: the cornerstone of tomorrow’s power systems Phases of integration with variable renewables share, 2017 Higher shares of variable renewables raise flexibility needs and call for reforms to deliver investment in power plants, grids & energy storage, and unlock demand-side response Integration phase Wind and solar PV share of generation 0% 10% 20% 30% 40% 50% 60% India China United States India China United States European Union European Union Germany Germany United Kingdom United Kingdom Phases of integration with variable renewables share, 2030
  • 12. © OECD/IEA 2018 20% 40% 60% 80% 100% 2010 2017 Market designs will be under stress Share of long-run generation costs covered by energy sales in the European Union The widening gap between electricity sales and total generation costs in some markets raises questions about the ability of competitive markets to attract timely investment 2025 2030 Other revenue needed Rising CO2 price Energy sales
  • 13. © OECD/IEA 2018 Looking beyond the levelised cost of electricity Technology costs Costs remain an important indicator of competitiveness, but better metrics are needed to reflect the changing nature and needs of power systems DollarsperMWh Levelised cost (LCOE) System value Value-adjusted LCOEs (VALCOEs) in China Capital, fuel, O&M, CO2 costs Energy Flexibility Capacity DollarsperMWh(2017) 40 80 120 160 2020 2030 2040 Coal Gas CCGT Coal existing Nuclear Wind onshore Solar PV Solar PV with storage Wind offshore and value
  • 14. © OECD/IEA 2018 Our energy destiny lies with governments Power sector investment to 2040 $20 trillion Power sector investment continues to be driven by regulated market frameworks Regulated/contracted (generation and grids) 93% Wholesale market pricing 7%
  • 15. © OECD/IEA 2018 Can we unlock a different energy future? Global energy-related CO2 emissions Coal plants make up one-third of CO2 emissions today and half are less than 15 years old; policies are needed to support CCUS, efficient operations and technology innovation 12 18 24 30 2017 2025 2030 2035 2040 Gt CO2 36 Sustainable Development Scenario Coal-fired power plants Increased room to manoeuvre 6 New Policies Scenario Existing and under construction power plants, factories, buildings etc.
  • 16. © OECD/IEA 2018 Conclusions  The links between energy & geopolitics are strengthening & becoming more complex, a major factor in the outlook for energy security  The rapid growth of electricity brings huge opportunities; but market designs need to deliver both electricity and flexibility to keep the lights on  A comprehensive strategy to electrify end uses and decarbonise the power sector is needed to achieve environmental goals  There is no single solution to turn emissions around: renewables, efficiency & a host of innovative technologies, including storage, CCUS & hydrogen, are all required  The future pathway for energy is open: governments will determine where our energy destiny lies