Location via proxy:   [ UP ]  
[Report a bug]   [Manage cookies]                
SlideShare a Scribd company logo

1

What is data analytics?
Most companies are collecting loads of data all the time—but, in its raw form, this data
doesn’t really mean anything. This is where data analytics comes in. Data analytics is the
process of analyzing raw data in order to draw out meaningful, actionable insights,
which are then used to inform and drive smart business decisions.
A data analyst will extract raw data, organize it, and then analyze it, transforming it from
incomprehensible numbers into coherent, intelligible information. Having interpreted the
data, the data analyst will then pass on their findings in the form of suggestions or
recommendations about what the company’s next steps should be.
, businesses and organizations are able to develop a much deeper understanding of their
audience, their industry, and their company as a whole—and, as a result, are much better
equipped to make decisions and plan ahead.

2

You can think of data analytics as a form of business intelligence, used to solve specific problems and
challenges within an organization.
It’s all about finding patterns in a dataset which can tell you something useful and relevant about a
particular area of the business—how certain customer groups behave, for example, or how employees
engage with a particular tool.
Data analytics helps you to make sense of the past and to predict future trends and behaviors; rather than
basing your decisions and strategies on guesswork, you’re making informed choices based on what the data
is telling you.
How businesses use data analytics
Armed with the insights drawn from the data, businesses and organizations are able to develop a much
deeper understanding of their audience, their industry, and their company as a whole—and, as a result, are
much better equipped to make decisions and plan ahead.

3

What’s the difference between data analytics
and data science?
Data analytics
A data analyst will seek to answer specific questions or address particular
challenges that have already been identified and are known to the business.
To do this, they examine large datasets with the goal of identifying trends
and patterns. They then “visualize” their findings in the form of charts,
graphs, and dashboards. These visualizations are shared with key
stakeholders and used to make informed, data-driven strategic decisions.

4

Data science:
• A data scientist, on the other hand, considers what questions the business
should or could be asking.
• They design new processes for data modeling, write algorithms, devise
predictive models, and run custom analyses.
• For example: They might build a machine to leverage a dataset and automate
certain actions based on that data—and, with continuous monitoring and
testing, and as new patterns and trends emerge, improve and optimize that
machine wherever possible.

5

What are the different types of data analysis?
Now we have a working definition of data analytics,
let’s explore the four main types of data
analysis: descriptive, diagnostic, predictive,
and prescriptive.

6

What is data analytics ,Data science,Data processing chain,regression,decision Tress.ppt

7

What is the typical process that a data analyst will
follow?
Now we’ve set the scene in terms of the overall data analyst role,
let’s drill down to the actual process of data analysis. Here, we’ll
outline the five main steps that a data analyst will follow when
tackling a new project:

8

What is data analytics ,Data science,Data processing chain,regression,decision Tress.ppt

9

Define the question(s) you want to answer
• The first step is to identify why you are conducting
analysis and what question or challenge you hope to solve.
• At this stage, you’ll take a clearly defined problem and come up with
a relevant question or hypothesis you can test. You’ll then need to
identify what kinds of data you’ll need and where it will come from.
• For example: A potential business problem might be that customers
aren’t subscribing to a paid membership after their free trial ends.
Your research question could then be “What strategies can we use to
boost customer retention?”

10

Collect the data
• With a clear question in mind, you’re ready to start collecting your
data. Data analysts will usually gather structured data from primary or
internal sources, such as CRM software or email marketing tools.
• They may also turn to secondary or external sources, such as open data
sources. These include government portals, tools like Google Trends,
and data published by major organizations such as UNICEF and the
World Health Organization.

11

Clean the data
• Once you’ve collected your data, you need to get it ready for analysis—
and this means thoroughly cleaning your dataset. Your original dataset
may contain duplicates, anomalies, or missing data which could distort
how the data is interpreted, so these all need to be removed. Data
cleaning can be a time-consuming task, but it’s crucial for obtaining
accurate results.

12

Analyze the data
• Now for the actual analysis! How you analyze the data will depend
on the question you’re asking and the kind of data you’re working
with, but some common techniques include regression
analysis, cluster analysis, and time-series analysis (to name just a
few).
• We’ll go over some of these techniques in the next section. This step
in the process also ties in with the four different types of analysis we
looked at in section three (descriptive, diagnostic, predictive, and
prescriptive).

13

Visualize and share your findings
• This final step in the process is where data is transformed into valuable
business insights. Depending on the type of analysis conducted, you’ll
present your findings in a way that others can understand—in the form of a
chart or graph, for example.
• At this stage, you’ll demonstrate what the data analysis tells you in regards
to your initial question or business challenge, and collaborate with key
stakeholders on how to move forwards. This is also a good time to
highlight any limitations to your data analysis and to consider what further
analysis might be conducted.

14

What skills do you need to become a data
analyst?
Hard skills
• Mathematical and statistical ability
• Knowledge of programming languages such as SQL, R, or Python
• An analytical mindset
Soft skills
Keen problem-solving skills
Excellent communication skills
Adaptability

15

• Data analytics is an important field that involves the process of collecting,
processing, and interpreting data to uncover insights and help in making
decisions. Data analytics is the practice of examining raw data to identify
trends, draw conclusions, and extract meaningful information. This involves
various techniques and tools to process and transform data into valuable
insights that can be used for decision-making.
• we will learn about Data analytics,data which will help businesses and
individuals that can help them to enhance and solve complex problems, Types
of Data Analytics, Techniques, Tools, and the Importance of Data Analytics

16

What is Data Analytics?
In this new digital world, data is being generated in an enormous amount
which opens new paradigms. As we have high computing power and a
large amount of data we can use this data to help us make data-driven
decision making. The main benefits of data-driven decisions are that they
are made up by observing past trends which have resulted in beneficial
results.

17

Understanding Data Analytics
• Data analytics encompasses a wide array of techniques for analyzing data to gain valuable
insights that can enhance various aspects of operations. By scrutinizing information,
businesses can uncover patterns and metrics that might otherwise go unnoticed, enabling
them to optimize processes and improve overall efficiency.
• For instance, in manufacturing, companies collect data on machine runtime, downtime, and
work queues to analyze and improve workload planning, ensuring machines operate at
optimal levels.
• Beyond production optimization, data analytics is utilized in diverse sectors. Gaming firms
utilize it to design reward systems that engage players effectively, while content providers
leverage analytics to optimize content placement and presentation, ultimately driving user
engagement.

18

Types of Data Analytics
• There are four major types of data analytics:
• Predictive (forecasting)
• Descriptive (business intelligence and data mining)
• Prescriptive (optimization and simulation)
• Diagnostic analytics

19

What is data analytics ,Data science,Data processing chain,regression,decision Tress.ppt

20

What is Business Intelligence?
• Business Intelligence is one of the most powerful tools many
organizations use to know their customer base and market better. It
describes the business methodology in which the raw data is
transformed into useful information which helps in decision making.
Benefits of Business Intelligence
• Business intelligence has broad applications, and if talking about the
benefits of business intelligence in the retail sector, nowadays business
intelligence tools enable organizations to take benefit of data not only
to assume current sales but also to estimate future potential, patterns,
trends and know the demand of the customer on a deeper level.

21

Pattern
• Pattern is everything around in this digital world. A pattern can either
be seen physically or it can be observed mathematically by applying
algorithms.
• Example: The colors on the clothes, speech pattern, etc. In computer
science, a pattern is represented using vector feature values.

22

What is Pattern Recognition?
Pattern recognition is the process of recognizing patterns by using a
machine learning algorithm. Pattern recognition can be defined as the
classification of data based on knowledge already gained or on statistical
information extracted from patterns and/or their representation. One of the
important aspects of pattern recognition is its application potential.
Examples: Speech recognition, speaker identification, multimedia
document recognition (MDR), automatic medical diagnosis.

23

Temporal Pattern
It is something that regularly occurs overtime.
Ex:
A temporal rule would be that "some people are always late," no matter
what the occasion or time. Some people may be aware of this pattern
and some may not. Understanding a pattern like this would help
dissipate a lot of unnecessary frustration and anger. One can just joke
that some people are born "10 minutes late," and laugh it away.
Similarly, Parkinson's Law states that work expands to fill up all the
time available to do it.

24

Spatial Pattern
Patterns can also be spatial such as things being organized in certain way.
Functional Patterns
Patterns can be functional which means doing certain things leads to
certain effects
A functional pattern may involve test-taking skills. Some students
perform well on essay-type questions. Others do well in multiple-choice
questions. Yet other students excel in doing hands-on projects, or in oral
presentations. An awareness of such a pattern in a class of students can
help the teacher design a balanced testing mechanism that is fair to all.

25

Finding a Pattern
• Diamond mining is the act of digging into large amounts of unrefined ore to dis- cover
precious gems or nuggets. Similarly, data mining is the act of digging into large amounts of
raw data to discover unique nontrivial useful patterns. Data is cleaned up, and then special
tools and techniques can be applied to search for patterns. Diving into clean and nicely
organized data from the right perspectives can increase the chances of making the right
discoveries.
• A skilled diamond miner knows what a diamond looks like. Similarly, a skilled data miner
should know what kinds of patterns to look for. The patterns are essentially about what hangs
together and what is separate. Therefore, know- ing the business domain well is very
important. It takes knowledge and skill to discover the patterns. It is like finding a needle in a
haystack. Sometimes the pattern may be hiding in a plain sight. At other times, it may take a
lot of work and looking far and wide, to find surprising useful patterns. Thus, a systematic
approach to mining data is necessary to efficiently reveal valuable insights.

26

Use of Pattern
Organizations can find out an employee's arrival time at the office
by when their cell phone shows up in the parking lot. Observing the
record of the swipe of the parking permit card in the company
parking garage, can inform the organization whether an employee
SȚ in the office building or out of the office at any moment in time.

27

Data Processing Chain

28

DATA:
• Anything that is recorded is data. Observations and facts are data: anecdotes Data and
opinions are also data, of a different kind.
• Data can be numbers. like the record of daily weather, or daily sales. Data can be
alphanumeric, such as the names of employees and customers O can come from any
number of sources from operational records 1n- Data side an organization, or from records
compiled by the industrial bodies and government agencies.
• Data can come from individuals telling stories from memory and from people's interaction in
social contexts, or from machines reporting their own status or from logs of web usage Data
can come in many ways it may come as paper reports, or as a file stored on a computer.
• It may be words spoken over the phone. It may be e-mail or chat on the Internet or may
come as movies and songs in DVDs, and so on. There is also data about data that is called
metadata. For example, people regularly upload videos on YouTube.
• The format of the video file (whether high resolution or lower resolution) is metadata. The
information about the time of uploading is metadata. The account from which it was
uploaded is also metadata. The record of downloads of the video is also metadata

29

Database
• Database A database is a modeled collection of data that is accessible in
many ways.
• A data model can be designed to integrate the operational data of the
organızation. 'The data model abstracts the key entities involved in an
action and their relation- ships.
• Most databases today follow the relational data model and its variants.
Each data modeling technique imposes rigorous rules and constraints to
ensure the integrity and consistency of data over time.

30

DataWarehouse
• Data Warehouse A data warehouse is an organized store of data from all over
the organization specially designed to help make management decisions.
Data can be extracted from operational database to answer a particular set of
queries.
• This data, com bined with other data, can be rolled up to a consistent
granularity and uploaded to a separate data store called the data warehouse.
Therefore. the data warehouse is a simpler version of the operational
database, with the purpose of addressing reporting and decision-making
needs only.
• The data in the warehouse cumula- tively grows as more operational data
becomes available and is extracted and appended to the data warehouse.
Unlike in the operational database, the data values in the warehouse are not
updated

31

Data Mining
• Data Mining is the art and science of discovering useful and innovative
patterns from data.There is a wide variety of patterns that can be found in
the data. There are many techniques, simple or complex, that help with
finding patterns.

32

DataVisualization
• DataVisualization As data and insights grow in number, a new
requirement is the ability of the executives and decision makers to absorb
this information in real time.There BSI limit to human comprehension and
visualization capacity.That is a good reason to prioritize and manage with
fewer but key variables that relate directly to the Key Result Areas (KRAs) of
a role.
• Here are a few considerations when presenting using data: = Present the
conclusions and not just report the data. Choose wisely from a palette of
graphs to suit the data. Organize the results to make the central point stand
out Ensure that the visuals accurately reflect the numbers. Inappropriate
visu- als can create misinterpretations and misunderstandings = Make the
presentation unique, imaginative and memorable

33

What is data analytics ,Data science,Data processing chain,regression,decision Tress.ppt

More Related Content

What is data analytics ,Data science,Data processing chain,regression,decision Tress.ppt

  • 1. What is data analytics? Most companies are collecting loads of data all the time—but, in its raw form, this data doesn’t really mean anything. This is where data analytics comes in. Data analytics is the process of analyzing raw data in order to draw out meaningful, actionable insights, which are then used to inform and drive smart business decisions. A data analyst will extract raw data, organize it, and then analyze it, transforming it from incomprehensible numbers into coherent, intelligible information. Having interpreted the data, the data analyst will then pass on their findings in the form of suggestions or recommendations about what the company’s next steps should be. , businesses and organizations are able to develop a much deeper understanding of their audience, their industry, and their company as a whole—and, as a result, are much better equipped to make decisions and plan ahead.
  • 2. You can think of data analytics as a form of business intelligence, used to solve specific problems and challenges within an organization. It’s all about finding patterns in a dataset which can tell you something useful and relevant about a particular area of the business—how certain customer groups behave, for example, or how employees engage with a particular tool. Data analytics helps you to make sense of the past and to predict future trends and behaviors; rather than basing your decisions and strategies on guesswork, you’re making informed choices based on what the data is telling you. How businesses use data analytics Armed with the insights drawn from the data, businesses and organizations are able to develop a much deeper understanding of their audience, their industry, and their company as a whole—and, as a result, are much better equipped to make decisions and plan ahead.
  • 3. What’s the difference between data analytics and data science? Data analytics A data analyst will seek to answer specific questions or address particular challenges that have already been identified and are known to the business. To do this, they examine large datasets with the goal of identifying trends and patterns. They then “visualize” their findings in the form of charts, graphs, and dashboards. These visualizations are shared with key stakeholders and used to make informed, data-driven strategic decisions.
  • 4. Data science: • A data scientist, on the other hand, considers what questions the business should or could be asking. • They design new processes for data modeling, write algorithms, devise predictive models, and run custom analyses. • For example: They might build a machine to leverage a dataset and automate certain actions based on that data—and, with continuous monitoring and testing, and as new patterns and trends emerge, improve and optimize that machine wherever possible.
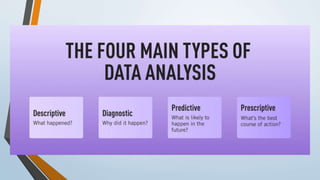
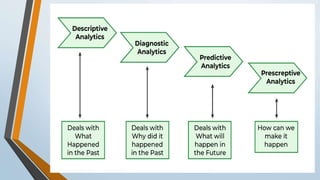
  • 5. What are the different types of data analysis? Now we have a working definition of data analytics, let’s explore the four main types of data analysis: descriptive, diagnostic, predictive, and prescriptive.
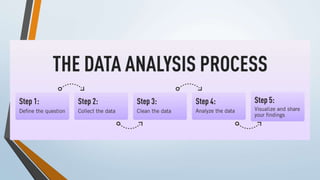
  • 7. What is the typical process that a data analyst will follow? Now we’ve set the scene in terms of the overall data analyst role, let’s drill down to the actual process of data analysis. Here, we’ll outline the five main steps that a data analyst will follow when tackling a new project:
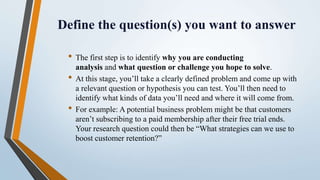
  • 9. Define the question(s) you want to answer • The first step is to identify why you are conducting analysis and what question or challenge you hope to solve. • At this stage, you’ll take a clearly defined problem and come up with a relevant question or hypothesis you can test. You’ll then need to identify what kinds of data you’ll need and where it will come from. • For example: A potential business problem might be that customers aren’t subscribing to a paid membership after their free trial ends. Your research question could then be “What strategies can we use to boost customer retention?”
  • 10. Collect the data • With a clear question in mind, you’re ready to start collecting your data. Data analysts will usually gather structured data from primary or internal sources, such as CRM software or email marketing tools. • They may also turn to secondary or external sources, such as open data sources. These include government portals, tools like Google Trends, and data published by major organizations such as UNICEF and the World Health Organization.
  • 11. Clean the data • Once you’ve collected your data, you need to get it ready for analysis— and this means thoroughly cleaning your dataset. Your original dataset may contain duplicates, anomalies, or missing data which could distort how the data is interpreted, so these all need to be removed. Data cleaning can be a time-consuming task, but it’s crucial for obtaining accurate results.
  • 12. Analyze the data • Now for the actual analysis! How you analyze the data will depend on the question you’re asking and the kind of data you’re working with, but some common techniques include regression analysis, cluster analysis, and time-series analysis (to name just a few). • We’ll go over some of these techniques in the next section. This step in the process also ties in with the four different types of analysis we looked at in section three (descriptive, diagnostic, predictive, and prescriptive).
  • 13. Visualize and share your findings • This final step in the process is where data is transformed into valuable business insights. Depending on the type of analysis conducted, you’ll present your findings in a way that others can understand—in the form of a chart or graph, for example. • At this stage, you’ll demonstrate what the data analysis tells you in regards to your initial question or business challenge, and collaborate with key stakeholders on how to move forwards. This is also a good time to highlight any limitations to your data analysis and to consider what further analysis might be conducted.
  • 14. What skills do you need to become a data analyst? Hard skills • Mathematical and statistical ability • Knowledge of programming languages such as SQL, R, or Python • An analytical mindset Soft skills Keen problem-solving skills Excellent communication skills Adaptability
  • 15. • Data analytics is an important field that involves the process of collecting, processing, and interpreting data to uncover insights and help in making decisions. Data analytics is the practice of examining raw data to identify trends, draw conclusions, and extract meaningful information. This involves various techniques and tools to process and transform data into valuable insights that can be used for decision-making. • we will learn about Data analytics,data which will help businesses and individuals that can help them to enhance and solve complex problems, Types of Data Analytics, Techniques, Tools, and the Importance of Data Analytics
  • 16. What is Data Analytics? In this new digital world, data is being generated in an enormous amount which opens new paradigms. As we have high computing power and a large amount of data we can use this data to help us make data-driven decision making. The main benefits of data-driven decisions are that they are made up by observing past trends which have resulted in beneficial results.
  • 17. Understanding Data Analytics • Data analytics encompasses a wide array of techniques for analyzing data to gain valuable insights that can enhance various aspects of operations. By scrutinizing information, businesses can uncover patterns and metrics that might otherwise go unnoticed, enabling them to optimize processes and improve overall efficiency. • For instance, in manufacturing, companies collect data on machine runtime, downtime, and work queues to analyze and improve workload planning, ensuring machines operate at optimal levels. • Beyond production optimization, data analytics is utilized in diverse sectors. Gaming firms utilize it to design reward systems that engage players effectively, while content providers leverage analytics to optimize content placement and presentation, ultimately driving user engagement.
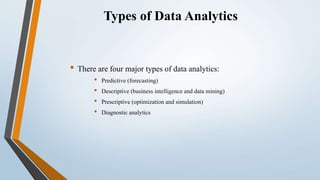
  • 18. Types of Data Analytics • There are four major types of data analytics: • Predictive (forecasting) • Descriptive (business intelligence and data mining) • Prescriptive (optimization and simulation) • Diagnostic analytics
  • 20. What is Business Intelligence? • Business Intelligence is one of the most powerful tools many organizations use to know their customer base and market better. It describes the business methodology in which the raw data is transformed into useful information which helps in decision making. Benefits of Business Intelligence • Business intelligence has broad applications, and if talking about the benefits of business intelligence in the retail sector, nowadays business intelligence tools enable organizations to take benefit of data not only to assume current sales but also to estimate future potential, patterns, trends and know the demand of the customer on a deeper level.
  • 21. Pattern • Pattern is everything around in this digital world. A pattern can either be seen physically or it can be observed mathematically by applying algorithms. • Example: The colors on the clothes, speech pattern, etc. In computer science, a pattern is represented using vector feature values.
  • 22. What is Pattern Recognition? Pattern recognition is the process of recognizing patterns by using a machine learning algorithm. Pattern recognition can be defined as the classification of data based on knowledge already gained or on statistical information extracted from patterns and/or their representation. One of the important aspects of pattern recognition is its application potential. Examples: Speech recognition, speaker identification, multimedia document recognition (MDR), automatic medical diagnosis.
  • 23. Temporal Pattern It is something that regularly occurs overtime. Ex: A temporal rule would be that "some people are always late," no matter what the occasion or time. Some people may be aware of this pattern and some may not. Understanding a pattern like this would help dissipate a lot of unnecessary frustration and anger. One can just joke that some people are born "10 minutes late," and laugh it away. Similarly, Parkinson's Law states that work expands to fill up all the time available to do it.
  • 24. Spatial Pattern Patterns can also be spatial such as things being organized in certain way. Functional Patterns Patterns can be functional which means doing certain things leads to certain effects A functional pattern may involve test-taking skills. Some students perform well on essay-type questions. Others do well in multiple-choice questions. Yet other students excel in doing hands-on projects, or in oral presentations. An awareness of such a pattern in a class of students can help the teacher design a balanced testing mechanism that is fair to all.
  • 25. Finding a Pattern • Diamond mining is the act of digging into large amounts of unrefined ore to dis- cover precious gems or nuggets. Similarly, data mining is the act of digging into large amounts of raw data to discover unique nontrivial useful patterns. Data is cleaned up, and then special tools and techniques can be applied to search for patterns. Diving into clean and nicely organized data from the right perspectives can increase the chances of making the right discoveries. • A skilled diamond miner knows what a diamond looks like. Similarly, a skilled data miner should know what kinds of patterns to look for. The patterns are essentially about what hangs together and what is separate. Therefore, know- ing the business domain well is very important. It takes knowledge and skill to discover the patterns. It is like finding a needle in a haystack. Sometimes the pattern may be hiding in a plain sight. At other times, it may take a lot of work and looking far and wide, to find surprising useful patterns. Thus, a systematic approach to mining data is necessary to efficiently reveal valuable insights.
  • 26. Use of Pattern Organizations can find out an employee's arrival time at the office by when their cell phone shows up in the parking lot. Observing the record of the swipe of the parking permit card in the company parking garage, can inform the organization whether an employee SȚ in the office building or out of the office at any moment in time.
  • 28. DATA: • Anything that is recorded is data. Observations and facts are data: anecdotes Data and opinions are also data, of a different kind. • Data can be numbers. like the record of daily weather, or daily sales. Data can be alphanumeric, such as the names of employees and customers O can come from any number of sources from operational records 1n- Data side an organization, or from records compiled by the industrial bodies and government agencies. • Data can come from individuals telling stories from memory and from people's interaction in social contexts, or from machines reporting their own status or from logs of web usage Data can come in many ways it may come as paper reports, or as a file stored on a computer. • It may be words spoken over the phone. It may be e-mail or chat on the Internet or may come as movies and songs in DVDs, and so on. There is also data about data that is called metadata. For example, people regularly upload videos on YouTube. • The format of the video file (whether high resolution or lower resolution) is metadata. The information about the time of uploading is metadata. The account from which it was uploaded is also metadata. The record of downloads of the video is also metadata
  • 29. Database • Database A database is a modeled collection of data that is accessible in many ways. • A data model can be designed to integrate the operational data of the organızation. 'The data model abstracts the key entities involved in an action and their relation- ships. • Most databases today follow the relational data model and its variants. Each data modeling technique imposes rigorous rules and constraints to ensure the integrity and consistency of data over time.
  • 30. DataWarehouse • Data Warehouse A data warehouse is an organized store of data from all over the organization specially designed to help make management decisions. Data can be extracted from operational database to answer a particular set of queries. • This data, com bined with other data, can be rolled up to a consistent granularity and uploaded to a separate data store called the data warehouse. Therefore. the data warehouse is a simpler version of the operational database, with the purpose of addressing reporting and decision-making needs only. • The data in the warehouse cumula- tively grows as more operational data becomes available and is extracted and appended to the data warehouse. Unlike in the operational database, the data values in the warehouse are not updated
  • 31. Data Mining • Data Mining is the art and science of discovering useful and innovative patterns from data.There is a wide variety of patterns that can be found in the data. There are many techniques, simple or complex, that help with finding patterns.
  • 32. DataVisualization • DataVisualization As data and insights grow in number, a new requirement is the ability of the executives and decision makers to absorb this information in real time.There BSI limit to human comprehension and visualization capacity.That is a good reason to prioritize and manage with fewer but key variables that relate directly to the Key Result Areas (KRAs) of a role. • Here are a few considerations when presenting using data: = Present the conclusions and not just report the data. Choose wisely from a palette of graphs to suit the data. Organize the results to make the central point stand out Ensure that the visuals accurately reflect the numbers. Inappropriate visu- als can create misinterpretations and misunderstandings = Make the presentation unique, imaginative and memorable