


Winning with Video in a Multiscreen World
- 1. WINNING WITH VIDEO IN A MULTISCREEN WORLD Daren Poole Global Brand Director, Creative Development Leila Buckley Global Innovations Director 1st March 2017
- 2. Speakers Global Brand Director, Creative Development DAREN POOLE Global Innovations Director LEILA BUCKLEY
- 3. 3 IN TODAY’S WEBINAR 01 THE POWER OF VIDEO IN STORYTELLING - ARE ALL SCREENS EQUAL? 02 FIVE KEY CONSIDERATIONS 03 CASE STUDY
- 4. THE POWER OF VIDEO IN STORYTELLING: ARE ALL SCREENS EQUAL? 01 4
- 5. 5 VIDEO HAS ALWAYS BEEN A COMPELLING MEANS OF TELLING BRAND STORIES
- 6. Source: Group M, ‘This Year, Next Year’, December 2016 6 Everything changed when digital arrived. Global share of media spend: 0 5 10 15 20 25 30 35 40 45 2006 2007 2008 2009 2010 2011 2012 2013 2014 2015 2016f 2017f TV Internet Newspaper Magazine Outdoor Radio
- 7. Marketers can connect across more screens and on more platforms than ever before 7
- 8. 8 Q: Can I use the same video asset across multiple screens and platforms?
- 9. 9 There is a difference between how online video content engages consumers compared to TV
- 10. 10 The way you evaluate an ad matters IN PERSONAL CONTEXT NO CONTEXT IN GENERIC CONTEXT
- 11. FIVE KEY CONSIDERATIONS FOR MULTISCREEN VIDEO 02 11
- 12. 12 Generating (the right) emotional response is always important
- 13. Source: Kantar Millward Brown 13 Think carefully about video length AVERAGEADVIEWED(%) VIDEO LENGTH (SECONDS)
- 14. 14 … particularly on Facebook Average Ad Viewed % vs. Expected (from Length) by Facebook Autoplay and YouTube PreRoll 0 20 40 60 80 100 0 30 60 90 120 150 180 210 VIDEO LENGTH (SECONDS) AVERAGEADVIEWED(%) YOUTUBE FACEBOOK
- 15. 15 As people will skip, creative structure is critical OVERALLSTRENGTHOFASSOCIATION AFFORDABLE CALM CAREFUL CLEVER DIFFERENT FUN KIND RELIABLE SOCIAL TRENDSETTER WEAK AUTOMATIC INTUITIVENESS OF ASSOCIATION AUTOMATIC AND WIDESPREADWIDESPREAD, BUT REQUIRE REFLECTION POPULAR
- 16. 16 Not all video is audio video Average unmute in Facebook autoplay 21%
- 17. 17 Branding matters more than ever in digital
- 18. BRINGING IT TO LIFE: A CASE STUDY 03 18
- 19. 19 Our case study is based on our latest solution, Link for Video Combining neuro, behavioral and survey data together: Objective of the solution: Overall Creative Power of the Video and potential within each context ONLINE Pre Roll Context TV Neutral Context SOCIAL MEDIA Context (optional cell)
- 20. NB: Illustrative case study as not client commissioned, video objectives created by Kantar Millward Brown. https://www.youtube.com/watch?v=0KMyK4KbJn8 20 Smart ForFour Case Study Let’s take a quick look at the video before we get started!
- 21. https://labs-portal.affectiva.com/portal/auth/login Base: Total (225), TV/Neutral (125), Pre-roll (100), Social (100) NB: Illustrative case study as not client commissioned, video objectives created by Kantar Millward Brown. 21 Smiles (Facial Coding) – view 1 and 2 Highly emotional instinctive response translates into a strong appreciation of the video Men pull up to park Reverse park Scream/recovery Explanation Finishes reverse park Detailed info 1st exposure 2nd exposure Smiles peak just after scream scene 2nd exposure is heightened (off the scale!) Enjoyment 75th percentile 33% 14% 6%
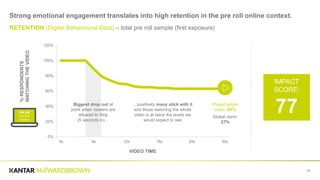
- 22. 22 Strong emotional engagement translates into high retention in the pre roll online context. RETENTION (Digital Behavioural Data) – total pre roll sample (first exposure) 0% 20% 40% 60% 80% 100% 120% 0s 6s 12s 18s 24s 30s %RESPONDENTS WATCHINGTHEVIDEO Biggest drop out at point when viewers are allowed to Skip (5 seconds in)… …positively many stick with it and those watching the whole video is at twice the levels we would expect to see Played whole video: 63% Global norm: 27% VIDEO TIME ONLINE Pre Roll Context IMPACT SCORE: 77
- 23. 23 There is a marked difference in the way people respond to the ad in the social context 0 10 20 30 40 50 60 0 20 40 60 80 100 Holistic Evaluation Social TV Pre Roll POWERCONTRIBUTIONSCORE Doesthecreativeengageandcreateanimpression thatthebrandismeaningfullydifferent? SHORT TERM SALES LIKELIHOOD Does the creative engage and say something new, believable and immediately compelling? ONLINE Pre Roll Context SOCIAL Context Impact (Percentile) 77 57 Played whole ad (Base: Total Sample) 63% 24% Average of ad viewed (Base: Total sample) 73% 32%
- 24. 24 The proportion of the ad watched is lower than expected levels for a 30” ad in a pre roll context Average Ad Viewed % vs. Expected (from Length) by Facebook Autoplay and YouTube PreRoll Fewer watched the ad all the way to the end Those that skipped did so early on 0 20 40 60 80 100 0 30 60 90 120 150 180 210 VIDEO LENGTH (SECONDS) AVERAGEADVIEWED(%) YOUTUBE FACEBOOK Pre Roll Context Social Context
- 25. 25 Many stop watching just before the scream moment 0 10 20 30 40 50 60 70 80 90 100 0s 8s 15s 23s 30s VIDEO TIME Played whole video: 24% Global norm: 24% Average Skip time Those scroll past have most done so before the key ‘scream scene’ Approx. 20% do not notice the video Further 20% drop out in the first 5 seconds Those that skip drop off within the first 10 seconds… …before the scream scene DRIVING & REVERSE PARKING SCENES SCREAM! Average Skip time RETENTION Social Context (first exposure) FACIAL CODING Smiles (1st & 2nd Exposure)
- 26. 26 This video is heavily reliant on audio to deliver emotional reward and comms Base: Total (225), TV/Neutral (125), Pre-roll (100), Social (100) NB: Illustrative case study as not client commissioned, video objectives created by Kantar Millward Brown. MESSAGE CHECK – social % strongly agree Smart Forfour is available from £149 per month 34 Smart Forfour is a compact city car 25 Smart Forfour is so small you will forget it is a 4 seater car 20 INTERACTION WITH THE VIDEO Unmute Exposure 1 (natural context) 6 Exposure 2 (controlled) 46 INTUITIVE ASSOCIATIONS – pre roll/TV % fast yes Comfort 30
- 27. 27 A. You might be able to use the same asset across screens – but not always Times have changed and research approaches have evolved. Link for Video makes the most of all the different ways we can understand and optimise the power of a video to influence how people feel about a brand Neuroscience Survey DataBehavioural Data
- 28. 28 We can help you maximise ROI from all of your creative LINK™ Video TVCampaign LINKNOW Magazine/N ewspaper Point of Sale Out of Home LINKEXPRESS™ Mobile Video Online Video TV Mobile Display Online Display
- 29. 29 QUESTIONS
Editor's Notes
- Hello and thank you for joining us on this webinar. My name’s Daren Poole and I’m the global brand director for Creative Development at Kantar Millward Brown. We’re very pleased to be sharing our latest learning and insight on creating video for a multiscreen world. Before we start, a few words of housekeeping. If you experience any connection or audio issues, please try refreshing your browser. Hopefully this resolves things for you and you’ll be able to hear us and view the screen and video which we’ll play. If you have further issues or indeed if you have any questions you’d like to pose, please use the ‘ask a question’ feature and we will endeavour to respond during the call or will follow-up directly after the broadcast.
- I always find it useful to be able to visualise the person that’s speaking to me on a call or in a webinar… so that’s me on the left and I’m joined today by Leila Buckley, who is a Global Innovations Director at Kantar Millward Brown and who led the research and development that generated the insights for our session today.
- Over the next 30 minutes we’re going to take you through a three part story. First, we’re going to set the stage for the research that we’ve conducted, leading us to the question that a lot of our clients were asking us, which is in a world with more screens than ever, and with more publishers and platforms on them, are all screens equal? We’ll go on to answer that and share five key principles that we learned to be of importance for multi-screen success. Then to bring the theory to life, Leila will share a case study, showcasing those considerations.
- So, without further ado, let’s get to the question that many of you were asking us.
- Stories present one of the best opportunities for brands to engage people and make them feel something so ultimately they understand the brand’s meaningful difference and purpose. They hook us in through a sequence of events that progress and pique our interest and we love to see them resolved as we are naturally curious. They also provoke an emotional response which is critical for building an emotional connection with a brand. Stories can help us deliver specific product information not only in a more interesting way, but in a way that actually makes it seem more credible. It is the same principle that has been used for thousands of years in parables in religious teachings. By conveying lessons and teachings as stories, they are easier to understand, more memorable, and more likely to be seen as important than the lesson alone would be. And of course, the ideal medium for telling a brand story is video – or more accurately audio video: the combination of the two allows us to tell stories featuring a relatively complex series of events in a highly engaging way.
- Now, until ten years ago, even five years ago, and even today in some markets, telling that brand story in video was a relatively straightforward matter. At the annual brand planning and budgeting stage, you defined how many TVCs you needed the year after. For many brands, it was three or four. The TV planning and production process tended to be quite polished, with decent lead times and time and resource for creative development research. Some ads were clearly much more effective than others, but they were easier times overall. Then digital happened. This slide shows the evolution of global media spend over the last ten years, as measured by Group M. They forecast that a third of all advertising spend this year - $182 billion will be in digital. While clearly the picture is very different around the world – digital will account for 57% of spend in China but just 4% in Brazil – for most of you listening today, digital will form part of your plans and will have made your life a little more complicated than it was in the days when TV was a much more dominant player.
- Digital provides immense opportunities for brands to tell consumers stories in more timely, personal, relevant ways than ever before. In our AdReaction 2015 study, consumers told us that half of their daily video consumption was on a digital device: an average of an hour and 45 minutes a day. The fact is, though, that more screens suggest that more content is needed. That’s particularly the case when you consider that digital screens house so many publishers and platforms that cater to different consumer needs and wants and therefore, seemingly, you need to develop different storytelling styles. Add to that more evidence from this year’s AdReaction: consumers are far less receptive to advertising on digital screens than on TV screens; half of gen Zs (under 20s who’ve never known non-digital times) have blocked digital advertising and over two-thirds skip ads or pay a premium for ad-free content. At the same time, TV has changed too. Again, AdReaction data tells us that globally, a third of TV viewing is catch-up or on demand and rising: meaning that the audience that sits passively and obediently through an ad break is in decline. The good news, based on the work that we’ve done, is that they way to overcome the tendency to avoid advertising ACROSS screens is to make people want to watch it – make it as enjoyable as possible, make it fit as seamlessly as possible into the content that it interrupts – in other words, tell GOOD stories.
- Given that there are so many screens to fill – but also given that for many brands, production and media budgets are at best flat – many of our clients have asked us whether the same video can be used in different places. Conventional wisdom has always been that you shouldn’t do it. Different platforms have different viewing contexts and therefore need different content. Some of our early work showed that quality of creative was more important than whether online content was repurposed TV or made for digital. It also said that made for web content would perform better than repurposed content on entertainment, movie and TV sites. Often, what we observe among our clients is that 30 second TVCs are deployed unchanged in digital – or maybe they’re cut down to a 15 second beforehand. So, last year we set out to the answer the question, ‘can I use the same video asset across screens and platforms’ once and for all. We conducted research across a number of markets and a multitude of contexts to understand how they are the same and how they differ.
- Our research showed very clearly that the way that people engage with digital content is different from the way in which they engage with linear TV. For TV, the viewer’s state of mind is less focused on the context because consumption of TV is more passive and the exposure is less direct. Therefore understanding the likely attention that will be paid to the ad while it is playing on TV is important in determining efficacy. Validation of in market impact based on TV advertising, shows that ads need to actively involve viewers in either a positive or negative manner. Link’s for TV’s active involvement survey question has always been a key indicator of the likely attention you will pay to the ad and directly relates to TV ad awareness. In our R&D we found that evaluation of likely ‘attention’ paid during screen time is unique to TV and is not needed to determine the impact of digital copy. In the online environment, active involvement does not relate to how much of a video a consumer chooses to watch nor does it show a relationship to online ad awareness. What’s more, there are differences in the way in which people engage with different digital platforms, which means that social media and pre roll should be treated differently when determining what drives creative impact. As pre-roll precedes the video that viewers have set out to watch, the consumer’s mindset is mission based. Their attention is already focused on the screen as they wait for their video to play. In this context, attracting attention to the ad is less important. On Facebook people are more typically browsing within a personal and social environment. There is a great deal of personal content to draw attention so there is a lot of distraction to overcome if a video is to stand out. This becomes increasingly difficult for the auto play ads which play in mute. In this context, therefore, it is important to include a measure of whether people will stop and look at the video, as a key indicator of attention the video is likely to receive while it is playing.
- Recognising this, our new Link for Video solution has different impact predictions for different contexts, and we’re also rolling these out to our Link for Digital solutions. Our research also proved to us that the way you research video matters too. A first learning was that you can use out of context questioning to determine how your creative will work on TV, which allows us to be future proof as more viewers move away from linear TV. We also saw that in just over half of cases, measures taken in context-free evaluation can predict how the video will work on different platforms. That means that in just under half of cases it doesn’t – these are cases where the ad is enhanced by a context (for example, the creativity revolves around viewer control of the exposure so it’s obvious it’s made for digital), OR they’re rejected in some contexts if they have a somewhat risqué nature, OR sometimes performance is suppressed in some digital contexts because they’re dependent on audio, which isn’t always enabled. We also learned that another important consideration is that you can only gauge how people will interact with an ad in context. The reality is that, although creative power relates to whether you watch an ad or not, it is not the only reason. Mission-based state of mind or the urgency of getting to the end destination can affect how much of the ad is watched. For these reasons, Link for Video, as well as our Link for Digital solutions include ad exposure in live context so that responses are as sensitive as they can possibly be and so that we can capture behavioural data.
- So, having established that there can be differences in how the same creative works on different platforms, what then should you be thinking about as you create video that may be deployed across multiple screens?
- The first consideration is that emotional engagement with the creative is always important. As we said earlier, stories are a fantastic delivery vehicle for emotional response. On TV, enjoyable creative can be the element that drives engagement in the viewer’s passive viewing state. Our work on multiscreen viewing has shown that enjoyment is just as important in driving advertising memories in digital contexts. That’s an entirely logical conclusion if you think about it: if you show viewers something that enhances the interruption to their intended destination rather than disrupting it, you’re far more likely to benefit. We’ve always believed that consumers are capable of accurately reporting their emotional response to advertising. As part of our R&D program on multiscreens, though, we looked more closely at the data from thousands of ads that we’ve conducted facial coding on, since it became a core part of Link. We saw that the true system one response is not only a sensitive evaluation and diagnostic of emotional intensity, scene by scene, but also that there is a clear response between the intensity of response and sales. We have, therefore, included facial coding as a central part of how we measure the viewer’s journey through the ad in Link for Video, but we are also including it in our impact measure – or awareness index prediction – for TV.
- The second consideration is around length of execution. Longer ads have greater storytelling potential and digital gives far greater licence to run longer length film. In the past, at Kantar Millward Brown, we’ve examined the potential of digital creative from six seconds to six minutes, when viewed in its entirety. Now that we’ve had in context, behavioural measurement in place for some time, we have been able to look more closely at the impact of ad length on viewer retention. What we’ve learned is that although the cost/efficiency trade-off seen for longer TV ads does not apply to digital, there is a clear trade-off in viewer retention. It becomes increasingly difficult to retain your audience beyond 90 seconds, and there is a strong retention bias towards shorter ads. Ad length is therefore an important consideration when contextualising viewer retention. We often hear the argument that it doesn’t matter if viewing isn’t to completion if only full views are paid for. Arguably, you want every exposure to deliver, particularly when there is significant investment in production.
- Still on this point about length, we would expect to see a different response in Facebook compared with YouTube. In YouTube, where exposure is forced for the first five seconds, of course initial retention will be higher. In contrast, people need to notice the ad in Facebook before they can watch it. Therefore contextualising response in the relevant context gives you a better understanding of the video’s performance.
- While we’ve seen that creative length has a clear relationship with retention, we don’t see the same relationship between ad length and the impressions that are taken away and therefore the overall effectiveness of the copy. There are two important points here First, the relationship between the amount of the ad viewed and ROI is not linear. It’s heavily related to when the most compelling parts of the video are, if the brand and intended impressions are integrated into that AND if the viewer has skipped or not at that point. From a research perspective, this means we need to bring together behavioural data, facial coding data and survey responses in order to determine if what an average viewer gets to see is going to deliver ROI for the brand. It doesn’t mean that you need to load what you want to say at the front of the video – this is a risky approach that may accelerate skipping rather than preventing it. The second point relates to the notion of ‘what you want to say’. Increasingly, and, we believe, particularly in digital, you need to be less explicit and more implicit around communication. Because we tend to pay fleeting attention to video, we don’t think about messages in ads. Asking viewers what an ad said to them can be a good way of getting at if the ad contains certain messages, but implicit measurement techniques give us a much better read of what will be retained in real life. Using speed of response tests as standard in Link for Video allows us to evaluate in a realistic way what the ad will do for brand associations.
- Our fourth consideration relates to one of our early points about the power of video advertising. We said it’s the combination of audio and video that has the ability to engage people. Well, not all video is audio video. Across all of the behavioural measurement that we’ve conducted in Facebook, only just over 20% of people unmute the video when they’re watching it. We suggest therefore, that you ask yourself certain questions as you create your video: If it’s planned to run on Facebook, does it work without sound? If not, could it work with the addition of supers? Or indeed, other devices that encourage the viewer to turn sound on, as in this Australian Kit Kat video? Alternatively, should the buy be limited to pre-roll? When tested in a Facebook context in Link for Video, we’re able to help answer these questions. We wrote this slide before Facebook announced their platform changes a couple of weeks ago. It will be interesting to see if the audio consideration goes away – or if people will choose to mute their devices or disable automatic audio in their Facebook settings.
- The final thought concerns branding. We’ve always been strong advocates of branding at Kantar Millward Brown as if you don’t have strong branding, all you have is at best a beautiful film. To turn that film into something that generates sales over the short and long terms, you need to link it to your brain’s associations about the brand. Over the years, we’ve talked about getting branding through its strong integration into the story line, or the use of distinctive brand assets, or indeed a distinctive creative style. These are just as important in digital channels. If you’re a brand that people like, there’s a good chance they’ll stop and look at you in social channels: we like hearing from those we like. The implication of this is that it is worth branding early. This has the added benefit of making the exposure a branded one, even in videos that consumers skip. So there are the five key thoughts: is your video enjoyable in all contexts; is it longer than it needs to be; is it structured optimally for how people view on mobile devices; does it work in mute and is the brand integral? I could talk at longer length about our findings from our R&D, but instead, let me hand over to Leila who is going to bring our R&D and the resulting considerations to life, with a case study. Over to you Leila.
- Thanks Daren. Hello everyone! The case study I am going to take you through brings to life some of the things Daren’s talked about and is a really good example of how the same video can work quite differently in different contexts.
- The case study comes from a Link for Video pilot. Link for video is our latest core solution. It is one study made up of three contexts, TV, Online pre roll and social context. The objective of this solution is to provide a holistic understanding of the overall creative power of the video as well as providing a context specific evaluation with a view to optimizing performance in each context.
- The case study is based on one of the launch ads for the Smart for four model which aired in the UK last year. This video was part of a campaign to launch the new 4 seater model and communicate their ‘Feels big. Drives small’ proposition. We ‘d imagine form the concept of ‘feel big, drive small’ that the objectives for the video would have been; Firstly to deliver the news of the launch of a four-seater model and in doing so communicate ‘spaciousness’ And secondly make sure that the key benefits of agility and compact design, associate with the smartcar brand, are not compromised. Before we launch into the detail of how people reacted lets take a look at the ad itself.
- People really loved the ad. They really liked the element of surprise (quite literally) and there was a really strong appreciation of the joke. Enjoyment sits in the top 25% of our UK ads We use facial coding as our system 1 measure of emotional reaction. And what you can see here is the smiles that this video generates. If we look at the emotional journey through the ad we see, not surprisingly, that there is a really strong reaction to the scene where the driver is startled by his passenger in the back of the car. What is particularly interesting about the reaction to this ad though, is that expressiveness towards the ad (measured here by smiles) is actually stronger in the second exposure. You can see this from looking at the green dotted line – which is actually off the scale. And this peak that we see in second exposure around the ‘scream’ scene shows that not only have people enjoyed watching the ad but they are actually looking forward to what is coming up when they watch it for a second time. Up to this point of the scream there is no real sound. No talking or any other audio so there is a kind of suspended tension that builds up the point of the scream and this adds to the humour of the ad. You then hear a sound track of really up beat lively music and the joke is reinforced on screen and this ties together the story and the brand message. The fact that the smartfor four car is so compact you will forget it is a four seater. So we know from the facial coding that this scene has the audiences attention and quite brilliantly this is the scene that contains both the spacious message and the compact message, which makes this ad a very power creative.
- And we see the strength of this video is reinforced when we take a look at behavioural data from the pre roll context. This chart shows viewer retention. The Y axis shows the % of people watching the ad at a given time and the X asis is the ad length. From this we can tell how many people watched the video to the end and where people tended to drop out. ***We would always expect to see a drop off after 5 seconds in pre roll. That is because this is the first opportunity people have to skip within a pre roll context. If you think about the mind set of the viewer in pre roll, as Daren said earlier, they are very much goal orientated and an ad is actually an interruption and a kind of obstacle getting in the way of their end goal. So even the very best of ads will get skipped. What is really interesting about this ad is that beyond that 5 second opportunity to move on we see very few stop watching the ad. And actually the proportion of people that watch the ad to the end is very high. The 27% norm is based on expected retention levels for 30 second ads in a pre roll context. And it is essential to judge retention based on ad lengths to give a fair reflection of performance. As we said earlier there is a clear bias towards shorter ads. The longer the ad the lower the expected retention. So coming back to the smart for four ad, we see that the % of those that watched the ad all the way through is actually over twice the levels we would expect to see for a 30 second ad. And this reinforces the strength of this video.
- The results I have shown you so far are based on response to this video in a TV and pre roll context, and you have seen that this video is exceptionally well received in these contexts. But when we look at both the short and long term effect of the same video in the social context, we see a very different picture. Particularly affecting the long term potential of the execution. If I can just turn your attention to the impact score for the ad on the right hand side of this chart. The impact score is our validated predictive measure of in market response. If you think of it as a measure of emotional engagement and therefore the potential an ad has to positively influence and shape brand associations. You can see that in the pre roll context this ad sits in the top 25% of UK ads but generates a much lesser reaction in the social context. And when we look at the behavioural measures that relate to how much of the ad is watched, these are also much weaker. Significantly fewer make it to the end of the ad and significantly less of the ad is viewed in the social context. Lets take a closer look at what is behind the difference in response in the social context.
- We would expect that overall retention is lower in the social context because people will simply scroll past if the ad doesn’t draw them in. Whereas there is a forced exposure for a minimum of 5 seconds in the pre roll context meaning everyone will see at least 5 seconds of the ad. We therefore put performance into context by both ad length and context. The average % of the ad viewed was particularly low for the video in the social context – falling significantly behind pre roll and significantly below expected levels for a 30 second video. There are two reasons for this low result.
- The first reason relates to the number of people that missed the ad in the first place. If we look at the retention chart approx 20% of people didn’t even notice the ad so they would not be counted in retention. This affects end % that watched the ad all the way through to the end The second reason relates to those that decided to scroll past the ad after noticing it and the proportion that decided to scroll away from the ad did so quite quickly. In fact among those that scrolled away, the average skip time was just under 10 seconds. This was just before the high point of the ad. Whys is this? If you think back to what is happening before the ‘scream scene’ there is very little action – the ad shows the smart car getting ready to park. On the plus side the car was an instant cue for the brand as many recognised the distinctive car as a smartcar even if they didn’t go on to watch and enjoy the ad. But on the minus side – the beginning didn’t hook people in and they simply scrolled past. So the weaker response on behavioural measures can be explained by a lack of engagement in the set up scenes to draw people in and keep them interested. But this does not explain why we saw such a difference in response to the ad overall as the impact score is not based on partial exposure. Our respondents see the ad twice and in the second exposure we direct them to watch the whole ad.
- The biggest issue stems from the way that people chose to watch the ad in the social context. The majority watched the video in mute. Even in the second exposure, which is when we direct people to watch the ad in full, less than half watched the ad with audio. And it is the absence of sound that compromised the ad. And there are two implications. Firstly, in terms of the video’s ability to entertain. This is because people miss the joke - if they didn’t hear the scream they missed the humour. The second implication is in the video’s ability to get across the intended message. If you miss the scream, you miss the ‘surprise’ which is key in delivering the message that the smart for four model is so compact and agile in design that you forget it is a four seater. Comfort, associated with a four seater model, came through very strongly in the pre roll and TV contexts and was very intuitive. We measure how intuitive a message is based on the speed in which a message is endorsed. In contrast the strongest message in the social context was actually around price and reinforcing the compact city car design. This message came through because it was reinforced on scree by the text in the ad. And actually considering that respondents were actually prompted by the message, these messages come through only at low levels. Therefore those exposed to the video in the social context miss the ‘news’ of the launch. The audio is really essential in this ad. Without the audio the launch of the new model is missed. And the launch of a 4 seater model broadens the relevance of the smartcar brand. This affects the longer term equity contribution that this ad has as well and the shorter term impact the ad can generate in this context. So just to sum up. This case study is a great example of how video can work very differently in different contexts. Because this ad was heavily dependent on audio to deliver both the humour, which was critical to engagement – and the launch message, the social context wasn’t able to realise the full potential of this video – which was exceptionally strong gin other contexts.
- Thanks Leila. At the beginning of our session, I posed the question that we hear from a lot of our clients: can I used the same video across multiple screens. We’ve shown you that that depends. Sometimes the creative approach means that it will, other times it won’t. To remove the guesswork, we’re pleased to have launched Link for Video, which integrates neuroscience measurement and behavioural measurement with existing and new survey measures to give you an accurate diagnosis of how your ads will work across screens, what this means for channel selection, and how you can optimise performance in each of them.
- Much of the thinking has also been applied our TV and digital solutions – so if your video is destined only for one screen, we can tell you how it’s going to perform in as little as 24 hours. If you’d like to find out more, please get in touch with your local Kantar Millward Brown contact. If you don’t have a contact, drop us a query on our website and we’ll connect you with someone.
- That’s the end of our content today. As a reminder, if you have any questions, feel free to pose them to us using the ‘ask a question’ feature. This session has been recorded and can be accessed via the same link used to log-on. You’re welcome to share this with colleagues who might find the content of interest. Thank you for joining us today.