Location via proxy:   [ UP ]  
[Report a bug]   [Manage cookies]                
SlideShare a Scribd company logo

1

Nuclear and Renewable Energy

Building Resources for the Future


Dr. Hashim Yamani

President
King Abdullah City for Atomic and
Renewable Energy (K.A.CARE)

2

Establishment of K.A.CARE


                     Royal Order A/35
                            April 17, 2010


                                             1

3

Royal Vision


               2

4

K.A.CARE Mandate


       The City shall aim at contributing
      to the sustainable development in
      the Kingdom through utilization of
       science, research, and industries
        related to atomic and renewable
       energy for peaceful purposes in a
          way that leads to raising the
       standards of living and quality of
               life in the Kingdom
                                            3

5

Towards energy sustainability


                                                      The Kingdom of
       The Kingdom of Energy
                                                      Sustainable Energy


                         Towards
                          greater
                       sustainability


             A new energy mix to meet local needs as well as maintain
                  leadership role in the global energy landscape
                                                                           4

6

A decision that was not taken lightly


      Saudi Arabia has the world’s largest oil
       reserves

      Saudi Arabia has the 5th largest proven
       gas reserves

         Saudi Arabia has the world’s largest swing
          capacity for oil production

             Why is Saudi Arabia is promoting the introduction of
                            alternative energies?
                                                                    5

7

Energy growth drivers


                Population growth at an annual rate
                of 3.2% (2004 – 2010)
                Robust economic growth (4.3%
                2008, 0.1% 2009, 3.8% 2010)
                Industrial production growth of
                3.1% in 2009


                                                      6

8

Projected growth in electricity peak demand


   Electricity peak demand
   GW

                               120


                70

    45


 2010          2020          2030


              At current pace, energy peak demand is expected to
                            exceed 120 GW by 2030
                                                                   7

9

Growth in oil demand between 2007 and 2010


        30

        25

        20

        15

        10

         5

         0

        -5

        -10
              Saudi Arabia   Asia   North America   Europe   Middle East   Latin America


                                                                                           8

10

Government allocation for water-related spending


              50                                                                                                   9
              45                                                                                                   8.5
              40
                                                                                                                   8
              35
              30                                                                                                   7.5
   (SR, bn)


              25                                                                                                   7
              20                                                                                                         (%)
                                                                                                                   6.5
              15
                                                                                                                   6
              10
              5                                                                                                    5.5

              0                                                                                                    5
                   2004        2005           2006           2007            2008            2009           2010

                          Water, electricity and infrastructure allocation          Ratio to total state budget


                                                                                                                               9

11

SEC planned retiring capacity


             140,000


             120,000


             100,000
                                    The Gap By
              80,000                   2030
        MW


              60,000


              40,000


              20,000            Today’s Fuel Mix
                                Extended to 2030
                  0


                                                 10

12

Forecast of energy demand growth


             3.4*                                                            8.3*
             MBOE                                                           MBOE

             2010
                                                                             2028

                   At current pace, domestic consumption of fossil fuels is
                               expected to nearly triple by 2030

   * Total local consumption (transportation, industry, electricity, etc)           11

13

Forecasted growth of alternative energy capacity worldwide


                                             1,545       4.7

                                                        Growth
                                   1,105                 rate


                          533


                          2007      2020     2030

             % Capacity   12%       17%      19%

                       % of Installed Capacity

                                                                 12

14

K.A.CARE vision


             The vision of K.A.CARE is to be:

      the driving force for making atomic and
       renewable energy an integral part of a
        national sustainable energy mix, by
      creating and leveraging the competitive
      advantages of relevant technologies for
       the social and economic development
          of the Kingdom of Saudi Arabia

                                                13

15

Gradual introduction of renewable and atomic energy


              Nuclear
              Renewables
              Fossil
    TWh


              Alternative energy will gradually replace fossil based generation

                                                                                  14

16

Sustainable energy outlook for Saudi Arabia

                                                     Wind/Other Ren


                                                     Solar PV


                                                     Solar CST
  Needed Capacity (MW)


                                                     Nuclear


                                                     New Required Fossil


                                                     New Committed


                                                     Existing Diesel


                                                     Existing HFO


                                                     Existing Crude


                                                     Existing Gas

                         2010   2020   2030   2050

                                                                       15

17

The mandate and responsibilities of K.A.CARE


                                     Policies &
                                                  Execution
                                     Strategies


                                                              Investment
                        Regulatory                            & Business


             R&D &                                                         Investment
           Technology                                                       Relations


      Human
      Capacity
                          K.A.CARE’s Mandate                                       Facilities


                                                                                                16

18

R&D&T


       National legal
        Framework
                                                  Pillars of sustainable development


        Value Chain


     National Economic
        Framework
                         Sustainable Energy Mix


       National HR
17

19

New implementation paradigm


 1.    Long Term Commitment from all Partners
          Technology
           Education / Training

 2. Contribution to GDP Creation:

           Job creation
           Value chain development
           Economic development spillovers
           Electricity generation
                                                18

20

Partnership with U.S. companies


   • Expected major role for U.S. FDI in the Saudi
     alternative energy sector:
       • FDI in Saudi Arabia exceeds $200 billion
       • U.S. has the lion share of this stock at 18%

   • Expected outcome of partnership:
       • Comprehensive value chain integration with
         electricity generation
       • Localization of niche products and services
       • Seamless integration with international product
         chains and global energy services

                                                           19

21

Reaping the fruits of sustainable development


                                                Sustainable and efficient
                                                energy future for KSA
                              Sustainable
                              alternative
    “… use of alternative     energy mix
    sustainable and
    reliable resources ...
    reduces dependency
    on hydrocarbon
    resources … and keep      Balanced
    them as a source for      execution
    income for a longer       plans
    period of time...”


                                                                            20

22

Bases for constructing recommended energy mix


  • Peak demand reduction from energy efficiency and
    conservation.
  • Liquid fuel (crude oil, diesel, and HFO) that will be
    saved by the proposed energy mix.
  • Generation related matters, such as:
     • load factors and load management
     • generation technologies and their practical
       limitations
  • Human capacity building potential.
  • International product chains and the Saudi role, in
    the alternative energy sector.
  • Local value chain
                                                        21

23

1
      15
      29
      43
      57


           60%
      71
      85
      99
     113
     127
     141
     155
     169
                        Seasonal peak variation in Saudi Arabia


     183
     197
     211
     225
     239
     253
     267
     281
     295
     309
                 100%


     323
     337
     351
22


     365

24

Typical daily demand profile variation for Saudi Arabia


            Demand profile


                                        GW
            for a summer day
            in August


                                        GW
            Demand profile
            for a winter day
            in January


                                                                                11:00
                                                                                        13:00
                                                                                                15:00
                                                                                                        17:00
                                                                                                                19:00
                                                                                                                        21:00
                                                                                                                                23:00
                                             1:00
                                                    3:00
                                                           5:00
                                                                  7:00
                                                                         9:00
                                                                                                                                        23

25

GW
      1
      15
      29
      43
      57
      71
      85
      99
     113
     127
     141
     155
     169
     183
     197
                              Annual day-night load variation for Saudi Arabia


     211
     225
     239
     253
           Night


     267
     281
     295
     309
                        Day


     323
     337
     351
24


     365

26

Electricity load profile breakdown in Saudi Arabia


                         3     Daily summer peak load


                                                                              Additional summer load = 20%
                                                                      2
                                                                                   of annual peak load


                    1        Average annual load = 65% of annual peak load
 1
     15
          29
               43
                    57
                         71
                              85
                                   99
                                        113
                                              127
                                                    141
                                                          155
                                                                169
                                                                      183
                                                                            197
                                                                                  211
                                                                                        225
                                                                                              239
                                                                                                    253
                                                                                                          267
                                                                                                                281
                                                                                                                      295
                                                                                                                            309
                                                                                                                                  323
                                                                                                                                        337
                                                                                                                                              351
                                                                                                                                                    365
                                                                                                                                                     25

27

Suitable technology choices for Saudi load profile


                                   3     Fossil – solar


                                                                  2                Solar - Fossil


                                               Nuclear – geothermal (closed cycle) – Waste-to-
                                   1
                                                energy – Concentrated solar (storage) – Fossil
 1
     15
          29
               43
                    57
                         71
                              85
                                   99
                                        113
                                              127
                                                    141
                                                          155
                                                                169
                                                                      183
                                                                            197
                                                                                  211
                                                                                        225
                                                                                              239
                                                                                                    253
                                                                                                          267
                                                                                                                281
                                                                                                                      295
                                                                                                                            309
                                                                                                                                  323
                                                                                                                                        337
                                                                                                                                              351
                                                                                                                                                    365
                                                                                                                                                    26

28

Criteria used to narrow down choices of energy mix


      Plausible energy mix criteria:
         • Sustainability
         • Economic viability
         • Technical feasibility
         • Enabling of further development

      Optimum energy mix criteria:
        • Must deliver the required capacity both
           cost-effectively and in a timely fashion

                                                      27

29

Illustrative example of a plausible energy mix


                                                  Wind /
                                                 Other Ren

                                                  Solar PV

                                                 Solar CST


                                                  Nuclear


                                                   New
                                                 Additional
                                                   Fossil


Present
 Fossil
  Mix


                                                              28

30

Comprehensive stakeholder engagement


    Saudi Arabia:
        •   Government agencies, regulator and utility
        •   Private sector
    International:
        •   Technology providers
        •   Project developers
        •   Utilities

    Activities:
      • Workshops, visits and meetings (hundreds)
      • Case studies (hundreds)
                                                         29

31

Cost benefit analysis of proposed alternative energy mix


       CAPEX plus OPEX


         Additional      Additional
          capital          Opex
           cost            Costs

                                                           30

32

Cost benefit analysis of proposed alternative energy mix


     CAPEX plus OPEX plus
     revenue from oil saved


         Additional     Additional      Value of
          capital         Opex             oil
           cost           Costs          saved

                                                           31

33

Cost benefit analysis of proposed alternative energy mix

   CAPEX plus OPEX plus
    revenue from oil saved
   plus investment in value
  chain and human capacity


                                                       Industry
         Additional     Additional      Value of         and
          capital         Opex             oil          human
           cost           Costs          saved          capital

                                                                  32

34

K.A.CARE commitment to developing alternative energy


 1. Transparency

 2. Safety and international best practices

 3. Non-proliferation and highest standards of Safeguards

 4. Localization of the nuclear and renewable value chain
    in Saudi Arabia

 5. Transparent Incentives, Off Taking, and Funding
    Mechanism


                                                            33

35

Components of K.A.CARE City

  The KA-CARE city will include the
  following
  ▪ National Sustainable Energy
      Laboratory
  ▪   Industrial clusters
  ▪   Alternative energy farm
  ▪   Energy park
  ▪   Technical training institutions
  ▪   Technical incubators
  ▪   Commercial facilities
  ▪   Convention centers, exhibition
      halls and other public amenities
  ▪ KA-CARE headquarters and
      residential facilities
  ▪ Basic infrastructure

                                         34

36

K.A.CARE City site characteristics


                                     35

37

A global initiative


                      36

38

Virtual tour of the K.A.CARE City


                                    37

39

First phase development plan for K.A.CARE City


                                                  3-5 year R&D focused develop-
City infrastructure
                                                  ment program for 8,000 to 10,000
requirements for Phase 1
                                                  residents (including 800 scientists)
                           1.5 GW of renewables


                                                                                  38

40

Summary


  1. Saudi Arabia needs to add more than 80 GW of
     generation capacity by 2032. The additional
     capacity, anchored in energy conservation, would
     include nuclear, and renewable capacity. The
     investment required is in the hundreds of billion US
     dollars.
  2. Saudi Arabia has been a favorable destination of
     U.S. FDI and exports, and we would certainly
     encourage this trend to grow in the renewable and
     nuclear energy sectors, as well as in energy
     conservation, conventional energy and energy
     support services.
                                                            39

41

Thank you

More Related Content

Business Forum: Nuclear & Renewable Energy - Yamani

  • 1. Nuclear and Renewable Energy Building Resources for the Future Dr. Hashim Yamani President King Abdullah City for Atomic and Renewable Energy (K.A.CARE)
  • 2. Establishment of K.A.CARE Royal Order A/35 April 17, 2010 1
  • 4. K.A.CARE Mandate The City shall aim at contributing to the sustainable development in the Kingdom through utilization of science, research, and industries related to atomic and renewable energy for peaceful purposes in a way that leads to raising the standards of living and quality of life in the Kingdom 3
  • 5. Towards energy sustainability The Kingdom of The Kingdom of Energy Sustainable Energy Towards greater sustainability A new energy mix to meet local needs as well as maintain leadership role in the global energy landscape 4
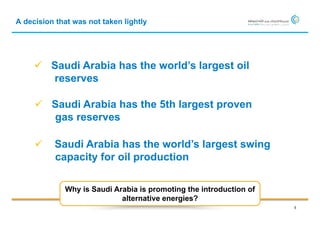
  • 6. A decision that was not taken lightly  Saudi Arabia has the world’s largest oil reserves  Saudi Arabia has the 5th largest proven gas reserves  Saudi Arabia has the world’s largest swing capacity for oil production Why is Saudi Arabia is promoting the introduction of alternative energies? 5
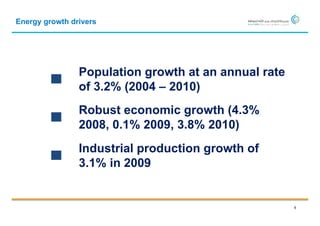
  • 7. Energy growth drivers Population growth at an annual rate of 3.2% (2004 – 2010) Robust economic growth (4.3% 2008, 0.1% 2009, 3.8% 2010) Industrial production growth of 3.1% in 2009 6
  • 8. Projected growth in electricity peak demand Electricity peak demand GW 120 70 45 2010 2020 2030 At current pace, energy peak demand is expected to exceed 120 GW by 2030 7
  • 9. Growth in oil demand between 2007 and 2010 30 25 20 15 10 5 0 -5 -10 Saudi Arabia Asia North America Europe Middle East Latin America 8
  • 10. Government allocation for water-related spending 50 9 45 8.5 40 8 35 30 7.5 (SR, bn) 25 7 20 (%) 6.5 15 6 10 5 5.5 0 5 2004 2005 2006 2007 2008 2009 2010 Water, electricity and infrastructure allocation Ratio to total state budget 9
  • 11. SEC planned retiring capacity 140,000 120,000 100,000 The Gap By 80,000 2030 MW 60,000 40,000 20,000 Today’s Fuel Mix Extended to 2030 0 10
  • 12. Forecast of energy demand growth 3.4* 8.3* MBOE MBOE 2010 2028 At current pace, domestic consumption of fossil fuels is expected to nearly triple by 2030 * Total local consumption (transportation, industry, electricity, etc) 11
  • 13. Forecasted growth of alternative energy capacity worldwide 1,545 4.7 Growth 1,105 rate 533 2007 2020 2030 % Capacity 12% 17% 19% % of Installed Capacity 12
  • 14. K.A.CARE vision The vision of K.A.CARE is to be: the driving force for making atomic and renewable energy an integral part of a national sustainable energy mix, by creating and leveraging the competitive advantages of relevant technologies for the social and economic development of the Kingdom of Saudi Arabia 13
  • 15. Gradual introduction of renewable and atomic energy Nuclear Renewables Fossil TWh Alternative energy will gradually replace fossil based generation 14
  • 16. Sustainable energy outlook for Saudi Arabia Wind/Other Ren Solar PV Solar CST Needed Capacity (MW) Nuclear New Required Fossil New Committed Existing Diesel Existing HFO Existing Crude Existing Gas 2010 2020 2030 2050 15
  • 17. The mandate and responsibilities of K.A.CARE Policies & Execution Strategies Investment Regulatory & Business R&D & Investment Technology Relations Human Capacity K.A.CARE’s Mandate Facilities 16
  • 18. R&D&T National legal Framework Pillars of sustainable development Value Chain National Economic Framework Sustainable Energy Mix National HR 17
  • 19. New implementation paradigm 1. Long Term Commitment from all Partners  Technology  Education / Training 2. Contribution to GDP Creation:  Job creation  Value chain development  Economic development spillovers  Electricity generation 18
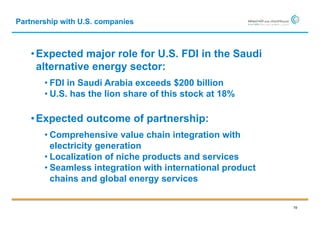
  • 20. Partnership with U.S. companies • Expected major role for U.S. FDI in the Saudi alternative energy sector: • FDI in Saudi Arabia exceeds $200 billion • U.S. has the lion share of this stock at 18% • Expected outcome of partnership: • Comprehensive value chain integration with electricity generation • Localization of niche products and services • Seamless integration with international product chains and global energy services 19
  • 21. Reaping the fruits of sustainable development Sustainable and efficient energy future for KSA Sustainable alternative “… use of alternative energy mix sustainable and reliable resources ... reduces dependency on hydrocarbon resources … and keep Balanced them as a source for execution income for a longer plans period of time...” 20
  • 22. Bases for constructing recommended energy mix • Peak demand reduction from energy efficiency and conservation. • Liquid fuel (crude oil, diesel, and HFO) that will be saved by the proposed energy mix. • Generation related matters, such as: • load factors and load management • generation technologies and their practical limitations • Human capacity building potential. • International product chains and the Saudi role, in the alternative energy sector. • Local value chain 21
  • 23. 1 15 29 43 57 60% 71 85 99 113 127 141 155 169 Seasonal peak variation in Saudi Arabia 183 197 211 225 239 253 267 281 295 309 100% 323 337 351 22 365
  • 24. Typical daily demand profile variation for Saudi Arabia Demand profile GW for a summer day in August GW Demand profile for a winter day in January 11:00 13:00 15:00 17:00 19:00 21:00 23:00 1:00 3:00 5:00 7:00 9:00 23
  • 25. GW 1 15 29 43 57 71 85 99 113 127 141 155 169 183 197 Annual day-night load variation for Saudi Arabia 211 225 239 253 Night 267 281 295 309 Day 323 337 351 24 365
  • 26. Electricity load profile breakdown in Saudi Arabia 3 Daily summer peak load Additional summer load = 20% 2 of annual peak load 1 Average annual load = 65% of annual peak load 1 15 29 43 57 71 85 99 113 127 141 155 169 183 197 211 225 239 253 267 281 295 309 323 337 351 365 25
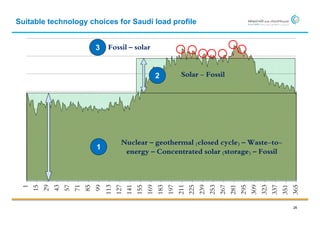
  • 27. Suitable technology choices for Saudi load profile 3 Fossil – solar 2 Solar - Fossil Nuclear – geothermal (closed cycle) – Waste-to- 1 energy – Concentrated solar (storage) – Fossil 1 15 29 43 57 71 85 99 113 127 141 155 169 183 197 211 225 239 253 267 281 295 309 323 337 351 365 26
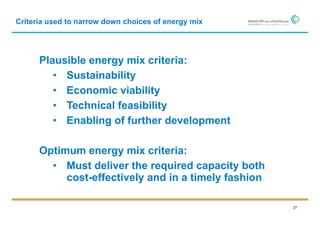
  • 28. Criteria used to narrow down choices of energy mix Plausible energy mix criteria: • Sustainability • Economic viability • Technical feasibility • Enabling of further development Optimum energy mix criteria: • Must deliver the required capacity both cost-effectively and in a timely fashion 27
  • 29. Illustrative example of a plausible energy mix Wind / Other Ren Solar PV Solar CST Nuclear New Additional Fossil Present Fossil Mix 28
  • 30. Comprehensive stakeholder engagement Saudi Arabia: • Government agencies, regulator and utility • Private sector International: • Technology providers • Project developers • Utilities Activities: • Workshops, visits and meetings (hundreds) • Case studies (hundreds) 29
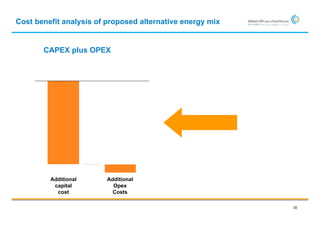
  • 31. Cost benefit analysis of proposed alternative energy mix CAPEX plus OPEX Additional Additional capital Opex cost Costs 30
  • 32. Cost benefit analysis of proposed alternative energy mix CAPEX plus OPEX plus revenue from oil saved Additional Additional Value of capital Opex oil cost Costs saved 31
  • 33. Cost benefit analysis of proposed alternative energy mix CAPEX plus OPEX plus revenue from oil saved plus investment in value chain and human capacity Industry Additional Additional Value of and capital Opex oil human cost Costs saved capital 32
  • 34. K.A.CARE commitment to developing alternative energy 1. Transparency 2. Safety and international best practices 3. Non-proliferation and highest standards of Safeguards 4. Localization of the nuclear and renewable value chain in Saudi Arabia 5. Transparent Incentives, Off Taking, and Funding Mechanism 33
  • 35. Components of K.A.CARE City The KA-CARE city will include the following ▪ National Sustainable Energy Laboratory ▪ Industrial clusters ▪ Alternative energy farm ▪ Energy park ▪ Technical training institutions ▪ Technical incubators ▪ Commercial facilities ▪ Convention centers, exhibition halls and other public amenities ▪ KA-CARE headquarters and residential facilities ▪ Basic infrastructure 34
  • 36. K.A.CARE City site characteristics 35
  • 38. Virtual tour of the K.A.CARE City 37
  • 39. First phase development plan for K.A.CARE City 3-5 year R&D focused develop- City infrastructure ment program for 8,000 to 10,000 requirements for Phase 1 residents (including 800 scientists) 1.5 GW of renewables 38
  • 40. Summary 1. Saudi Arabia needs to add more than 80 GW of generation capacity by 2032. The additional capacity, anchored in energy conservation, would include nuclear, and renewable capacity. The investment required is in the hundreds of billion US dollars. 2. Saudi Arabia has been a favorable destination of U.S. FDI and exports, and we would certainly encourage this trend to grow in the renewable and nuclear energy sectors, as well as in energy conservation, conventional energy and energy support services. 39