Location via proxy:   [ UP ]  
[Report a bug]   [Manage cookies]                
SlideShare a Scribd company logo
Z- TESTS
Test Statistics
TESTING THE SIGNIFICANT DIFFERENCE
BETWEEN

 Population or hypothesized mean, that is
  Population mean vs Sample mean
 Two sample means and two sample standard
  deviations are known, that is Sample mean1 vs
  Sample mean 2
 Two sample means and population standard
  deviation is known, that is Sample mean 1 vs
  Sample mean 2
TESTING THE SIGNIFICANCE BETWEEN
MEANS
  “ n is large or when n ≥ 30 and σ is known”
  Population mean vs Sample mean
TESTING THE SIGNIFICANCE OF DIFFERENCE
BETWEEN MEANS

 “n is large or when n ≥ 30 and σ is unknown”
 Sample mean 1 vs Sample mean 2 and 2 sample
  standard deviations are known.
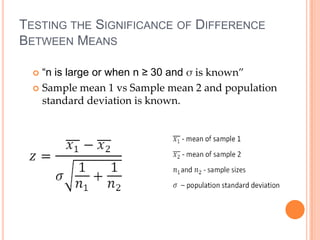
TESTING THE SIGNIFICANCE OF DIFFERENCE
BETWEEN MEANS

   “n is large or when n ≥ 30 and σ is known”
   Sample mean 1 vs Sample mean 2 and population
    standard deviation is known.
EXAMPLE 1
The average score in the final examination in College
  Algebra at ABC College is known to be 80 with a
  standard deviation of 10. A random sample of 39
  students was taken from this year’s batch and it
  was found that they have a mean score of 84. Test
  at 5% level of significance.
a. Is this an indication that this year’s batch
   performed better in College Algebra than the
   previous batches?
b. Is the mean score in College Algebra of this year’s
   batch different from 80?
EXAMPLE 2
The dean of ABC College wants to know which
  method is better in teaching Chemistry. He took a
  random sample of 40 students handled by only one
  teacher in lecture and laboratory, and found it to
  have a mean final grade of 83 with a standard
  deviation of 7. Fifty students from a group handled
  by two different teachers in lecture and laboratory
  were randomly taken and it was found that they
  have a mean final grade of 87 with a standard
  deviation of 10. Does this indicate that a two-
  teacher setup is better than a one-teacher setup?
  Test at α =0.01
EXAMPLE 3
A Statistics teacher wants to know if students exposed to the
  use of technology in the classroom got significantly higher
  scores in Statistics exam than those who are exposed to the
  traditional chalk and talk method.
 She took a sample of 30 students exposed to technology and recorded
  their Statistics exam scores:
         95    88    81    98    81   80    83    80       91   80

         75    83    88    85    81   85    83    86       89   88

         90    89    88    85    87   86    66    85       65   95

She then took a sample of 40 students who were taught using the
  traditional method
          88    78    81    87   91    90    83       84   66   81

          80    74    73    71   66    60    78       78   65   60

          71    85    89    79   80    83    75       73   80   71

          65    71    89    81   75    60    82       80   90   83


Help the teacher verify the hypothesis at α = 0.05.
EXERCISE
1. A random sample of 46 adult coyotes in a region of
northern Minnesota showed the average age to be
2.05 years, with sample standard deviation 0.82
years. However, it is thought that the overall
population mean age of coyotes is 1.75. Do the
sample data indicated that coyotes in this region of
northern Minnesota tend to live longer than the
average of 1.75 years? Use 0.01 level of significance.
2.

More Related Content

Z tests test statistic

  • 2. TESTING THE SIGNIFICANT DIFFERENCE BETWEEN  Population or hypothesized mean, that is Population mean vs Sample mean  Two sample means and two sample standard deviations are known, that is Sample mean1 vs Sample mean 2  Two sample means and population standard deviation is known, that is Sample mean 1 vs Sample mean 2
  • 3. TESTING THE SIGNIFICANCE BETWEEN MEANS  “ n is large or when n ≥ 30 and σ is known”  Population mean vs Sample mean
  • 4. TESTING THE SIGNIFICANCE OF DIFFERENCE BETWEEN MEANS  “n is large or when n ≥ 30 and σ is unknown”  Sample mean 1 vs Sample mean 2 and 2 sample standard deviations are known.
  • 5. TESTING THE SIGNIFICANCE OF DIFFERENCE BETWEEN MEANS  “n is large or when n ≥ 30 and σ is known”  Sample mean 1 vs Sample mean 2 and population standard deviation is known.
  • 6. EXAMPLE 1 The average score in the final examination in College Algebra at ABC College is known to be 80 with a standard deviation of 10. A random sample of 39 students was taken from this year’s batch and it was found that they have a mean score of 84. Test at 5% level of significance. a. Is this an indication that this year’s batch performed better in College Algebra than the previous batches? b. Is the mean score in College Algebra of this year’s batch different from 80?
  • 7. EXAMPLE 2 The dean of ABC College wants to know which method is better in teaching Chemistry. He took a random sample of 40 students handled by only one teacher in lecture and laboratory, and found it to have a mean final grade of 83 with a standard deviation of 7. Fifty students from a group handled by two different teachers in lecture and laboratory were randomly taken and it was found that they have a mean final grade of 87 with a standard deviation of 10. Does this indicate that a two- teacher setup is better than a one-teacher setup? Test at α =0.01
  • 8. EXAMPLE 3 A Statistics teacher wants to know if students exposed to the use of technology in the classroom got significantly higher scores in Statistics exam than those who are exposed to the traditional chalk and talk method. She took a sample of 30 students exposed to technology and recorded their Statistics exam scores: 95 88 81 98 81 80 83 80 91 80 75 83 88 85 81 85 83 86 89 88 90 89 88 85 87 86 66 85 65 95 She then took a sample of 40 students who were taught using the traditional method 88 78 81 87 91 90 83 84 66 81 80 74 73 71 66 60 78 78 65 60 71 85 89 79 80 83 75 73 80 71 65 71 89 81 75 60 82 80 90 83 Help the teacher verify the hypothesis at α = 0.05.
  • 9. EXERCISE 1. A random sample of 46 adult coyotes in a region of northern Minnesota showed the average age to be 2.05 years, with sample standard deviation 0.82 years. However, it is thought that the overall population mean age of coyotes is 1.75. Do the sample data indicated that coyotes in this region of northern Minnesota tend to live longer than the average of 1.75 years? Use 0.01 level of significance.
  • 10. 2.