


Modes of selection lesson
- 1. Warm up question What are the 5 forces that drive the evolution of populations? What is the only way that is adaptive? prior knowledge
- 3. Objective Students will differentiate between various modes of selection, analyze shifts in numerical distribution of traits, and use these shifts as evidence that evolution by natural selection is occurring in a population, citing specific evidence from the data to justify their conclusions
- 4. With your partner – analyze this graph investigation At least 3 observations http://www.radiolab.org /story/288733-23- weeks-6-days/
- 5. With your partner – analyze this case study https://www.youtube.com/watch?v=LyRA807djLc How did the phenotypes of the moths change? What factors drove those changes? How is this case similar/different from the birth weight example investigation
- 6. Natural Selection Requires: Variation in a population prior knowledge
- 7. Natural Selection Requires: Struggle for survival/competition prior knowledge
- 8. Natural Selection Changing environment prior knowledge
- 9. Explain how this picture shows the evolution of a population by natural selection Include the terms: • Variation • Struggle • Changing environment • How is new population better adapted? prior knowledge
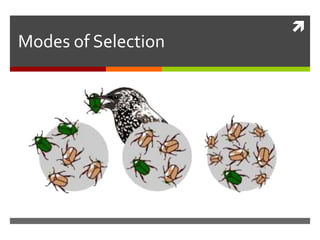
- 10. Modes of Natural Selection Natural selection can occur 3 main ways – depending on what phenotype in a population is favored concept
- 11. Stabilizing Selection Natural selection favors the average phenotype concept
- 12. Stabilizing Selection example Robins tend to lay 4 eggs each season. When they lay more eggs – there may be too many offspring for the parents to provide food for all of them When they lay fewer eggs, there may not be any healthy offspring that hatch concept
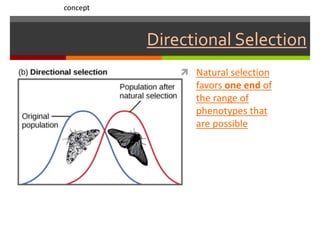
- 13. Directional Selection Natural selection favors one end of the range of phenotypes that are possible concept
- 14. Directional Selection example During dry years, there are mostly only larger, tougher seeds available as food on the Galapagos islands. Birds with the largest beaks are favored during these times. concept
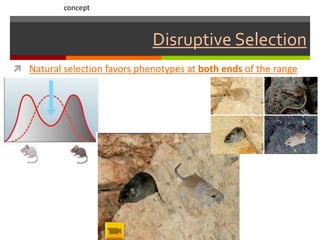
- 15. Disruptive Selection Natural selection favors phenotypes at both ends of the range concept
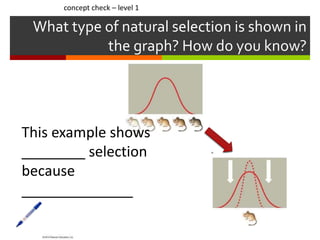
- 16. What type of natural selection is shown in the graph? How do you know? concept check – level 1 This example shows ________ selection because ______________
- 17. What type of natural selection is shown in the graph? How do you know? concept check – level 1 This example shows ________ selection because ____________
- 18. What type of natural selection is shown in the graph? How do you know? This example shows ________ selection because ______________ concept check – level 1
- 19. What type of selection is at work? How do you know? Cite specific evidence skill – level 1
- 20. What type of selection is at work? How do you know? What would a graph of this population look like? skill – level 1
- 21. In wild populations of lilies, short stemmed plants do not receive enough sunlight to grow, while long stemmed flowers often suffer wind damage skill – level 1 What type of selection is at work? How do you know? What would a graph of this population look like?
- 22. What type of selection is at work? How do you know? What would a graph of the original and new populations look like? In a population of petunias, flowers with the brightest color attract the most pollinators whereas plants of moderate color or dull color are less likely to be visited by a pollinator and thus less likely to reproduce. Data of a population of petunias first grown in a greenhouse and then planted outdoors is given below Year – 2004 Grown in greenhouse Year – 2014 Growing in the wild Brightly colored 40 80 Moderate color 85 15 Dull color 25 5 skill – level 2
- 23. What type of selection is at work? How do you know? What would a graph of the original and new populations look like? A desert population of spiny cacti are being eaten by an invasive species – the peccary. Peccaries favor cacti with few spines. skill – level 2 Number of cacti before introduction of peccaries Number of cacti after introduction of peccaries Many spines 407 524 Moderate spines 388 435 Few spines 324 36
- 25. What type of selection is at work? How do you know? What would a graph of the original and new populations look like? Just as the peccary and cacti populations are starting to adjust to each other, another invasive species arrives – a parasitic wasp. The wasp lays her eggs on the cacti, and the grubs eat the soft inner flesh of the leaves, killing the plant. Wasps prefect plants with many spines to protect their grubs. How would this new species affect the distribution of phenotypes in the cacti population? skill – level 2
- 26. Graph this data and determine the mode of selection at work on the desert cacti population
- 27. Number of spines Numberofcacti 0 5 10 15 20 25 30 0 10 20 30 40 50 60 70 80 90 100 110 120 130
- 28. Number of spines Numberofcacti 0 5 10 15 20 25 30 0 10 20 30 40 50 60 70 80 90 100 110 120 130
- 29. Objective Students will differentiate between various modes of selection, analyze shifts in numerical distribution of traits, and use these shifts as evidence that evolution by natural selection is occurring in a population, citing specific evidence from the data to justify their conclusions closure
- 30. Independent Practice Types of Sel ect ion A group of snakes were all placed into environments that had differing selective pressures. Read the data tables below and graph each snake in its environment. From the graph, determine what type of selection is being portrayed: directional, stabilizing or disruptive. 1. Snakes placed on an island where there are two predators that eat snakes. Number of Snakes at Each Length 2 cm 4cm 6 cm 8 cm 10 cm Year 1980 2 14 18 12 4 1984 4 12 8 9 8 1988 10 6 3 6 14 Graph Type of Selection: Summarize what happened to the snakes.
- 31. What type of selection is at work? How do you know?
- 32. What type of selection is at work? How do you know?
- 33. Draw a new curve on the graph below to show how the distribution of beak sizes might change as a result of selection in this new environment. A population of birds, with various size beaks, eats seeds. Small seeds can be eaten by birds with small beaks. Larger, thicker seeds can only be eaten by birds with larger, thicker beaks. Suppose there is a shortage of small seeds but that there are still many large seeds.
Editor's Notes
- Prior Knowledge CFU: the 5 fingers of evolution – could be whiteboards, TPS with random selection, PearDeck, etc
- After students describe graph – this 5 minute video from RadioLab is fun What is the most common birth weight in pounds? Why is infant mortality higher for very large or very small babies? How might technology and medical advancements influence this graph going into the future? This is called STABILIZING SELECTION – it is just one way that natural selection influences the distribution of phenotypes in a population. Today we are going to learn about the 3 major modes of selection and how data can help us determine what mode of selection is at work.
- 2 minute video showing peppered moths
- Prior Knowledge: In order for natural selection to occur, there must be differences between individuals in a population – some will have traits that help them survive and reproduce better than others (remind students that DNA (genes) give us traits and variation) variation from random mutations, also sexual reproduction, crossing over, etc
- Prior Knowledge: There must be competition and other limiting factors that lead to a struggle for existence (survival of the fittest)
- Prior Knowledge: There must be environmental resistance (pressure) natural or man-made. When environment is changing especially quickly, some populations adapt quickly, while others may die out. Can give examples like ice ages and interglacials, climate change, deforestation, etc.
- CFU on prior knowledge: longer answers required here so perhaps think-write-pair-share?
- New Concept These are pocket mice found in the deserts of New Mexico Sand colored mice hide from predators best when on the sand Black mice hide from predators best on the exposed lava rock
- Have students draw a basic copy of this graph.
- Pushes population in a certain direction with regard to phenotype
- Have students make a basic copy of this graph
- Here, it pays to be lightest and blend in with the sandy substrate OR darkest and blend in with the black lava rock. Intermediate rock pocket mice have decreased viability on both substrates https://www.hhmi.org/biointeractive/making-fittest-natural-selection-and-adaptation I just show the first 2 minutes or so of this video
- Could add a sentence frame here if needed: “This graph shows _______ selection because….” Could do this as a TWPS or TPS. I might Pear Deck or whiteboard this because it is super basic everyone should be able to do it stuff
- Could add a sentence frame here if needed: “This graph shows _______ selection because….” Could do this as a TWPS or TPS. I might Pear Deck or whiteboard this because it is super basic everyone should be able to do it stuff
- Could add a sentence frame here if needed: “This graph shows _______ selection because….” Could do this as a TWPS or TPS. I might Pear Deck or whiteboard this because it is super basic everyone should be able to do it stuff
- Ask students to cite specific evidence from the “text” to support their conclusions. Start video at 6 minutes and end at 9:15, or play all 15 minutes if you like https://www.hhmi.org/biointeractive/origin-species-beak-finch
- Hand pollination could occur in the greenhouse population – thus eliminating the need for wild pollinators. Ask students to cite specific data/evidence from the prompt in their answer. You might stress to students that in both cases (pollinators and finches), it was a fairly rapid change in the environment that led to directional selection. This is when we see directional selection most often.
- Extra CFU
- Extra CFU
- Extra CFU