03/30/2009 - 4Q08 and 2008 Earnings Results
- 2. 2008 main highlights ► 2008 – 14% growth on EBITDA, representing R$ 1,254 million – 14% increase on net income, totalizing R$ 692 million – Proposal to R$ 31 million of interest on equity ► Subsequent Events – Reversion of R$ 13 million in 1Q09 related to the TUSDgeneration agreement – Proposal to distribute R$ 167 in complementary dividends, to be deliberated on the Ordinary Shareholders Meeting: • R$ 0.42 per common share • R$ 0.46 per preferred share 2
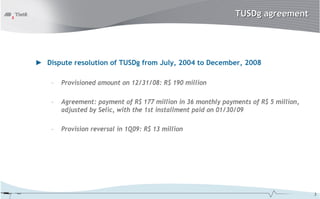
- 3. TUSDg agreement ► Dispute resolution of TUSDg from July, 2004 to December, 2008 – Provisioned amount on 12/31/08: R$ 190 million – Agreement: payment of R$ 177 million in 36 monthly payments of R$ 5 million, adjusted by Selic, with the 1st installment paid on 01/30/09 – Provision reversal in 1Q09: R$ 13 million 3
- 4. Operational disposal Generation Energy – MW Average1 121% 118% 115% 112% 107% 1,543 1,510 1,467 1,424 1,363 2004 2005 2006 1 2007 2008 Generation – MW Average Generation / Assured Energy ► Since 2003, AES Tietê has a historical generation average of 14% above assured energy 1- Generated energy divided by the amount of period hours 4
- 5. Assured energy contracted Billed Energy – GWh1 13,421 13,148 573 331 Spot Market 1,740 1,680 MRE 11,108 11,138 AES Eletropaulo 2007 2008 ► Assured energy fully contracted by AES Eletropaulo until Dec, 2015: – IGP-M Indexed – Price from July 2008 to June/09 – R$ 149.72/MWh ► 2008 MRE Tariff – R$ 7.77/MWh ► CCEE Average Price: – 2008 – R$ 135.29/MWh – 2007 - R$ 96.99/MWh 1 - Including energy purchased 5
- 6. Expansion requirement of 15% ► Requirement: increase installed capacity, by at least, 15% (400 MW), until December 2007: – Increase the installed capacity in São Paulo State; or – Purchase energy from new plants, located in São Paulo, through long term agreements (at least 5 years). ► Restrictions to accomplish the requirement: – Insufficient hydro resources and environmental restrictions to install Thermo plants; – Insufficiency of gas supply; – “New Model of Electric Sector” (Law # 10,848/04). ► Aneel, in August 2008, informed that the issue is not linked to the concession. ► The São Paulo State is analyzing the process, considering Aneel decision. ► Popular law action against Federal Government, Aneel, AES Tietê, and Duke. – Status: Defense filed on first instance in October 2008 by AES Tietê. 6
- 7. Increasing investments Investments – R$ million 2008 Investments 101 New SHPP’s1 Investments 33 36% 59 51 47 8 20 48% 12 3% 28 67 22 12% 12 43 39 35 28 22 12 Equip. and Maint. New SHPP’s 2003 2004 2005 2006 2007 2008 2009(e) IT Environment 1- SHPP Jaguari Mirim and Piabanha 7
- 8. 11% Increasing revenues Net Revenue – R$ million +11% 1,621 1,464 +18 % 359 423 2007 2008 4Q07 4Q08 ► 13.44% readjustment on AES Eletropaulo PPA from July 2008 ► Positive balance in 4Q07 as a consequence of the reclassification on PIS/COFINS tax basis in 2Q07 (R$ 26 million on net revenue and operational provisions) 8
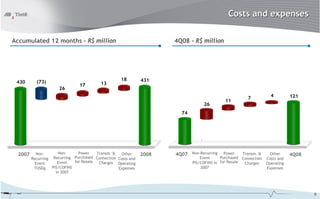
- 9. Costs and expenses Accumulated 12 months – R$ million 4Q08 – R$ million 18 431 430 (73) 13 17 26 4 121 7 11 26 74 2007 Non- Non- Power Transm. & Other 2008 4Q07 Non-Recurring Power Transm. & Other 4Q08 Recurring Recurring Purchased Connection Costs and Event Purchased Connection Costs and Event Event for Resale Charges Operating PIS/COFINS in for Resale Charges Operating TUSDg PIS/COFINS Expenses 2007 Expenses in 2007 9
- 10. 14% increase on 2008 Ebitda Accumulated 12 months – R$ million 4Q08 – R$ million 126 1,254 73 1,099 (43) 20 (4) 302 319 2007 Non- Sales1 Other Costs 2008 4Q07 Sales1 Other Costs and 4Q08 Recurring and Expenses2 Expenses2 Event TUSDg 1 - Sales: Net revenue less sales costs 2 - Does not include depreciation and amortization 10
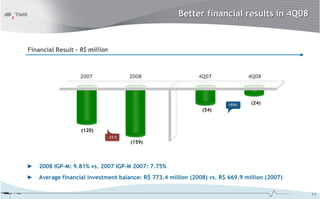
- 11. Better financial results in 4Q08 Financial Result – R$ million 2007 2008 4Q07 4Q08 +55% (24) (54) (120) -33 % (159) ► 2008 IGP-M: 9.81% vs. 2007 IGP-M 2007: 7.75% ► Average financial investment balance: R$ 773.4 million (2008) vs. R$ 669.9 million (2007) 11
- 12. Sustainable profitability and dividend payment Net Income – R$ million Dividend Payout – R$ million Net Margin Dividends Pay-out Yield PN 43% 100 % 100 % 100 % 42% +14% 692 12 % 12 % 609 10 % 46% 47% 614 693 609 +20% 166 198 2007 2008 4Q07 4Q08 2006 2007 20081 ► Proposed earnings to be submitted to the ordinary shareholders meeting on April 27, 2009 ► Complementary dividends of R$ 167 million ► Interest on Equity (IE): R$ 31 million – R$ 0.42 per common share – R$ 0.08 per common share2 – R$ 0.46 per preferred share – R$ 0.09 per preferred share2 – Date ex-dividends: 04/28/2009 – Ex-IE date: 12/20/2008 – Payment: 05/07/2009 – Payment: 05/07/2009 1 - including proposed complementary dividend 2 - Gross amount 12
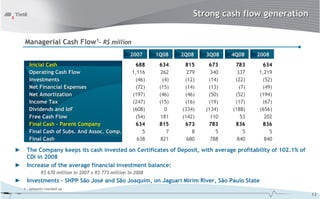
- 13. Strong cash flow generation Managerial Cash Flow1– R$ million 2007 1Q08 2Q08 3Q08 4Q08 2008 Inicial Cash 688 634 815 673 783 634 Operating Cash Flow 1,116 262 279 340 337 1,219 Investments (46) (4) (12) (14) (22) (52) Net Financial Expenses (72) (15) (14) (13) (7) (49) Net Amortization (197) (46) (46) (50) (52) (194) Income Tax (247) (15) (16) (19) (17) (67) Dividends and IoF (608) 0 (334) (134) (188) (656) Free Cash Flow (54) 181 (142) 110 53 202 Final Cash – Parent Company 634 815 673 783 836 836 Final Cash of Subs. And Assoc. Comp. 5 7 8 5 5 5 Final Cash 638 821 680 788 840 840 ► The Company keeps its cash invested on Certificates of Deposit, with average profitability of 102.1% of CDI in 2008 ► Increase of the average financial investment balance: – R$ 670 million in 2007 x R$ 773 million in 2008 ► Investments – SHPP São José and São Joaquim, on Jaguari Mirim River, São Paulo State 1 - Amounts rounded up 13
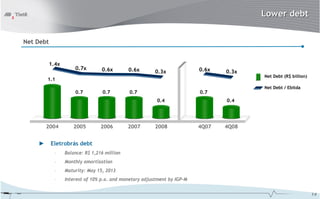
- 14. Lower debt Net Debt 1.4x 0.7x 0.6x 0.6x 0.6x 0.3x 0.3x Net Debt (R$ billion) 1.1 Net Debt / Ebitda 0.7 0.7 0.7 0.7 0.4 0.4 2004 2005 2006 2007 2008 4Q07 4Q08 ► Eletrobrás debt – Balance: R$ 1,216 million – Monthly amortization – Maturity: May 15, 2013 – Interest of 10% p.a. and monetary adjustment by IGP-M 14
- 15. Corporate governance AES Tietê X Ibovespa X IEE – 12 Months1 Daily Average Volume - R$ thousand 2008 9,097 8,160 +54 % 120 3,566 2,692 5,761 100 +72 % - 12% 1,573 - 11% 80 3,325 1,601 5,531 5,468 60 - 41% 4,188 1,724 40 Dec-071 Mar-08 Jun-08 Sep-08 Dec-08 2005 2006 2007 2008 2009 120 Preferred Common + 13% + 4% 100 + 3% GETI4 IEE 80 IBOV Dec-082 Jan-09 Feb-09 1 - Data Base: 12/28/07 = 100 2 – Data Base: 12/29/08 = 100 15
- 16. Social responsibility “Casa da Cultura e Cidadania” Project More than 3 thousand children, teenagers and adults benefited Units location: Barra Bonita, Lins, São José do Rio Pardo and Caconde Own and encouraged investments : about R$ 9 million in 2008 Activities: theater, dance, music, circus arts, visual arts, artistic gymnastics and courses of income generation “Energia do Bem” Project Launched in December 2008 Objective: encourage employee to transform the low income communities and develop non governmental institutions Distributing Performing to Endeavoring in “Energia do Bem “ transform the community
- 17. Another year of recognition ► Maintenance on 2009 Corporate Sustainability Index (BMF&Bovespa – Nov.08) ► One of the 20 model corporation on sustainability on Brazil (Guia de Sustentabilidade da Revista EXAME – Oct.08) ► One of the 150 best corporations to work (Revista Você S.A. / EXAME – Sep. 08) ► Best performance on electricity industry sector for Valor 1000 (Jornal Valor Econômico – Jul.08) ► Most profitable corporation on the electricity industry (Guia Maiores e Melhores (Revista EXAME – Jul.08) ► Most profitable company in the last 5 years among the 500 largest publicly companies in Brazil (Revista Conjuntura Econômica, da FGV – Jul.08) 17
- 18. 2008 Results The statements contained in this document with regard to the business prospects, projected operating and financial results, and growth potential are merely forecasts based on the expectations of the Company’s Management in relation to its future performance. Such estimates are highly dependent on market behavior and on the conditions affecting Brazil’s macroeconomic performance as well as the electric sector and international market, and they are therefore subject to changes. 18
