 A webcomic of romance,
sarcasm, math, and language.
Special 10th anniversary edition of WHAT IF?—revised and annotated with brand-new illustrations and answers to important questions you never thought to ask—out now. Order it here!
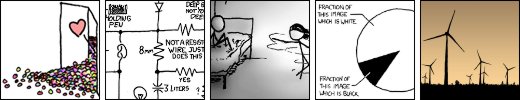
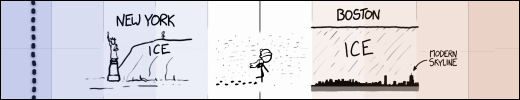
Tall Infographics

Permanent link to this comic: https://xkcd.com/1273/
Image URL (for hotlinking/embedding): https://imgs.xkcd.com/comics/tall_infographics.png
Comics I enjoy:
Three Word Phrase, SMBC, Dinosaur Comics, Oglaf (nsfw), A Softer World, Buttersafe, Perry Bible Fellowship, Questionable Content, Buttercup Festival, Homestuck, Junior Scientist Power Hour
Three Word Phrase, SMBC, Dinosaur Comics, Oglaf (nsfw), A Softer World, Buttersafe, Perry Bible Fellowship, Questionable Content, Buttercup Festival, Homestuck, Junior Scientist Power Hour
xkcd.com is best viewed with Netscape Navigator 4.0 or below on a Pentium 3±1 emulated in Javascript on an Apple IIGS
at a screen resolution of 1024x1. Please enable your ad blockers, disable high-heat drying, and remove your device
from Airplane Mode and set it to Boat Mode. For security reasons, please leave caps lock on while browsing.
at a screen resolution of 1024x1. Please enable your ad blockers, disable high-heat drying, and remove your device
from Airplane Mode and set it to Boat Mode. For security reasons, please leave caps lock on while browsing.
This work is licensed under a Creative Commons Attribution-NonCommercial 2.5 License.
This means you're free to copy and share these comics (but not to sell them). More details.